Wet vs. Dry Laser Diffraction: Which Dispersion Method Should You Choose?
2026-11-11News
When developing a laser diffraction method for a powder, one of the first decisions is whether to use wet or dry dispersion. Inadequate dispersion leaves agglomerates that affect the result; excessive dispersion energy can break particles. Meaningful particle size measurements depend on finding the right balance.
We draw on test cases involving domperidone active pharmaceutical ingredient (API), lactose, coffee, and solid electrolytes for all-solid-state batteries (ASSBs). These examples show how sample properties, dispersion performance, sample quantity, the dispersion medium, and laboratory conditions can guide method selection for R&D and quality control (QC).
Start with wet dispersion when a suitable liquid medium is available and wetting and ultrasonication are needed to break up agglomerates. Consider dry dispersion when you want to retain the dry powder state and the particles can withstand the required airflow. Test a range of dispersion intensities on your material to identify conditions that deagglomerate it while preserving particle integrity.
How do wet and dry dispersion differ?
Wet and dry methods use the same laser diffraction principle to analyze particles. The difference is how the sample enters the measurement zone: wet dispersion suspends particles in a liquid, while dry dispersion uses airflow to disperse the powder. Method selection therefore depends on both the effectiveness of dispersion and whether the liquid or airflow changes the sample.
How do agglomeration and fragility affect your choice?
For powders prone to agglomeration, wet dispersion combines wetting, dispersants, and mechanical dispersion. Once the liquid has thoroughly wetted the particles, assess the effect of stirring. If agglomerates remain, add a suitable dispersant or apply ultrasonication. Appropriate media and dispersion conditions also help control reagglomeration. For more preparation guidance, see our wet sample preparation guide.
When assessing whether fragile crystals can be measured dry, consider both pressure and disperser design. The BT-912 dry dispersion unit, available for the Bettersizer 2600 Plus, uses a Venturi design to deagglomerate particles through airflow shear, particle-to-particle collisions, and particle-to-wall collisions. Controlling pressure and feeding conditions helps separate agglomerates while limiting particle damage.
Domperidone API: Does a smaller size mean better dispersion?
In the domperidone API study, the non-micronized sample continued to become finer as dry dispersion pressure increased, with no clear plateau. Particle images showed that the imaged coarse particles were individual particles rather than agglomerates. This finding points to the risk of breaking those particles as pressure increases.
Wet measurements used water, Tween 80 for wetting, and low-intensity ultrasonication. D10, D50, and D90 all decreased after micronization, showing the distribution changes before and after processing more clearly. Based on repeated measurements, particle images, and the distributions before and after micronization, we recommend wet dispersion for these samples.
Lactose: Low-pressure dry dispersion can be an option
The lactose study identified usable low-pressure dry dispersion conditions through pressure titration. D90 was relatively stable at approximately 0.1–0.2 MPa, and 0.1 MPa was selected for testing. At higher pressures, particle size decreased again, indicating a risk of breakage. For laboratories seeking a dry powder method, pressure titration helps identify a range that provides sufficient dispersion while preserving particle integrity.
How can you tell when dispersion is sufficient?
Assess dispersion using D10, D50, D90, and the full particle size distribution together. For a volume-based distribution, D10, D50, and D90 are the particle diameters at which the cumulative volume reaches 10%, 50%, and 90%, respectively. They reveal changes at the fine end, median, and coarse end. D90 is a percentile at the coarse end, not the maximum particle size. The full curve also shows distribution shape and changes across the size range.
For dry dispersion, pressure titration identifies a working range. Keep other measurement conditions constant, increase pressure step by step, and compare the percentiles and full distribution. A decrease at the coarse end can indicate improved deagglomeration; a stable distribution plateau is a key area for selecting the working pressure. Use repeated measurements and particle images to assess deagglomeration and particle integrity before setting the test conditions. If further pressure increases produce more fines and a continuing shift toward smaller sizes, use images or validated wet results to investigate breakage.
Coffee: Find the dispersion plateau by watching the coarse end
The coffee study used dry dispersion to avoid physicochemical changes that conventional aqueous media could cause. D50 and D90 both decreased as pressure rose from 0.05 MPa to 0.1 MPa. Results were relatively stable at 0.1–0.15 MPa, and 0.15 MPa was selected.
In these tests, D90 changed more noticeably than D50, making the effect of dispersion conditions clearer at the coarse end. Comparing several percentiles with the full curve helps reveal changes that the median alone can miss.
How much ultrasonication does wet dispersion need?
For wet dispersion, ultrasonic intensity and treatment time are adjusted to find suitable conditions. Once the medium and stirring conditions are established, vary intensity or time separately and track the particle size response to identify a stable range. Compare particle images, temperature, and the distribution after ultrasonication stops to assess deagglomeration and whether the dispersion remains stable.
If particle size continues to decrease, use particle images, temperature, and the sample's behavior in the medium to distinguish continued deagglomeration from particle damage or changes caused by the medium. Our wet dispersion guidance explains how to increase dispersion energy gradually so that the effect of each condition can be observed.
Sample quantity and medium: Consider routine testing, too
When sample is limited, compare actual solid consumption
When R&D sample quantities are limited, compare methods by the mass of solid actually consumed. Record the volume of predispersed suspension transferred and the volume of circulation medium separately. This helps account for sample consumption, medium use, and liquid waste handling for each test.
For the Bettersizer 2600 Plus, the BT-814 provides an 8 mL small-volume wet cell for tests with limited liquid volumes. The BT-903 is designed for small quantities of dry powder, with a sample mass range of 0.02–1 g. These configurations address different needs: one uses a small liquid volume, while the other accommodates a small powder mass.
Testing small quantities starts with representative sampling. Routine QC also requires stable feeding, convenient cleaning, residue control, and consistency between operators. Including these factors in method development helps turn R&D measurements into repeatable daily operation.
Choose a liquid that wets particles and keeps the sample stable
A wet dispersion medium should wet the particles and keep the sample stable throughout dispersion and measurement. If water is unsuitable, consider a compatible organic medium or a dry method. Base the choice on whether the sample dissolves, swells, or reacts, and whether a stable dispersion can be maintained.
We offer organic-solvent dispersion configurations such as the BT-80N and BT-80N Pro. Refer to the relevant product documentation for the supported media. Match the target solvent to the wetted materials in the pump, tubing, seals, and sample cell, and define the cleaning liquid, cleaning procedure, and waste collection arrangements at the same time.
ASSB solid electrolytes: Choosing wet or dry dispersion for moisture-sensitive materials
Testing moisture-sensitive solid electrolytes requires an inert atmosphere throughout sampling, dispersion, and measurement. In our ASSB solid electrolyte study, we installed the Bettersizer 2600 Plus inside a custom glovebox, using wet dispersion for sulfides and dry dispersion with nitrogen for halides.
Sulfide samples were measured with the BT-812 wet dispersion unit using n-heptane at a circulation speed of 1,200 rpm. Ultrasonication was set to 35 W for 120 s and remained active during measurement. Halide samples were measured with the BT-912 dry dispersion unit, using 2–5 g of powder dispersed with nitrogen at 0.4 MPa.
These two approaches address different dispersion needs. For fine sulfide powders that tend to stick together, wetting with a nonaqueous medium and controlled ultrasonication help disperse particles during circulation. For halide powders that feed consistently and withstand airflow, dry dispersion with nitrogen handles the sample directly. It removes the need for liquid preparation, solvent residue control, and organic liquid waste handling, focusing glovebox operations on feeding, atmosphere control, and dust collection.
Nonaqueous testing inside a glovebox requires the solvent-resistant dispersion unit to be matched with the liquid circuit, sealed connections, and gas/liquid feedthroughs. The study's airtight feedthroughs, waste recovery, and inert-gas supply illustrate how these elements can be arranged. At the project planning stage, we can discuss wetted materials and connection options with you based on the target solvent and oxygen and moisture requirements.
Five steps to select a method for your sample
Define the measurement target: Do you want to characterize fully deagglomerated particles or the particle population in a particular use condition? Plan representative sampling accordingly.
Identify compatible media and conditions: Assess wetting, dissolution, swelling, and reaction risks, as well as sensitivity to moisture and oxygen, to identify suitable media and laboratory conditions.
Adjust dispersion intensity step by step: Use pressure titration for dry methods. For wet methods, adjust stirring, dispersant, ultrasonic intensity, and treatment time separately while holding other conditions constant.
Assess results alongside particle condition: Compare D10, D50, D90, the full distribution, repeated measurements, and available particle images to identify conditions that deagglomerate the sample sufficiently while preserving particle integrity.
Document the method: Include sample and medium quantities, feeding, dispersion, measurement time, cleaning, and result interpretation in the SOP. Confirm that it suits the target sample and routine operation.
Choose the dispersion method, then match the Bettersizer configuration
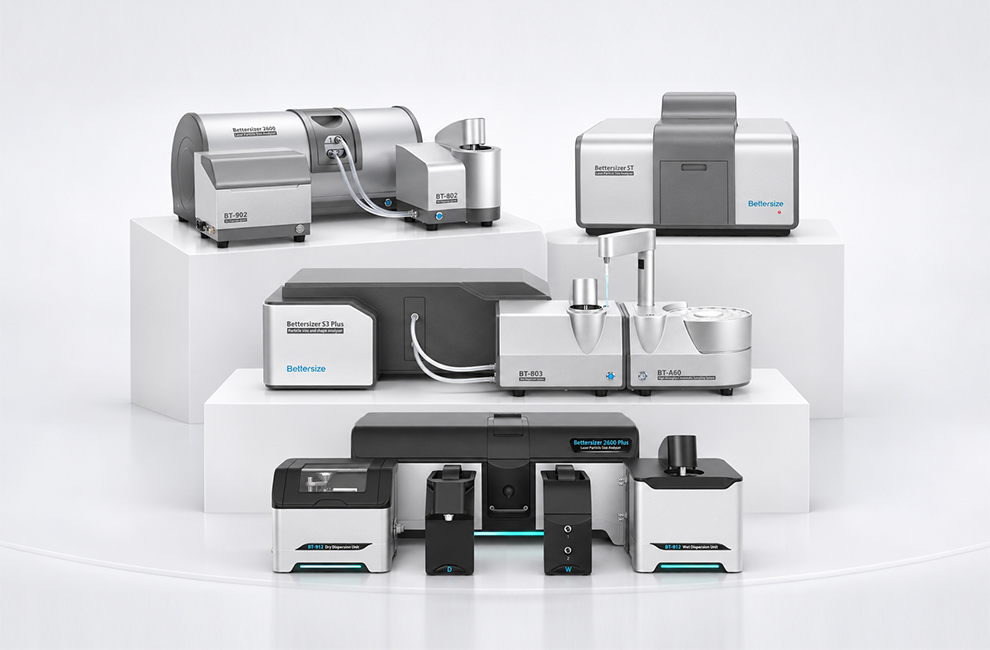
Once the dispersion method is defined, select the configuration around the testing requirements. For routine aqueous wet measurements, the Bettersizer 2600 uses the BT-802 and the Bettersizer 2600 Plus uses the BT-812. Their corresponding routine dry units are the BT-902 and BT-912. For organic solvents, select a BT-80N or BT-80N Pro configuration compatible with the target medium. When sample or liquid quantities are limited, compare the corresponding small-sample and small-volume options.
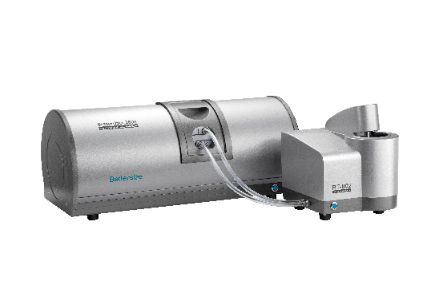
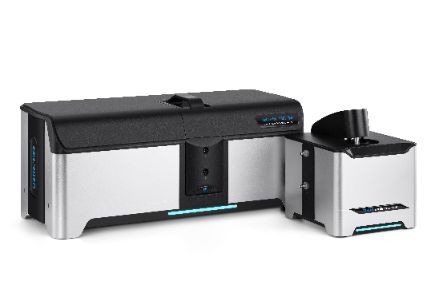
When images of agglomerates or particle morphology are needed, the 2600 Plus dynamic image analysis capability can provide images within the supported size range and configurations. These images help interpret the particle size distribution and support dispersion optimization.
Use our sample testing service to discuss a dispersion approach with our application team. Share the material type, expected particle size, available sample quantity, candidate media, and environmental requirements. We can then focus the evaluation on airflow dispersion, ultrasonic deagglomeration, and solvent-resistant configurations for your material.
Frequently asked questions
Must moisture-sensitive powders be measured dry?
Wet dispersion is also an option: disperse the sample in a compatible low-moisture medium and protect sampling, transfer, and measurement with an inert atmosphere. The sulfide case combined n-heptane, ultrasonication, and a custom glovebox.
Is wet dispersion the better choice for fragile crystals?
Wet dispersion offers wetting and controlled ultrasonication for deagglomeration, while low-pressure dry dispersion may also preserve particle integrity. The different choices for domperidone API and lactose show that the key is finding an intensity range that breaks up agglomerates without damaging the crystals.
Does a stable D50 mean the sample is sufficiently dispersed?
Compare D10, D90, and the full distribution to reveal changes in the fines and coarse end. Combine these results with repeat sampling and particle images to determine whether a stable D50 corresponds to sufficient dispersion and intact particles.
Will higher pressure or longer ultrasonication improve the results?
The right intensity provides sufficient deagglomeration while preserving particle integrity. Use a pressure titration or a stepwise study of ultrasonic intensity and treatment time to identify a range where the distribution is stable. Monitoring particle images, temperature, and sample condition in the medium is more useful for establishing reliable conditions than continually increasing dispersion intensity.
Can I add an organic solvent directly to a wet dispersion unit?
Select wetted materials and a dispersion unit compatible with the target solvent, and include cleaning and waste collection in the method. The BT-80N and BT-80N Pro offer configurations for organic-solvent testing; select the medium according to the specific configuration.
Does wet dispersion always use less sample?
Compare the mass of solid actually consumed per test, and record suspension transfer volume and circulation medium volume separately. Both small-volume wet and small-sample dry configurations can be evaluated. The amount used depends on representative sampling, sample concentration, and feeding requirements.
|
FURTHER READING / COMPARISON Want to know which one Read the comparison page to see what our instruments can help your workflow. Read the Comparison →Laser Diffraction · Bettersizer Series |
 |

Rate this article
Share On


Recent News