Laser Diffraction vs. Dynamic Image Analysis: When Shape Matters
2026-11-10News
Whether particle shape matters depends on the decision you need to make. For comparing overall particle size distributions or monitoring milling trends, laser diffraction often provides efficient, practical data. If you also need to identify needle-shaped crystals, examine agglomerates, or investigate small populations of coarse particles, dynamic image analysis can add valuable information. Combining the two techniques brings particle size distributions and particle images together in a single wet measurement workflow.
This distinction is particularly useful for fine powders. Similar distribution curves do not answer every question about morphology, and a nearly unchanged D50 can leave important differences at the coarse end unexplored. To understand why, start with what “particle size” actually means.
Why Does Laser Diffraction Represent Particles as Equivalent Spheres?
Laser diffraction (LD) measures the light scattered by a particle population at different angles, then uses an inverse calculation with an optical model to derive its particle size distribution. Common models describe scattering using spherical particles: the software seeks a combination of sphere sizes and proportions whose calculated scattering pattern matches the measured signal as closely as possible.
The reported sizes therefore remain equivalent sphere diameters even when the sample contains needles, platelets, or other irregular particles. Here, “equivalent” refers to the scattering response. It is not a direct measurement of a needle’s length, nor does the instrument measure each particle’s actual three-dimensional volume and then convert it into a sphere.
This representation makes it convenient to compare the overall distributions of particle populations. For samples with relatively stable morphology measured using a consistent method, LD is useful for tracking changes during milling and comparing formulations or batches. When the question extends to what the particles actually look like, shape information becomes valuable.
What Does Dynamic Image Analysis Add?
Dynamic image analysis (DIA) captures two-dimensional projections of particles as they pass through an imaging zone, then extracts size and shape parameters through image processing. The area-equivalent diameter is the diameter of a circle with the same area as the particle’s projection. Length, width, Feret diameters, and circularity describe other aspects of the particle.
For example, the maximum Feret diameter is the greatest separation between two parallel tangents to the particle’s projected outline as their orientation changes. It helps identify long or large projected dimensions. Circularity describes how closely that projection resembles a circle; it is distinct from three-dimensional sphericity.
An AlSi10Mg metal powder provides a practical example. One particle recorded by imaging had an area-equivalent diameter of 91.67 μm, a length of 139.3 μm, and a width of 62.87 μm. These three values describe different geometric features of the same particle. For elongated particles, length and width can therefore be more relevant than a single equivalent diameter.
For needle-shaped crystals, a single equivalent diameter can obscure the difference between length and width, while an image reveals the elongated outline. For agglomerates, images provide clues about clustered structures and help determine whether dispersion conditions need further investigation. Images show the particles in their state during measurement, so morphology should be interpreted alongside the dispersion method and knowledge of the sample.
Using LD and DIA results together reveals both the overall distribution and particle geometry. Scattering-equivalent diameters describe the optical response of the particle population, while area-equivalent diameters, lengths, and Feret diameters add projection-based information. Selecting the appropriate volume- or number-based statistics lets you examine the metrics relevant to the same material question.
Three Situations Where Shape Information Helps
1. Needle Length Affects the Decision
If your study concerns crystal habit, the proportion of elongated particles, or changes in length, examine length and width directly. Two particles with similar area-equivalent diameters may have very different outlines: one elongated, the other nearly circular. For needle-shaped crystals within the imaging range, DIA turns that distinction into a projected image you can review.
This is also why differences between laser diffraction results and microscope images are best investigated by first checking the size definition. Establish whether you are comparing scattering-equivalent diameter, length, or projected area before assessing the contribution of particle shape.
Shape does not necessarily change with size. Three corundum abrasive powders had D50 values of 14.5, 143.3, and 439.3 μm, but similar circularity values of 0.857, 0.860, and 0.861. Measuring size and shape separately shows which property is changing, rather than inferring morphology from particle size.
2. Distinguishing Coarse Particles from Agglomerates
Alumina powder provides a direct example of agglomerate investigation. Of two batches of the same powder grade, the abnormal batch showed a coarse-particle signal in the 6–20 μm range. Researchers set the S3 Plus to capture images of particles in the 6–20 μm interval and used particle images together with an aspect-ratio scatter plot to associate the abnormal distribution with irregular alumina agglomerates.
This combined approach moves the investigation from identifying a change at the coarse end to identifying which particles warrant attention. Sampling, dispersion, or production conditions can then be investigated. When measuring primary particles, assess whether agglomerates have been adequately dispersed. When studying the actual dispersion state, preserve the structures you intend to observe during sample preparation.
3. D50 Changes Little, but Rare Oversize Particles Matter
D50 is the diameter at 50% of the cumulative distribution; D90 corresponds to 90%. Neither identifies the sample’s largest particle. When investigating a small population of coarse particles, examine the full distribution, the coarse end, and particle images together instead of relying on the median alone.
“Oversize” is application-specific. In a suspension dominated by submicron particles or particles a few micrometers across, particles larger than 10 μm may warrant attention. In a sand sample, that same size may belong to the fine fraction. A 10 μm threshold can guide an investigation, but it is not a universal acceptance limit for all materials.
Quartz Powder Mixtures: What Can Similar D50 Values Hide at the Coarse End?
In a Bettersizer S3 Plus experiment, coarser FH31 quartz powder was added to finer P3A quartz powder and measured in water using the BT-803 circulation and dispersion system. Each sample was measured at least three times and the results averaged. The study combined LD with 0.5× CCD imaging, using a maximum Feret diameter (Fmax) greater than 500 μm as the threshold for including image data in the combined distribution.
At an FH31 addition of 0.5 wt.%, the LD results extracted from the same combined measurement dataset were compared with the combined analysis results below. Both are expressed as volume distributions (Q3).
The D50 values were almost identical, yet the combined analysis showed a more distinct coarse-particle peak at approximately 500 μm. One coarse particle recorded by the camera had a maximum Feret diameter of 556.5 μm. For this sample and these measurement settings, imaging added evidence at the coarse end that LD alone had not fully represented.
The reported D100 comes from the cumulative distribution curve, including its smoothing and size-class representation. The maximum Feret diameter measured from an individual image describes that particle’s projected dimension. The values of 539.0 μm and 556.5 μm therefore serve different purposes: interpreting the overall coarse end and the geometry of an individual particle. Reviewing them together provides a fuller understanding of the coarse particles.
Particles Above 10 μm: Another Perspective from Pesticide Suspension Concentrates
Pesticide milling data show how a fine main population can coexist with coarse particles. In a pesticide suspension concentrate (SC) milling study, the sample milled for 0.5 hours had a D50 of 1.015 μm and a D90 of 12.39 μm. Separate static imaging with the BeVision S1 showed coarse particles larger than 10 μm. At 4 hours, D50 had fallen to 0.812 μm and D90 to 4.749 μm, while the images also showed finer particles.
This study used Bettersizer ST laser diffraction and separate imaging to demonstrate the complementary value of an overall distribution and image review. The S3 Plus quartz experiment further demonstrates how simultaneous combined analysis adds information at the coarse end. Together, the studies illustrate why images are useful and what combined measurement can contribute.
Graphite and Metal Powders: Why Assess Size and Shape Together?
Graphite: Coarser Does Not Necessarily Mean Higher Tapped Density
A study of graphite anode materials compared the particle size, circularity, and tapped density of three samples. LD was used for particle size and DIA for circularity, with the results then compared against tapped density data. The findings are summarized below.
Sample C was coarser than B, yet its tapped density was lower. Sample B had both the highest median circularity and the highest tapped density of the three samples. Tapped density is the mass of graphite per unit volume after tapping. Assessing circularity, particle size distribution, and tapped density together helps screen anode feedstocks for better packing performance and provides powder property data for subsequent optimization of electrode compaction and volumetric energy density.
Additive Manufacturing: Measure How Spatter Particles Change
Another AlSi10Mg study compared fresh powder with spatter particles recovered from the fabrication zone after selective laser melting. The volume-based D50 increased from 44.39 μm for the fresh powder to 62.89 μm for the spatter sample, while the number-weighted median circularity increased from 0.904 to 0.917. In this study, the spatter particles were coarser and their projections were more circular; the assumption that particles necessarily become more irregular after use did not apply to these samples.
Recording size and shape separately provides a more complete basis for assessing material condition. Deciding whether these spatter particles can be reused also requires an evaluation of alloy composition and the quality of parts made from the recovered material.
Combining Size and Shape in One Measurement: Two Bettersize Configurations
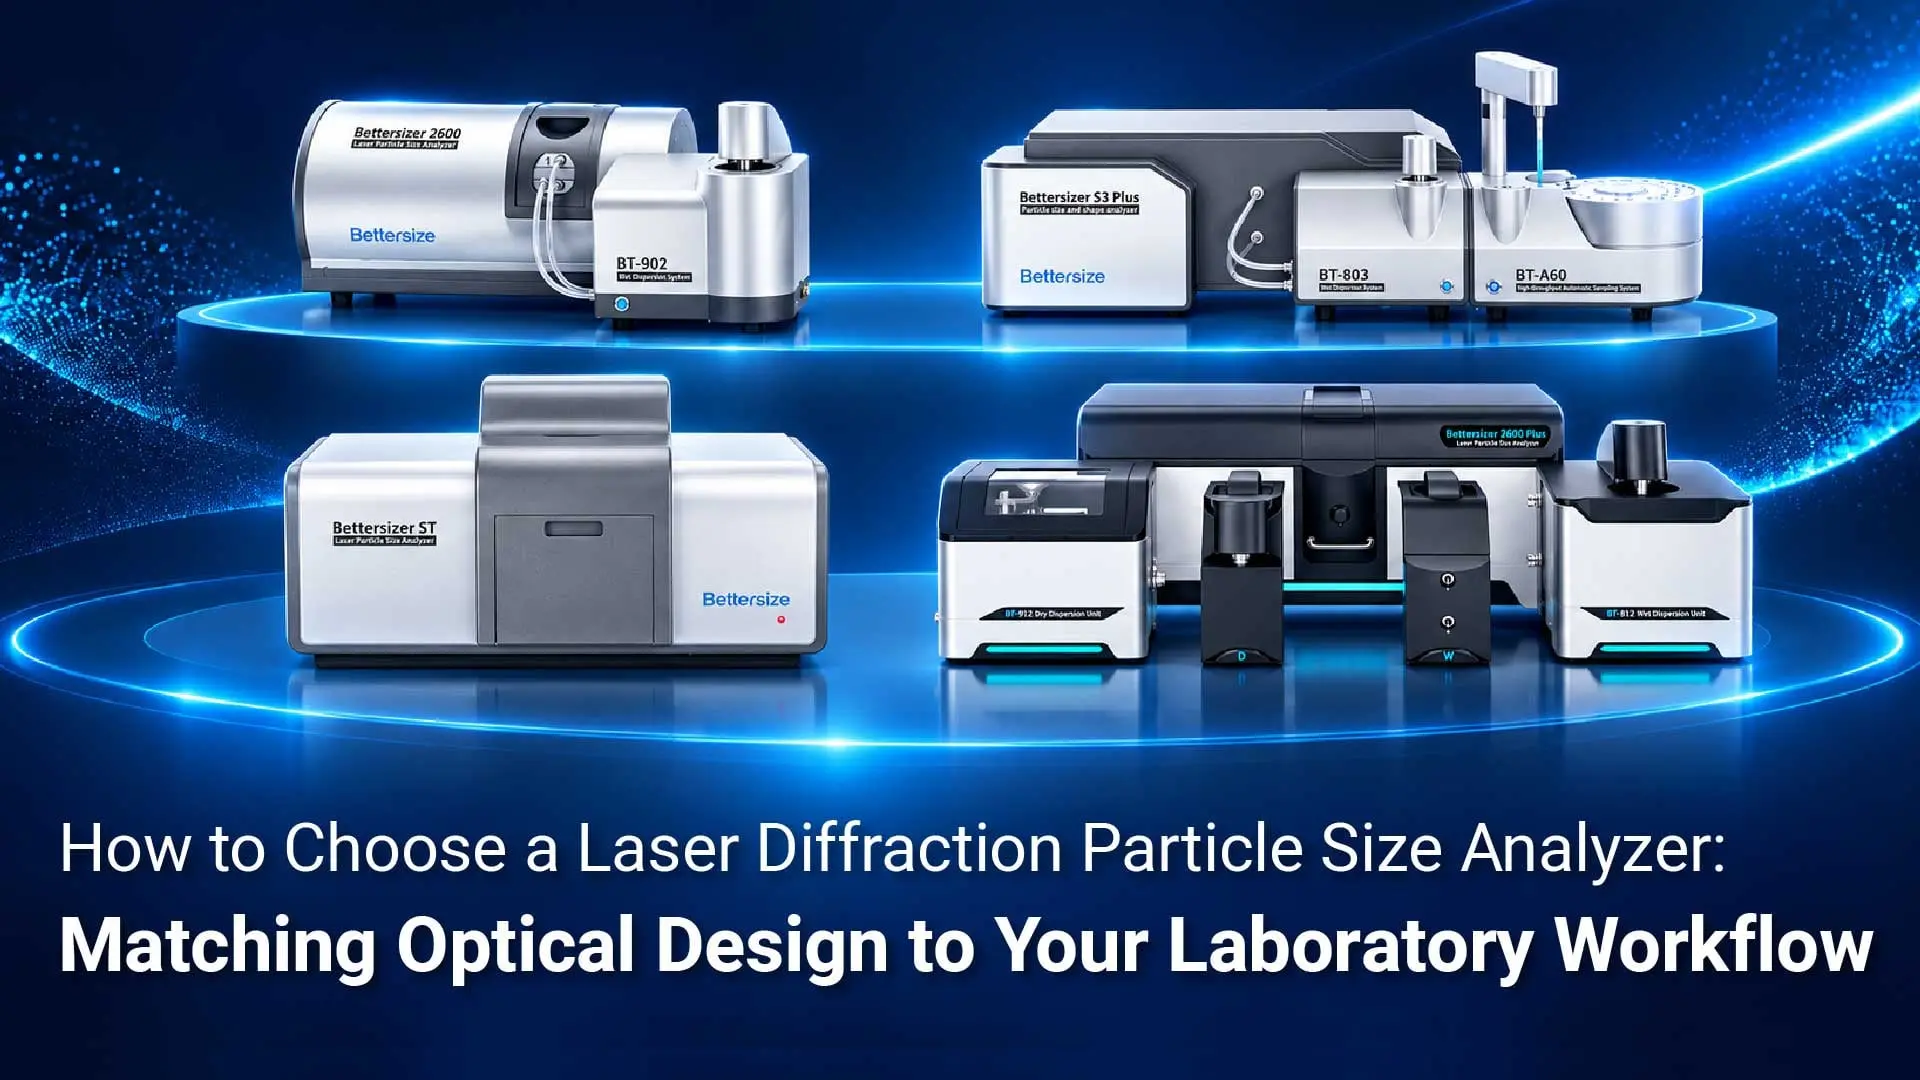
For samples with broad distributions or small populations of coarse particles, a combined system also brings the two techniques’ data together into directly interpretable particle size results. The Bettersizer S3 Plus and Bettersizer 2600 Plus with PIC-1 support standalone LD, standalone DIA, and combined LD+DIA analysis, allowing the result mode to be selected for the task.
- Standalone LD: Examine the scattering-based particle size distribution to continue batch comparisons and milling-trend monitoring under an established LD method.
- Standalone DIA: Review particle images, length, width, circularity, and aspect ratio to investigate morphology and particles of interest.
- Combined LD+DIA: Integrate scattering and imaging data according to the software’s combined-analysis settings to obtain one overall particle size distribution. Read D10, D50, D90, and other metrics from the same curve, then use images to review coarse particles.
The quartz experiment illustrates the role of combined results. With 0.5 wt.% added coarse powder, the combined volume distribution had a D50 of 42.1 μm and a D100 of 539.0 μm, allowing the main population and coarse end to be interpreted using one set of results. The graphite study demonstrates the complementary roles of standalone LD size data and standalone DIA circularity in material assessment.
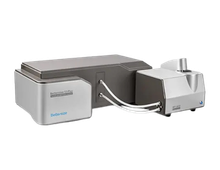
Bettersizer S3 Plus: Integrated High-Speed Dual Cameras
The Bettersizer S3 Plus integrates laser diffraction and high-speed dual-camera DIA in one system. Imaging channels with different magnifications cover different size intervals, providing size and morphology information in the same wet measurement. Its imaging range is 2–3,500 μm, supporting image-based investigation of needle-shaped particles, agglomerate outlines, and coarse particles within the applicable size range.
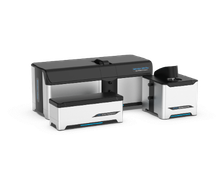
Bettersizer 2600 Plus: Optional PIC-1 Imaging Module
The Bettersizer 2600 Plus can be equipped with the PIC-1 dual-camera imaging module to combine LD and DIA in a wet workflow. PIC-1 covers an imaging range of 2–3,500 μm and supports standalone imaging and combined measurement modes. It offers a modular option for laboratories looking to add images and shape information to particle size analysis.
How Do You Decide Whether Your Sample Needs Combined Analysis?
Start with three steps. First, establish whether you need to compare overall distributions or investigate morphology, agglomeration, or coarse particles. Next, define the size interval, particle size definition, and statistical basis of interest. Finally, use representative samples to confirm the combination of analyzer, imaging module, and dispersion unit, and establish measurement settings suited to the material.
For a small population of particles larger than 10 μm, use representative sampling that retains coarse particles, set an appropriate concentration and acquisition time, and check image clarity, the effective amount of sample observed, and particle capture across repeat measurements. A workflow established this way can better address the sample’s specific coarse-particle question.
If routine decisions depend on particle size distributions measured with a consistent method, LD alone remains a practical choice. When the decision also depends on particle length, aggregation state, or a small coarse-particle population, DIA adds information that can be interpreted and reviewed alongside the distribution.
Would you like to assess whether combined analysis suits your needle-shaped crystals, suspension concentrate, or powder? Submit material details and your measurement questions through Bettersize’s sample testing service, including the target size, dispersion medium, and shape or coarse-particle features you want to investigate. Our team can discuss suitable measurement configurations and an evaluation approach.
Frequently Asked Questions
Can Laser Diffraction Measure Particle Shape Directly?
Image analysis provides shape information directly. LD reports a particle size distribution based on a spherical optical model, while DIA records particle projections and calculates length, width, circularity, and aspect ratio. A combined configuration brings overall particle size and these shape characteristics into the same measurement workflow.
Why Do LD and Image Analysis Give Different Sizes for the Same Sample?
The techniques use different measurement principles and size definitions. LD calculates equivalent sphere diameters from scattering signals, while DIA derives area-equivalent diameters, lengths, or Feret diameters from particle projections. On the S3 Plus or 2600 Plus with PIC-1, standalone results can be viewed to track size or shape changes, or combined analysis can be selected to read size metrics for the main population and coarse end from one overall distribution.
If D90 Is Below 10 μm, Does That Mean There Are No Particles Above 10 μm?
D90 marks the diameter at 90% of the cumulative distribution, so the coarse end still needs separate examination. To assess particles above 10 μm, review the relevant coarse fraction, images from the target size interval, and the selected size definition together.
Do LD and DIA Require Separate Sample Preparation When Used Together?
Wet configurations that support combined analysis can share one sample-loading and dispersion procedure. Scattering and image data are acquired simultaneously in the same circulation loop, reducing repeated preparation and sample transfers associated with separate tests. Acquisition time can be set according to sample concentration and the required particle statistics. The optional BT-A60 autosampler can also support batch testing.
How Can Images Help Investigate Bubbles, Agglomerates, or Large Particles Behind an Abnormal Coarse Peak?
Filter images by the target size, then use particle outlines and changes before and after treatment to narrow the investigation. For suspected bubbles, compare signals and images before and after degassing. For suspected agglomerates, compare morphology before and after suitable dispersion treatment. If individual coarse particles persist, investigate the milling or sieving process further. In the alumina study, images and an aspect-ratio scatter plot for particles in the 6–20 μm interval supported agglomerate investigation.
How Can I Assess the Capture of Trace Populations of Particles Larger Than 10 μm?
Set sampling, concentration, acquisition time, and particle statistics around the particles of interest. Use representative samples to check that the target particles enter the imaging zone, confirm image clarity, and compare particle capture across repeated measurements. Including these conditions in the method enables a more targeted assessment of rare coarse particles.
If I Only Need LD Now, Can I Add Shape Analysis Later?
The Bettersizer 2600 Plus supports phased expansion. You can start with the LD and dispersion system needed today, then add a compatible PIC-1 wet dynamic imaging module for particle images and size and shape parameters. During planning, confirm compatibility with the applications team for the existing analyzer, dispersion unit, and software version.
|
FURTHER READING / LASER DIFFRACTION Want to explore LD more? Our new "Laser Diffraction Guidebook" is your essential resource to master this powerful analytical method! Read the Guidebook →Laser Diffraction · Bettersizer Series |
 |

Rate this article
Share On


Recent News