Home > Industries > Battery and Energy
Battery-and-Energy

Battery and Energy

Key Takeaways

Bettersize delivers an end-to-end physical and powder characterization portfolio engineered to accelerate battery R&D innovation, scale electrode manufacturing, and ensure commercial cell safety. By translating micro-physical parameters—such as particle size distribution (PSD), circularity, surface charge (zeta potential), skeletal true density, and bulk powder rheology—into actionable engineering metrics, these instruments optimize electrochemical kinetics, improve electrode packing density, and eliminate manufacturing downtime.

  • Early-Stage R&D & Precursor Formulation: High-sensitivity Dynamic Light Scattering (DLS) compliant with ISO 22412 and Electrophoretic Light Scattering (ELS) per ISO 13099 size sub-5 nm platinum catalysts (Pt/C) and optimize nano-carbon dispersions. Non-destructive Static Multiple Light Scattering (SMLS) aligned with ASTM E3520-26 and ISO/TR 13097 provides dilution-free stability profiling for concentrated slurries and catalyst inks.
  • Active Material Scale-Up & Processing: Patented dual-camera Dynamic Image Analysis (DIA) per ISO 13322-2 paired with wide-range Laser Diffraction (LD) per ISO 13320 verifies spherical graphite circularity and aspect ratio (ISO 9276-6) while guaranteeing zero-defect D100 oversize control, preventing separator punctures and slurry flow inconsistencies. Modular dry-dispersion configurations protect moisture-sensitive sulfide and halide solid-state electrolyte powders.
  • Commercial Manufacturing & Safety Verification: Automated gas displacement pycnometers (ISO 12154 / ASTM D5550), tapped density testers (ISO 3953), and automated powder characterization testers (ASTM D6393) evaluate skeletal density, compressibility, and hopper flowability to eliminate bridging during continuous dry mixing. Automated static image analyzers (ISO 13322-1) track particle pulverization during cycling and profile aerosolized dust during thermal runaway.
1. Core Challenges Across the Energy Storage Value Chain

The manufacturing pipeline for energy storage devices—encompassing lithium-ion cells, sodium-ion chemistries, solid-state batteries, supercapacitors, and proton exchange membrane fuel cells (PEMFC)—involves intricate sequences of mechanical and chemical transformations: synthesis, milling, grading, slurry dispersion, roll-to-roll coating, calendering, and formation. Throughout this pipeline, specific micro-physical properties govern device efficacy and operational yield:

1. Particle Size Distribution (PSD) & Reaction Kinetics

Electrode reactions and catalytic conversions are interfacial phenomena. In both battery active materials and fuel cell catalysts, particle size directly governs specific surface area and solid-state ion diffusion pathways.

  • Fine-Fraction Imbalances: Sub-micron fractions maximize interfacial reaction area but increase parasitic side reactions with liquid electrolytes, leading to accelerated solid electrolyte interphase (SEI) growth, rapid capacity fade, and elevated binder consumption.
  • Coarse Fractions & Oversized Particles (D100): Abnormally large particles or agglomerates increase internal resistance, impede lithium-ion intercalation kinetics, and introduce physical defects during thin-film coating that can puncture separators and induce catastrophic internal short-circuits.

2. Particle Morphology & Slurry Rheology

Particle circularity, elongation, and aspect ratio dictate bulk packing efficiency and slurry flow dynamics. In high-solids electrode slurries, irregularly shaped or needle-like particles exhibit higher effective hydrodynamic volume and excessive viscosity under shear. This leads to uneven blade/slot-die coating, localized current density spikes, and micro-cracking during calendering. Conversely, highly spherical materials— such as optimized spherical graphite—enable dense particle packing, lower viscosity at high solids loading, and uniform pore networks for electrolyte infiltration.

3. Colloidal Dispersion & Surface Charge Stability

Battery slurries and fuel cell catalyst inks are complex multi-component colloidal dispersions comprising active material particles, nanoscale conductive carbons (e.g., carbon black, carbon nanotubes, graphene), and polymeric binders in aqueous or non-aqueous solvents (e.g., NMP).

  • When electrostatic repulsion is insufficient (low absolute zeta potential), Van der Walls attractive forces trigger rapid particle agglomeration and phase separation.
  • Non-uniform catalyst or conductive additive distribution creates discontinuous electron-transport networks, elevating cell impedance and degrading rate capability.

4. Skeletal True Density, Tap Density & Bulk Mechanics

Volumetric energy density (Wh/L) is fundamentally constrained by material packing behavior.

  • High skeletal true density ensures maximum active mass per unit volume without compromising interstitial transport channels.
  • In production environments, bulk powder properties—evaluated via tapped density, angle of repose, and compressibility indices per international standards—determine hopper discharge reliability, feeding consistency during continuous dry mixing, and electrode coating uniformity.

2. Critical Analytical Parameters in Battery & Energy Materials

Material Domain
Critical Analytical Parameter
Primary Physical Impact
Downstream Performance & Process Risk
Cathode Active Materials (CAM)
(NMC, LFP, LCO, Solid-State)
Particle Size Distribution (D10, D50, D90, D100)
Skeletal True Density
• Intercalation rate kinetics
• Calendered volumetric packing
• Capacity retention & high-rate discharge
• Coating scratch defects & separator puncture
Anode Materials
(Synthetic/Natural Graphite, Si-C)
Sphericity / Circularity
Tap Density & Compressibility
• Slurry rheology & solids loading
• Electrode tortuosity & porosity
• Localized charge density hotspots
• Anode delamination during volume expansion
Conductive Slurries & Catalyst Inks
(PEMFC Pt/C, Graphene, CNTs)
Zeta Potential
Quantitative Instability Index (IUS)
• Electrostatic repulsion stability
• Nanoparticle agglomeration rate
• Electronic percolation network failure
• Uneven catalyst layer & mass transport resistance
Fuel Cell Catalysts
(Pt Nanoparticles & Carbon Aggregates)
Hydrodynamic Diameter (Ultra-fine Pt nanoparticles)
Aggregate Morphology (Sub-micron to micron scale)
• Active platinum surface area
• Gas diffusion & reactive transport
• Excessive noble metal consumption
• Triple-phase boundary (TPB) polarization loss
Degradation & Safety Products
(Aged Electrodes, Thermal Runaway Dust)
Thermal Runaway Particulate PSD
Secondary Particle Micro-cracking
• Active material pulverization
• Aerosolized particulate mass & size
• Catastrophic cell venting & deflagration severity
• Capacity loss from active mass loss

3. Pipeline Solutions: Technique & Instrument Mapping

Stage 1: Precursor Synthesis & Catalyst Development (R&D Phase)

In the early synthesis of battery precursors, conductive nano-additives, and fuel cell electrocatalysts, precise control over primary crystal growth, nanoscale dispersion, and surface charge is essential to maximize catalytic activity and electrochemical reaction kinetics.

BeNano 180 Zeta Max (Nanoparticle Size and Zeta Potential Analyzer)

Technology & Capabilities: Integrates Dynamic Light Scattering (DLS) per ISO 22412, Electrophoretic Light Scattering (ELS) per ISO 13099-2, and Static Light Scattering (SLS). Accommodates particle sizes from 0.3 nm to 15 μm across high-concentration and conductive suspensions.
Battery & Energy Value:
  • Fuel Cell Electrocatalysts: Precisely measures the hydrodynamic size of ultra-fine platinum particles on carbon-supported platinum (Pt/C) catalysts without gravitational settling interference, ensuring maximum active surface area and noble-metal utilization.
  • Conductive Additives: Determines carbon aggregate dimensions (usually sub-micron to micron-scale) and tracks surface charge (zeta potential) to prevent self-agglomeration in liquid matrices, optimizing the electronic percolation network.

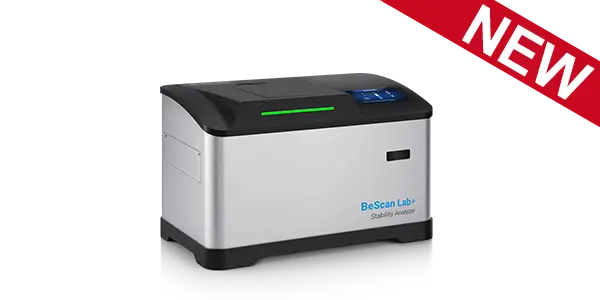
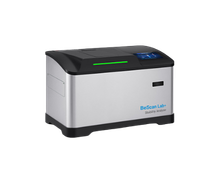
BeScan Lab+ (Dispersion Stability Analyzer)

Technology & Capabilities: Utilizes Static Multiple Light Scattering (SMLS) aligned with ASTM E3520 and ISO/TR 13097, scanning concentrated dispersions (volume fractions up to 95%) without sample dilution.
Battery & Energy Value:
  • Quantifies destabilization kinetics (migration, flocculation, phase separation) of early-stage catalyst inks and precursor slurries.
  • Generates a direct Quantitative Instability Index (IUS) across varying sample heights and time intervals, dramatically shortening formulation development and eliminating prolonged shelf-standing trials.

Stage 2: Cathode & Anode Active Material Processing (Milling, Spheroidization & Scale-Up)

During active material synthesis, milling, and classification, particle size distribution and particle morphology directly dictate volumetric packing, slurry rheology, and downstream manufacturing safety.

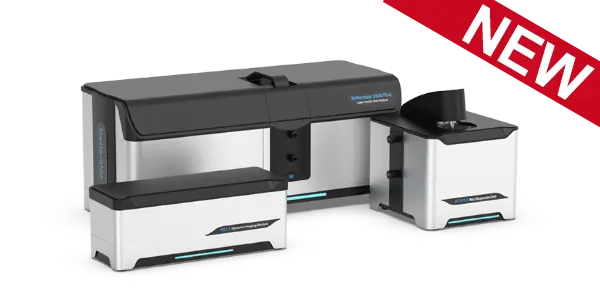
Bettersizer 2600 Plus (Particle Size and Shape Analyzer)

Technology & Capabilities: Combines Laser Diffraction (LD) per ISO 13320 and Dynamic Image Analysis (DIA) per ISO 13322-2 covering a wide measurement range of 0.02 to 3,500 μm with high repeatability. Equipped with automated wet recirculation and high-energy dry Venturi dispersion modules.
Battery & Energy Value:
  • Delivers high-throughput particle size distribution (PSD) metrics (D10, D50, D90, etc.) for cathode active materials (CAM like NMC and LFP) and anode graphite.
  • Its modular dry dispersion configuration enables reliable testing of moisture-sensitive materials—such as sulfide-based solid-state electrolyte powders—under protective dry environments.

Bettersizer S3 Plus (Combined Laser Diffraction & Dynamic Imaging Analyzer)

Technology & Capabilities: Features a patented optical layout integrating laser diffraction with dual-camera dynamic image analysis (0.5X and 10X optical magnification).
Battery & Energy Value:
  • Critical Oversize (D100) Detection: Concurrently captures real-time images of individual coarse particles, ensuring strict adherence to standards like YS/T 825 (e.g., lithium titanate anode D100≤5.0μm) and eliminating the risk of cell separator puncture.
  • Sphericity & Morphology Verification: Quantifies particle circularity and aspect ratio for spherical graphite (e.g., verifying circularity >0.9), preventing high slurry shear viscosity and uneven electrode calendered densities.

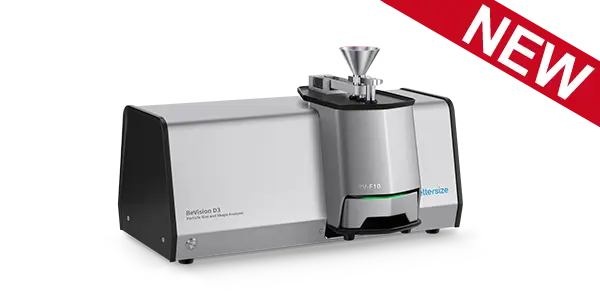
BeVision D3 Series (Dynamic Image Analyzer)

Technology & Compliance: High-speed Dual-CMOS Dynamic Image Analysis conforming to ISO 13322-2 and ISO 9276-6, analyzing over 37 individual particle size and morphological parameters across an expansive range (0.5 μm to 26 mm). Features modular sample dispersion configurations: gravity free-fall for free-flowing coarse powders, and wet dispersion for liquid suspensions.
Battery & Energy Value:
  • Spheroidization & Morphology Optimization: Directly measures circularity, aspect ratio, and convexity distributions of synthetic and natural graphite anodes, ensuring low shear viscosity in slurries and uniform packing during electrode calendering.
  • Digital Sieve Replacement for Coarse Screening: Built-in digital sieve correlation functions replace traditional mechanical wire sieves for cathode precursors, crushed active materials, and black mass, eliminating mesh blinding, screen wear, and operator-dependent error.

Stage 3: Electrode Slurries, Powder Bulk Handling & Safety Profiling (QA/QC & Commercial Production)

Commercial battery manufacturing demands reliable bulk powder feeding, stable electrode coating without phase separation, and comprehensive degradation analysis under cycling and thermal stress.

BetterPyc 380 (Automated Gas Pycnometer)

Technology & Capabilities: Automated gas displacement pycnometer conforming to ISO 12154 and ASTM D5550 with 0.02% accuracy and 0.01% repeatability across interchangeable chamber volumes.
Battery & Energy Value:
  • Determines skeletal true density for cathode/anode raw materials, solid electrolytes, and graphene foams.
  • Enables process engineers to adjust precursor calcination and formulation parameters, maximizing cell volumetric energy density (Wh/L) and reducing capacity fade under high-rate cycling.

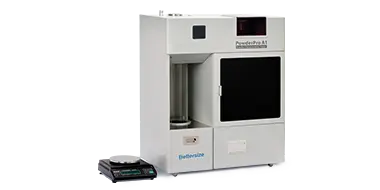
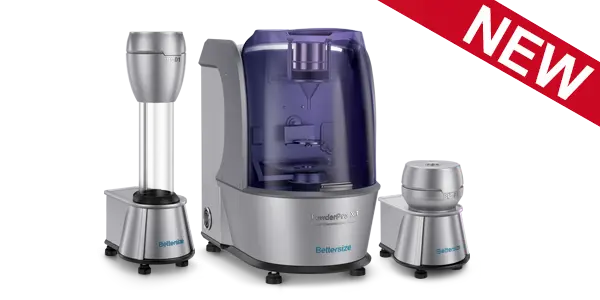
PowderPro X1 (Automated Powder Characterization & Tapped Density)

Technology & Capabilities: Automated powder comprehensive property testers measuring angle of repose, compressibility, Carr index, tapped/bulk densities, etc. per global pharmacopeia and industrial standards such as USP 1174, USP 616, ASTM D6393, and ISO 3953.
Battery & Energy Value:
  • Hopper Feed Optimization: Quantitatively evaluates powder flowability and compressibility, eliminating bridging and ratholing during active material discharge into continuous mixers.
  • Tap Density Verification: Tracks tapped density variations across precursor states (e.g., hydroxide/carbonate precursors through finished CAM), directly correlating powder packing performance with low capacity fade across charge-discharge cycles.

BeVision M1 (Image Analysis for Aging & Safety Inspection)

Technology & Capabilities: Automated static image analysis system conforming to ISO 13322-1 with high-resolution optical microscopy and motorized automated scanning stages.
Battery & Energy Value:
  • Electrode Aging & Degradation: Tracks particle pulverization, micro-cracking, and morphology shifts following extended cycling.
  • Thermal Runaway Dust Profiling: Analyzes particle size distributions and morphology of toxic, aerosolized powders ejected during cell thermal runaway under varying States of Charge (SOC), providing critical empirical data for battery pack safety design and deflagration mitigation.

4. Application Navigation / Segment Explorers

Cathode Active Materials (CAM) & Precursors

Optimize precursor synthesis and finished cathode powders to balance energy density and cycling stability.

  • Key Challenges: Tight particle size distribution (PSD) control, D100 oversize restriction per standards like YS/T 825, and maximizing skeletal true density.
  • Core Techniques: Laser Diffraction (LD), Dynamic Image Analysis (DIA), Gas Pycnometry.
  • Recommended Instruments: Bettersizer 2600 Plus, Bettersizer S3 Plus, BetterPyc 380.

Anode Materials (Synthetic / Natural Graphite & Si-C)

Control particle sphericity and compaction dynamics to enhance rate capability and reduce slurry shear viscosity.

  • Key Challenges: Verifying circularity and aspect ratio per ISO 9276-6 to guarantee low slurry viscosity, optimizing bulk packing and tapped density, and preventing delamination during calendering.
  • Core Techniques: Dynamic Image Analysis (DIA), Powder Flowability & Tapped Density Testing, On-line or In-line Laser Diffraction.
  • Recommended Instruments: Bettersizer S3 Plus, BeVision D3 series, PowderPro X1, BeDensi T Pro series, BT-Online.

Conductive Additives & Slurry Dispersions

Prevent nanoparticle agglomeration and secure homogeneous electron-transport networks.

  • Key Challenges: Measuring carbon aggregate dimensions, monitoring surface charge (zeta potential), and quantifying high-concentration slurry stability without dilution.
  • Core Techniques: Dynamic Light Scattering (DLS), Electrophoretic Light Scattering (ELS), Static Multiple Light Scattering (SMLS).
  • Recommended Instruments: BeNano 180 Zeta Max, BeScan Lab+.

Fuel Cell Electrocatalysts (PEMFC & SOFC)

Maximize noble-metal surface utilization and ensure stable catalytic ink deposition.

  • Key Challenges: Sizing ultra-fine platinum particles on carbon supports (Pt/C), characterizing aggregate structures, and preventing ink phase separation.
  • Core Techniques: Dynamic Light Scattering (DLS), Zeta Potential Analysis, Static Multiple Light Scattering (SMLS).
  • Recommended Instruments: BeNano 180 Zeta Max, BeScan Lab+.

Next-Gen Batteries & Solid-State Electrolytes

Characterize air- and moisture-sensitive powders under controlled environmental conditions.

  • Key Challenges: Particle sizing of sulfide/oxide solid electrolytes without solvent breakdown, true density profiling of porous scaffolds, and thermal runaway dust analysis.
  • Core Techniques: Dry Laser Diffraction (Glovebox Integration), Automated Gas Displacement, Static Scanning Image Analysis.
  • Recommended Instruments: Bettersizer 2600 Plus (Dry Module), BetterPyc 380, BeVision M1.

5. Technical Specifications & Compliance Matrix

Analytical Parameter
Measurement Technique
Governing International & National Standards
Measurable Range / Key Metric
Recommended Instrument Models
Particle Size Distribution (PSD)
Laser Diffraction (LD)
• ISO 13320:2020
• USP 429 (Laser Diffraction Measurement of Particle Size)
• 0.02-3,500 μm (Bettersizer 2600 Plus)
• 0.01 to 3,500 μm (Bettersizer S3 Plus)
• Repeatability: ≤ 0.5%
BT-Online Series
Particle Morphology & Sphericity
Dynamic Image Analysis (DIA) / Static Image Analysis (SIA)
• ISO 13322-1:2014 (Static)
• ISO 13322-2:2021 (Dynamic)
• ISO 9276-6:2008 (Shape Descriptors)
• Circularity, Aspect Ratio, Sphericity, Convexity
• Dynamic size: 0.5 μm to 26 mm
• Direct D100 defect imaging
Nanoparticle Sizing & Surface Charge
Dynamic Light Scattering (DLS) & Electrophoretic Light Scattering (ELS)
• ISO 22412:2025 (DLS Sizing)
• ISO 13099-2:2025 (Zeta Potential)
• Particle Size: 0.3 nm to 15 μm
• Zeta Potential in mV for conductive & concentrated suspensions
Colloidal & Slurry Stability
Static Multiple Light Scattering (SMLS)
• ASTM E3520-26 (Concentrated Dispersion Stability)
• ISO/TR 13097:2013 (Dispersion Stability)
• Volume fractions up to 95%
• Quantitative Instability Index (IUS)
• Non-destructive, zero-dilution testing
Skeletal / True Density
Gas Displacement Pycnometry (Helium / Nitrogen)
• ASTM D5550 (Gas Pycnometry)
• ISO 12154:2014 (True Density by Gas Pycnometry)
• Volume, Skeletal True Density
• Accuracy: ≤ 0.02%
• Repeatability: ≤ 0.01%
Bulk Powder Flowability & Tapped Density
Mechanical Tapping & Geometric Angle of Repose
• USP 1174 (Powder Flow)
• USP 616 (Bulk & Tapped Density)
• ASTM D6393 (Carr Indices)
• ISO 3953:2011 (Metallic Powders Tapped Density)
• Angle of Repose, Carr Compressibility Index, Hausner Ratio
• Tap Density Repeatability: ≤ 1.0%

6. Application Notes & Technical Resources

Technical/Application Notes

Techniques: Laser Diffraction (LD)
Summary: Particle size distribution (PSD) is a critical quality attribute for moisture-sensitive solid electrolytes used in all-solid-state batteries, directly affecting sintering behavior, ionic conductivity, and interfacial contact. This study demonstrates inert-atmosphere laser diffraction for safe and accurate PSD characterization of sulfide and halide solid electrolytes, enabling reliable grade differentiation and robust quality control under oxygen- and moisture-free conditions.
Techniques: Static Multiple Light Scattering (SMLS)
Summary: The stability of electrode slurry is affected by factors such as the composition and percentage of ingredients, the particle size and size distribution of the active material particles, the viscosity of the medium, and the mixing processes. An optimal formula can ensure the mechanical and conductive properties of the electrode slurry. In this measurement, two slurries were analyzed with the BeScan Lab for both qualitative and quantitative analysis. Additionally, the BeScan Lab can also be used to characterize the surface of the electrode sheets.
Techniques: Laser Diffraction (LD), Powder Characterization
Summary: The particle size and tapped density of anode materials play a pivotal role in the performance of Lithium-ion batteries. This study employs the Bettersizer 2600 laser diffraction particle size analyzer and BeDensi T3 Pro tapped density tester to investigate the effects of varying blending ratios of two samples on their D50 and tapped density. The results may provide valuable guidance for developing advanced electrode material formulations, thereby fostering advancements in battery technology.

More Learning Resources

This webinar will address the importance of particle size and shape analysis of battery materials and how the combination of laser diffraction and image analysis can better help enhance the lifespan of batteries.
This webinar delves into the critical relationship between the physical properties of raw materials and the final microstructure of solid-state electrodes. We will explore how fundamental parameters—particle size distribution (PSD) and powder packing density—of both cathode active materials and solid electrolytes directly impact ionic conductivity, dendrite suppression, and the ultimate volumetric energy density of the cell.

Citations

  • Bettersizer 2600

    Functional redundancy as an indicator for evaluating functional diversity of macrobenthos under the mussel raft farm near Gouqi Island

    DOI: 10.1016/j.aquaculture.2023.740024 Read Article Go logo
    Zhejiang Ocean University | 2024
    Biological traits analysis (BTA) helps to evaluate the effects of different environmental variables on the traits-based functional composition of macrobenthos. However, research on functional traits of macrobenthos under mussel farming is limited. We investigated the spatial and temporal response of the benthic system in terms of taxonomic and functional diversity to environmental variables of farming and natural stressors resulting from suspended mussel farming near Gouqi Island of eastern China Sea. The functional traits of macrobenthic assemblages under mussel farming were characterized by “medium adult body size”, “vermiform body form”, “high flexibility”, “infauna”, “semi-motile”, “gonochoristic”, “surface deposit-feeders”, “carnivores”, “semi-motile burrowers”, and “tube-dwellers”. Functional redundancy was stable in response to mussel farming stresses among seasons, whereas species diversity showed efficient to evaluate natural variables. Functional diversity was significantly affected by farming stressors rather than natural variables, Further analysis using multivariate methods together with continuous monitoring were highlighted to evaluate the impacts of mussel farming. Our results reinforce the importance of macrobenthic species and functional traits analysis to evaluate human stresses driven impacts in offshore ecosystems. By analysing the environmental variables with different sources, independently, we concluded the main effects of human pressures on macrobenthic community. Such distinction could be particularly effective to isolate variable environmental descriptors and evaluate their effects on functional diversity, making the current approach promising for the evaluation of ecological effects of anthropogenic stressors in aquaculture areas.
  • Bettersizer 2600

    Degradation characteristics and utilization strategies of a covalent bonded resin-based solid amine during capturing CO2 from flue gas

    DOI: 10.1016/j.seppur.2023.125621 Read Article Go logo
    China University of Petroleum | 2024

    In this study, various types of degradation as well as attrition which are possibly encountered in a circulating fluidized bed temperature swing adsorption (CFB-TSA) process, were conducted experimentally to evaluate the stability of a resin-based solid amine sorbent. Other characterizations methods, such as elemental analysis (EA), Fourier transform infrared spectroscopy (FTIR) etc. were applied to further reveal the degradation mechanisms. The results showed that thermal degradation occurs from 140–160 °C due to the decomposition of amine group. The CO2-induced degradation occurs from a higher temperature of 160–180 °C accompanied by the production of urea. Hydrothermal stability is good below 130 °C, but the ionic impurities in steam crystalized on particle surface can accelerate the degradation. Oxidative degradation is the most harmful, which starts at a lower temperature of 70–80 °C with the formation of aldehyde. The existence of H2O in atmosphere can alleviate the oxidative and CO2-induced degradations. The employed sorbent has a very low attrition index of 0.05, which is 1–2 orders lower than typical commercial fluidized bed catalysts. Based on the results of stability evaluation, some design suggestions for proper utilization of this sorbent or other similar resin-based sorbents have been provided in an industrial CFB-TSA process.

  • Bettersizer 2600

    De-branching of starch molecules enhanced the complexation with chitosan and its potential utilization for delivering hydrophobic compounds

    DOI: 10.1016/j.foodhyd.2023.109498 Read Article Go logo
    Shihezi University | 2024
    The current study aimed to prepare the complexes between debranched-waxy corn starch and chitosan polymers (DBS-CS), and then investigated their corresponding structural characteristics, rheological property and potent application in Pickering emulsion. The results indicated that the existence of chitosan significantly inhibited starch short-range molecular rearrangement for all DBS-CS samples, which was manipulated by both debranching treatment and chitosan content. Interestingly, this is the first study to reveal that the outstanding peak at 1.8 ppm in 1H NMR spectrum for sample DBS-CS was gradually shifted towards a lower-field region following an increased chitosan content. Moreover, the debranching treatment shifted the crystallinity pattern from A-type to B-type and the relative crystallinity of DBS-CS decreased gradually with the increased content of CS. All samples had a pseudoplastic fluid and shear-thinning behavior with an enhanced shear resistance following the complexation. The DBS-CS was applied in a Pickering emulsion for showing a greater emulsifying stability and a lower gel strength than native NS-CS prepared emulsion. Importantly, the encapsulation ability of curcumin in the DBS-CS emulsion was significantly improved, followed by an increase of 15.45% for its corresponding bioavailability compared to the control. Therefore, this study might highlight a potential carrier for delivering the bioactive substances in a green pattern.
  • Bettersizer 2600

    Heat-induced aggregation behavior of wheat gluten after adding citrus pectin with different esterification degree

    DOI: 10.1016/j.foodhyd.2023.109420 Read Article Go logo
    Gansu Agricultural University | 2024
    Wheat gluten aggregation during heat treatment is beneficial to the final quality of gluten-based products. Exogenous pectin can affect gluten aggregation. However, the effect of pectin with different degrees of esterification on the heat-induced aggregation behavior of gluten and its possible mechanism are still unclear. Thus, the heat-induced aggregation behavior of gluten after adding pectin with different esterification degree was studied in this study. When the temperature was raised from 25 °C to 95 °C, pectin affected gluten aggregation and was related to the degree of esterification. Specifically, the results of rheological properties and particle size indicated that low-ester pectin improved the viscoelasticity of gluten and promoted gluten aggregation. Thermal properties revealed that enthalpy of gluten added with low-ester pectin (37%) increased from 92.96 J/g to 95.40 J/g during heating process. Structurally, the fluorescence intensity and surface hydrophobicity of gluten added with low-ester pectin (37%) were lower than those added with high-ester pectin (73%). In addition, low-ester pectin (37%) significantly increased the disulfide bond content (from 15.31 μmol/g to 18.06 μmol/g) and maintained β-sheet content of gluten compared with gluten alone at 95 °C, indicating that low-ester pectin was more likely to induce gluten aggregation. However, scanning electron microscope showed that the gluten added with low-ester pectin (46%) exhibited a denser network structure at 95 °C than that added with low-ester pectin (37%). These results will provide a theoretical base for the regulation of gluten aggregation and the quality of gluten-based products by pectin with different esterification degree.
Page 1 of 84
  • 1
  • 2
  • 3
  • 4
  • 5
  • 6
  • 84
Go to

Curated Resources

  • Application Note
    appnote

    2026-09-24

    Online Particle Size Monitoring of Battery Material Using the BT-Online Series Particle Size Analyzers

    bigClick
  • Application Note
    D3-battery

    2026-09-14

    Particle Size Analysis of Graphite and Detection of Fibrous Impurities Using the BeVision D3 Pro

    bigClick
  • Application Note

    2026-04-29

    Measuring Particle Size and Shape of Needle Coke Using the BeVision D3

    bigClick

More resources

Related Particle Size Analyzer

  • PowderPro A1

    Powder Characteristics Tester

    Operation Mode: Automatic

    Tapping Speed: 50 - 300 taps/min

    Repeatability: ≤3% variation

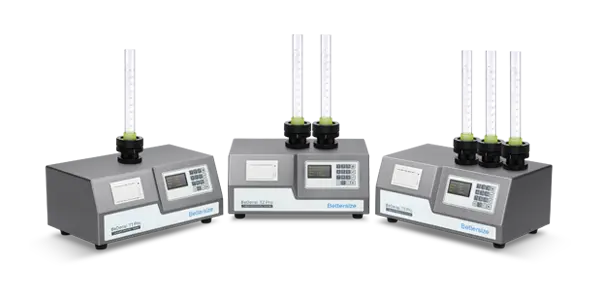
  • BeDensi T Pro Series

    BeDensi T Pro Series

    Tapped Density Tester with a Wallet-Friendly Solution

    Number of Workstations: 1-3

    Tapping Speed: 100 - 300 taps/min

    Repeatability: ≤1% variation

  • BT-Online1 online particle size analyzer for dry powder

    BT-Online1

    Online Particle Size Analyzer

    Dispersion type: Dry

    Measurement range: 0.1 - 1,000μm

    Accuracy: ≤1% (D50 of certified reference material)

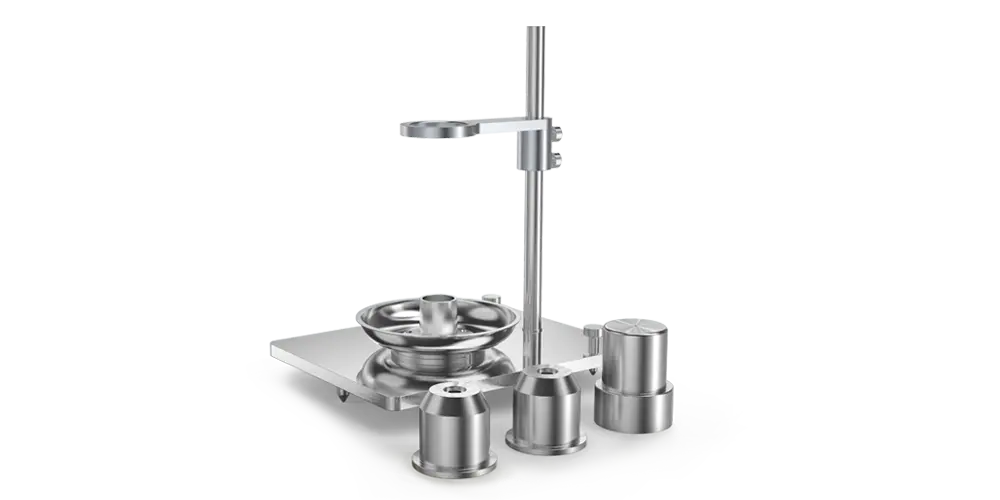
  • HFlow 1 Flowmeter Funnel

    HFlow 1

    Flowmeter Funnel

    Measurement: Bulk density and Flow rate

    Compliance with USP, Ph. Eur., ASTM, and ISO standards

  • Bettersizer 2600

    Bettersizer 2600

    Particle Size Analyzer

    Measurement range: 0.02 - 2,600μm (Wet dispersion)

    Measurement range: 0.1 - 2,600μm (Dry dispersion)

  • BeNano 180 zeta max

    BeNano 180 Zeta Max

    Nanoparticle Size and Zeta Potential Analyzer

    Particle size measurement via sedimentation technology

    Refractive index measurement

    Particle concentration measurement

  • BeSEC

    Light Scattering Detector for SEC/GPC Systems

    Dual detection angles: 7° and 90°

    Molecular weight range: 1 kDa to 2 GDa

    Supports radius of gyration Rg > 12 nm

  • Bettersizer 2600 Plus

    Particle Size and Shape Analyzer

    Measurement range: 0.02 - 2,600μm (Wet dispersion)

    Measurement range: 0.1 - 2,600μm (Dry dispersion)

    Dynamic imaging analysis range: 2 - 3,500 μm

  • BeVision D3 Series

    Image Analyzer

    Dispersion type: Dry

    Measurement range: 0.5 μm - 26 mm

    Technology: Dynamic Image Analysis

  • new-bescan-lab-plus

    BeScan Lab+

    Stability Analyzer

    Particle size ranges from 0.01 to 1000 μm

    Volume fraction up to 95%

    Compliance with ISO/TR 18811, 13097, 21357, 22107, 13317

  • PowderPro X1

    PowderPro X1

    Powder Characteristics Tester

    18-in-1 automated powder characterization platform

    Tapped Frequency: 1 – 300 taps/min

    Settable Number of Tap: Max. 9999