Home > Industries > Pharmaceuticals
Pharmaceuticals

Pharmaceuticals

Key Takeaways

Bettersize provides an end-to-end particle characterization portfolio designed to bridge the gap between pharmaceutical R&D innovation and commercial manufacturing reliability. By integrating high-precision analytical tools with regulatory compliance, these instruments transform micro-physical properties, such as size distribution, zeta potential, and morphology, into actionable process insights.
  • For early-stage development, advanced dynamic light scattering (DLS), electrophoretic light scattering (ELS), and non-destructive stability testing accelerate formulation screening and shorten time-to-market.
  • During process scale-up, the integration of laser diffraction (LD) with dynamic image analysis (DIA) empowers engineers to optimize granulation and milling to avoid downstream defects, while automated static image analysis (SIA) verifies surface cleanliness to support stringent Contamination Control Strategies (CCS).
  • In commercial manufacturing, high-frequency QC particle size analyzers, fully automated powder flowability, tapped density, and true density testers serve as quality gatekeepers, preventing tableting downtime and ensuring batch-to-batch consistency.
Ultimately, this comprehensive solution minimizes trial-and-error, mitigates operational risks, and delivers a lower total cost of ownership across the entire pharmaceutical lifecycle.
1. Core Challenges for the Pharmaceutical Industry

Solid pharmaceutical preparations—including powders, granulates, capsules, tablets, and suspensions—account for approximately 70% to 80% of all pharmaceutical products globally. The manufacturing pipeline for these dosage forms is a complex sequence of physical transformations: smashing, grading, mixing, pelleting, drying, preforming, packaging, and storage. Throughout this pipeline, the micro-physical properties of the active pharmaceutical ingredients (API) and excipient particles dictate both the pharmacological efficacy of the drug and the engineering feasibility of the manufacturing process.
  • Pharmacologically, particle size fundamentally governs drug release kinetics; excessively large particles fail to dissolve properly, leading to poor bioavailability, whereas abnormally small particles can cause rapid release spikes, significantly increasing toxicity and the risk of adverse side effects.
  • Operationally, solid preparations require extensive optimization of their powder properties to meet stringent handling demands. As outlined in USP <1174> on Powder Flow and USP <616> on Powder Density, poor powder flowability, non-compliant angles of repose, or anomalous bulk and tapped densities directly cause obstructed hopper discharge, unacceptable tablet weight variations, and costly process downtime in commercial tableting.
The core challenge for the industry is establishing a seamless, highly repeatable particle characterization framework across the entire pipeline while strictly adhering to regulatory data integrity standards such as FDA 21 CFR Part 11.

2. Pipeline Solutions

Stage 1: Pre-formulation & Drug Discovery

In the early development of APIs and nanocarriers (e.g., liposomes, lipid nanoparticles), identifying the optimal formulation requires precise measurement of colloidal stability and hydrodynamic size. Rapidly pinpointing these parameters allows R&D teams to confidently screen candidates and significantly compress the development timeline.
BeNano 180 Zeta Max (Nanoparticle Size and Zeta Potential Analyzer)

BeNano 180 Zeta Max (Nanoparticle Size and Zeta Potential Analyzer)

Utilizing Dynamic Light Scattering (DLS) in accordance with ISO 22412, Electrophoretic Light Scattering (ELS) per ISO 13099, and Static Light Scattering (SLS), this system is a powerful nanoparticle analyzer and can measure particle sizes from 0.3 nm to 15 µm. It features advanced measurements at three different angles and utilizes Phase Analysis Light Scattering (PALS) for highly sensitive zeta potential analysis.
Pharma Value: It accommodates a broad concentration range of 10^8 to 10^12 particles/mL for suspensions and refractive indices from 1.20 to 1.60 for liquids. Paired with its autotitration module, it automatically executes pH vs. size/zeta potential testing. This enables researchers to rapidly identify the isoelectric point (IEP) and optimal buffer conditions, eliminating immense manual trial-and-error and accelerating the pre-formulation phase.

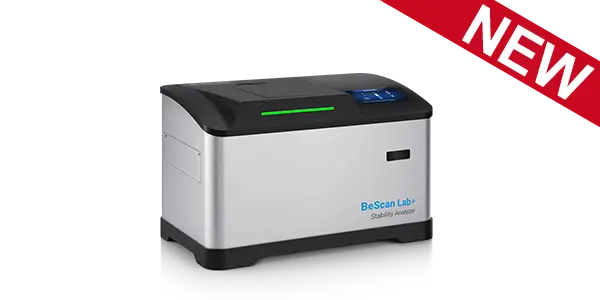
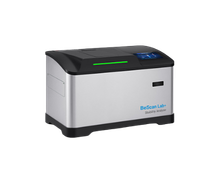
BeScan Lab+ (Stability Analyzer)

This system utilizes Static Multiple Light Scattering (SMLS) aligned with ASTM E3520-26 and ISO/TR 13097 to provide non-destructive stability analysis for dispersions with volume fractions up to 95%.
Pharma Value: By generating a Quantitative Instability Index (IUS) and Homogeneity Index without requiring sample dilution, it accurately predicts long-term stability in a fraction of the traditional time. The scalable high-throughput system can connect up to 10 units, allowing pharmaceutical companies to reduce reliance on prolonged standing tests and drastically shorten their time-to-market.

Stage 2: Process Development & Granulation Scale-up

During milling and granulation, the convergence of particle size and shape directly dictates downstream powder properties. Accurate imaging prevents unpredictable packing dynamics that can derail the scale-up process and induce tableting defects like capping or sticking.
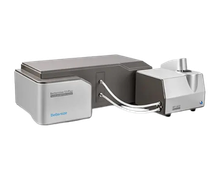
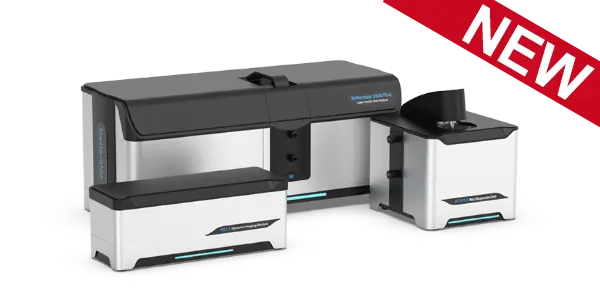
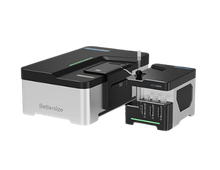
Bettersizer 2600 Plus (Particle Size and Shape Analyzer)

Bettersizer 2600 Plus (Particle Size and Shape Analyzer)

This analyzer integrates laser diffraction with dual-camera dynamic imaging analysis, offering a measurement range of 0.02 to 3,500 µm. Its optical system utilizes 92 detectors covering a 0.016° to 165° detection angle range, delivering exceptional accuracy and repeatability of ≤0.5%. Alongside supporting modular wet and dry dispersion units, the analyzer can be equipped with the optional PIC-1 dynamic imaging module for particle size and shape analysis, providing detailed shape information for particles specifically from 2 to 3,500 µm.
Pharma Value: Equipped with smart software featuring SOP automation and full FDA 21 CFR Part 11 compliance, this system provides the rigorous data integrity required for pharmaceutical environments. The integration of dynamic imaging allows for critical visual verification of particle shape, ensuring that subtle variations in API or excipient shape do not compromise bulk powder mechanics or final dosage form quality.
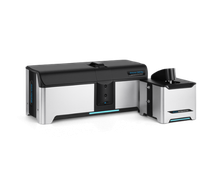
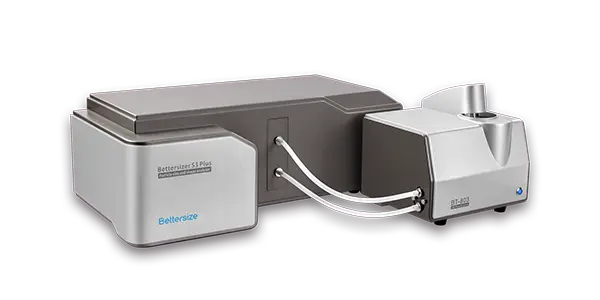
Bettersizer S3 Plus (Particle Size and Shape Analyzer)

Bettersizer S3 Plus (Particle Size and Shape Analyzer)

This system features a patented combination of laser diffraction and dynamic image analysis technology. It offers a broad measurement range of 0.01 to 3,500 µm and is equipped with high-speed CMOS cameras providing 0.5X and 10X magnification. A total of 96 detectors cover an expansively 0.02° to 165° detection angle range. An optional BT-A60 autosampler is available to ease the workload.
Pharma Value: The dual-camera system captures real-time particle images, allowing process engineers to visually detect abnormal needle-like API crystals or excessively large agglomerates during the granulation process. This dual-validation approach safeguards the milling and granulating steps, directly preventing downstream flowability issues and securing high scale-up yields.

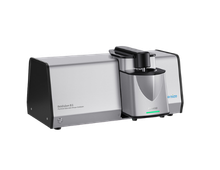
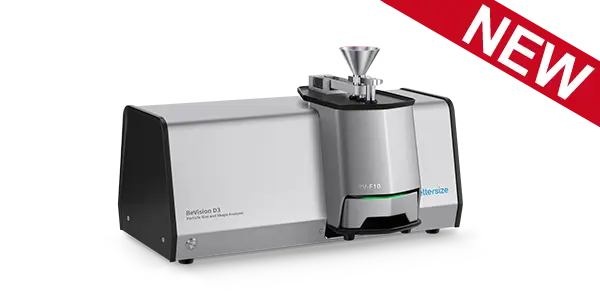
BeVision D3 Pro (Dynamic Image Analyzer)

Designed per ISO 13322-2, this system utilizes a Dual-CMOS camera Dynamic Image Analysis system to measure particles from 0.5 µm to 16 mm, analyzing over 37 particle size and shape parameters.
Pharma Value: Its built-in sieve correlation function serves as a seamless digital replacement for traditional mechanical sieving, completely eliminating screen blinding, wear, and poor data precision. With versatile dry and wet dispersion modules, it provides formulation scientists with deep insights into how particle circularity and aspect ratios influence bulk powder packing and flow behavior.
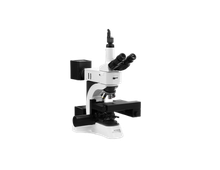
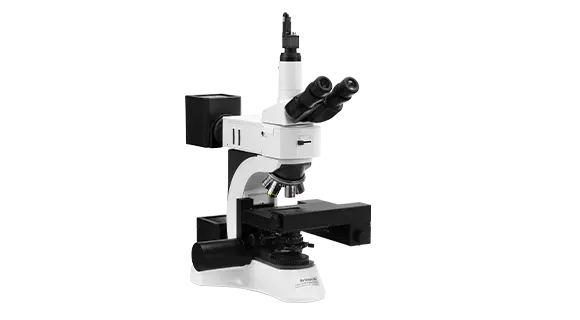
BeVision M1 (Scanning Image Analyzer)

BeVision M1 (Scanning Image Analyzer)

This automated image analyzer is designed for surface quality and cleanliness inspection, covering a broad measurement range of 0.3 to 10,000 µm. It is equipped with a metallurgical microscope, a 12-megapixel CMOS camera, and an automatic scanning stage that features intelligent auto-focus.
Pharma Value: The system's panoramic mode combines macro overviews with microscopic details, allowing QA teams to accurately identify adhered particles, abnormal crystal morphologies, and extraneous contaminants on sample surfaces. Fully compliant with ISO 13322-1 and ISO 9276-6 standards, this analyzer eliminates subjective manual inspection, providing the precise, automated imaging required to enforce stringent Contamination Control Strategies (CCS) and ensure the ultimate purity of pharmaceutical batches.

Stage 3: Commercial Manufacturing & QA/QC

Commercial operations demand high-throughput, uncompromising reliability, and strict batch-to-batch consistency. Bulk powder mechanics must be rigorously monitored to prevent hopper blockages (bridging/ratholing) and ensure content uniformity during high-speed tableting.
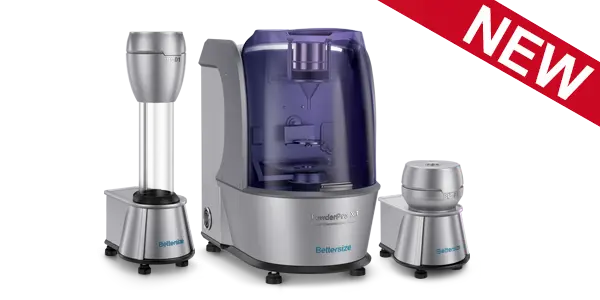
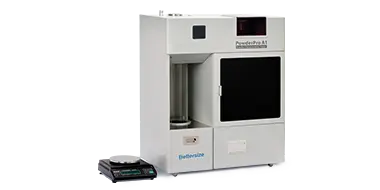
PowderPro X1 (18-in-1 Automated Powder Characteristics Tester)

PowderPro X1 (18-in-1 Automated Powder Characteristics Tester)

This system offers fully automated powder characterization of up to 18 key parameters, featuring a patented 360° angle-of-repose imaging technology and integrated environmental monitoring with dust control.
Pharma Value: Serving as the powder property gatekeeper for the tableting process, this single instrument automatically characterizes up to 18 powder parameters, including angle of repose, compressibility, and flowability. Through systematic Carr Index evaluations, QC teams can quantitatively predict the flow behavior of blended powders in high-speed tablet press hoppers. In commercial production, preventing powder bridging and ratholing is critical for stable feeding, consistent tablet weight and content, while minimizing unplanned downtime.

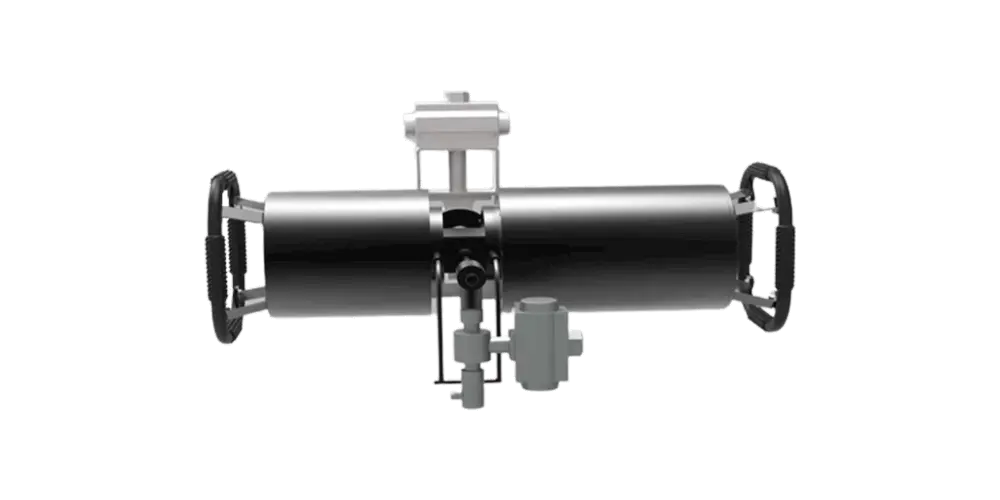
BetterPyc 380 (Versatile Gas Pycnometer)

This automated gas pycnometer offers 5-in-1 testing for volume, true density, solid content, open and closed cell content, featuring thermoelectric temperature control and interchangeable sample cells.
Pharma Value: Delivering an ultra-high accuracy of 0.02% and repeatability of 0.01%, it serves as a critical QA/QC tool for ensuring lot-to-lot consistency in commercial manufacturing. The highly reproducible true density data is essential for monitoring final tablet porosity and verifying content uniformity across massive production runs. Furthermore, its fully automated testing workflow and SOP operations eliminate human error during routine batch release, guaranteeing robust data integrity and precise material reconciliation on the factory floor.
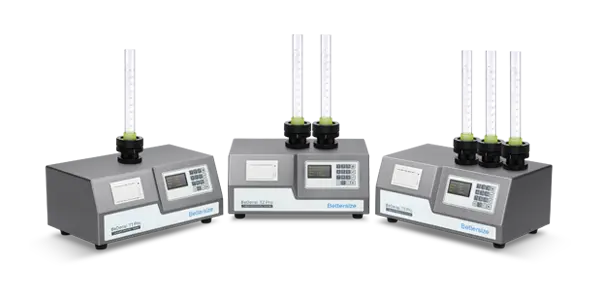
BeDensi T Pro (Tapped Density Tester)

BeDensi T Pro (Tapped Density Tester)

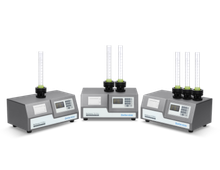
Available in configurations with 1, 2, or 3 workstations, this tester provides exceptional test repeatability of better than 1.0% and supports standard cylinder sizes and drop heights.
Pharma Value: Tapped density is a fundamental indicator of powder compressibility. By complying strictly with USP, Ph. Eur., ASTM, and ISO standards, this instrument guarantees that commercial batch release criteria are met with unquestionable regulatory integrity.

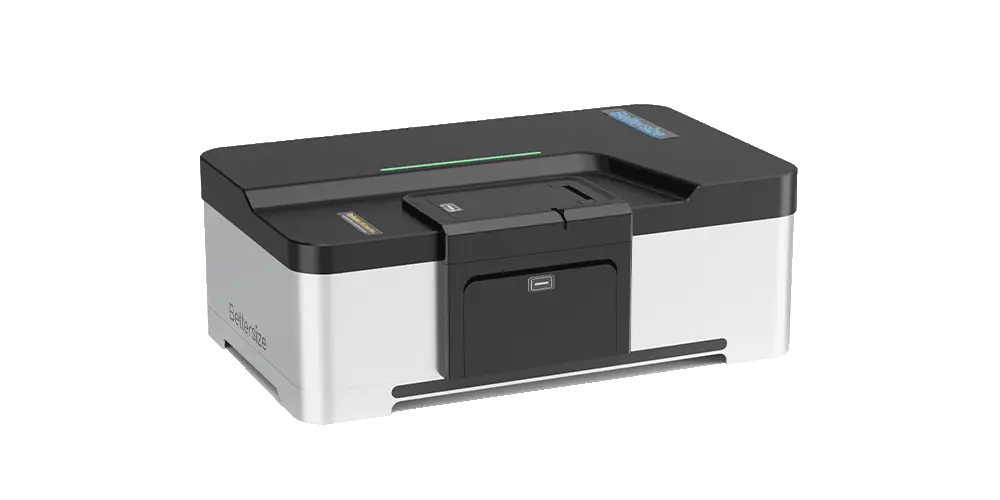
Bettersizer ST (Particle Size Analyzer)

A fully automated QC analyzer for wet dispersion with a measurement range of 0.1 to 1,000 µm, utilizing patented DLOS (Dual Lens Optical System) technology.
Pharma Value: Designed for high-frequency factory environments, its robust, low-maintenance footprint delivers high accuracy and repeatability (≤1%). Complying with ISO 13320 and USP <429>, it minimizes operator training requirements and equipment downtime, establishing a highly reliable foundation for 24/7 quality control.

3. Conclusions

The physical characterization of particles and powders is the bedrock of a robust pharmaceutical manufacturing pipeline. Bettersize’s comprehensive portfolio addresses the specific technical hurdles of each phase—accelerating stability assessments in R&D, optimizing morphological parameters during scale-up, and ensuring rheological consistency in commercial tableting. By embedding smart software with SOP automation and full 21 CFR Part 11 compliance into high-precision instruments, Bettersize equips pharmaceutical manufacturers with the data integrity and process control required to maximize yields, minimize risks, and deliver safe, effective therapeutics to the market.

References

  • FDA 21 CFR Part 11 (Electronic Records; Electronic Signatures): Official compliance framework for data integrity in pharmaceutical manufacturing. Link: https://www.ecfr.gov/current/title-21/chapter-I/subchapter-A/part-11
  • USP <1174> (Powder Flow): US Pharmacopeia guidance standard defining flow characterization methods, including angle of repose, compressibility index, and Hausner ratio. Link: https://www.usp.org
  • USP <616> (Bulk Density and Tapped Density of Powders): Official testing method governing bulk and tapped density determination to evaluate powder compressibility in solid dosages. Link: https://www.usp.org
  • ISO 22412:2025 (Particle size analysis — Dynamic light scattering): International standard establishing the measurement principles and validation criteria for sub-micron and nanoparticle sizing using DLS. Link: https://www.iso.org/standard/85505.html
  • ISO 13099-2:2025 (Colloidal systems — Methods for zeta-potential determination): Global reference outlining optical measurement procedures (ELS/PALS) for characterizing surface charge and colloidal dispersion stability. Link: https://www.iso.org/standard/86762.html
  • ASTM E3520-26 (Stability of Concentrated Colloidal Dispersions Using SMLS): Official American Society for Testing and Materials standard practice governing the evaluation of dispersion stability and destabilization kinetics in liquid formulations, directly applicable to Static Multiple Light Scattering (SMLS) technology. Link: https://store.astm.org/e3520-26.html
  • ISO/TR 13097:2013 (Dispersibility and dispersion stability — Characterization): Standard technical documentation detailing static multiple light scattering (SMLS) methodologies to evaluate concentrated liquid formulations. Link: https://www.iso.org/standard/52802.html
  • ISO 13322-1:2014 (Particle size analysis — Static image analysis methods): Official international standard for analyzing particle size, circularity, and morphology via static microscopic imaging. Link: https://www.iso.org/standard/51257.html
  • ISO 13322-2:2021 (Particle size analysis — Dynamic image analysis methods): Technical specifications governing real-time particle characterization, shape factor calculations, and non-spherical sizing in flowing particle streams. Link: https://www.iso.org/standard/72566.html
  • ISO 9276-6:2008 (Representation of results — Descriptive and quantitative representation of particle shape): International framework standardizing qualitative and quantitative shape descriptors (e.g., aspect ratio, circularity, convexity). Link: https://www.iso.org/standard/39389.html
  • ISO 13320:2020 (Particle size analysis — Laser diffraction methods): The global International Organization for Standardization framework for particle sizing via laser diffraction. Link: https://www.iso.org/standard/69111.html
  • USP <429> (Laser Diffraction Measurement of Particle Size): Official United States Pharmacopeia standard outlining the regulatory requirements and instrument qualification for laser diffraction in pharmaceutical formulations. Link: https://www.usp.org

Citations

  • Bettersizer 2600

    Functional redundancy as an indicator for evaluating functional diversity of macrobenthos under the mussel raft farm near Gouqi Island

    DOI: 10.1016/j.aquaculture.2023.740024 Read Article Go logo
    Zhejiang Ocean University | 2024
    Biological traits analysis (BTA) helps to evaluate the effects of different environmental variables on the traits-based functional composition of macrobenthos. However, research on functional traits of macrobenthos under mussel farming is limited. We investigated the spatial and temporal response of the benthic system in terms of taxonomic and functional diversity to environmental variables of farming and natural stressors resulting from suspended mussel farming near Gouqi Island of eastern China Sea. The functional traits of macrobenthic assemblages under mussel farming were characterized by “medium adult body size”, “vermiform body form”, “high flexibility”, “infauna”, “semi-motile”, “gonochoristic”, “surface deposit-feeders”, “carnivores”, “semi-motile burrowers”, and “tube-dwellers”. Functional redundancy was stable in response to mussel farming stresses among seasons, whereas species diversity showed efficient to evaluate natural variables. Functional diversity was significantly affected by farming stressors rather than natural variables, Further analysis using multivariate methods together with continuous monitoring were highlighted to evaluate the impacts of mussel farming. Our results reinforce the importance of macrobenthic species and functional traits analysis to evaluate human stresses driven impacts in offshore ecosystems. By analysing the environmental variables with different sources, independently, we concluded the main effects of human pressures on macrobenthic community. Such distinction could be particularly effective to isolate variable environmental descriptors and evaluate their effects on functional diversity, making the current approach promising for the evaluation of ecological effects of anthropogenic stressors in aquaculture areas.
  • Bettersizer 2600

    Degradation characteristics and utilization strategies of a covalent bonded resin-based solid amine during capturing CO2 from flue gas

    DOI: 10.1016/j.seppur.2023.125621 Read Article Go logo
    China University of Petroleum | 2024

    In this study, various types of degradation as well as attrition which are possibly encountered in a circulating fluidized bed temperature swing adsorption (CFB-TSA) process, were conducted experimentally to evaluate the stability of a resin-based solid amine sorbent. Other characterizations methods, such as elemental analysis (EA), Fourier transform infrared spectroscopy (FTIR) etc. were applied to further reveal the degradation mechanisms. The results showed that thermal degradation occurs from 140–160 °C due to the decomposition of amine group. The CO2-induced degradation occurs from a higher temperature of 160–180 °C accompanied by the production of urea. Hydrothermal stability is good below 130 °C, but the ionic impurities in steam crystalized on particle surface can accelerate the degradation. Oxidative degradation is the most harmful, which starts at a lower temperature of 70–80 °C with the formation of aldehyde. The existence of H2O in atmosphere can alleviate the oxidative and CO2-induced degradations. The employed sorbent has a very low attrition index of 0.05, which is 1–2 orders lower than typical commercial fluidized bed catalysts. Based on the results of stability evaluation, some design suggestions for proper utilization of this sorbent or other similar resin-based sorbents have been provided in an industrial CFB-TSA process.

  • Bettersizer 2600

    De-branching of starch molecules enhanced the complexation with chitosan and its potential utilization for delivering hydrophobic compounds

    DOI: 10.1016/j.foodhyd.2023.109498 Read Article Go logo
    Shihezi University | 2024
    The current study aimed to prepare the complexes between debranched-waxy corn starch and chitosan polymers (DBS-CS), and then investigated their corresponding structural characteristics, rheological property and potent application in Pickering emulsion. The results indicated that the existence of chitosan significantly inhibited starch short-range molecular rearrangement for all DBS-CS samples, which was manipulated by both debranching treatment and chitosan content. Interestingly, this is the first study to reveal that the outstanding peak at 1.8 ppm in 1H NMR spectrum for sample DBS-CS was gradually shifted towards a lower-field region following an increased chitosan content. Moreover, the debranching treatment shifted the crystallinity pattern from A-type to B-type and the relative crystallinity of DBS-CS decreased gradually with the increased content of CS. All samples had a pseudoplastic fluid and shear-thinning behavior with an enhanced shear resistance following the complexation. The DBS-CS was applied in a Pickering emulsion for showing a greater emulsifying stability and a lower gel strength than native NS-CS prepared emulsion. Importantly, the encapsulation ability of curcumin in the DBS-CS emulsion was significantly improved, followed by an increase of 15.45% for its corresponding bioavailability compared to the control. Therefore, this study might highlight a potential carrier for delivering the bioactive substances in a green pattern.
  • Bettersizer 2600

    Heat-induced aggregation behavior of wheat gluten after adding citrus pectin with different esterification degree

    DOI: 10.1016/j.foodhyd.2023.109420 Read Article Go logo
    Gansu Agricultural University | 2024
    Wheat gluten aggregation during heat treatment is beneficial to the final quality of gluten-based products. Exogenous pectin can affect gluten aggregation. However, the effect of pectin with different degrees of esterification on the heat-induced aggregation behavior of gluten and its possible mechanism are still unclear. Thus, the heat-induced aggregation behavior of gluten after adding pectin with different esterification degree was studied in this study. When the temperature was raised from 25 °C to 95 °C, pectin affected gluten aggregation and was related to the degree of esterification. Specifically, the results of rheological properties and particle size indicated that low-ester pectin improved the viscoelasticity of gluten and promoted gluten aggregation. Thermal properties revealed that enthalpy of gluten added with low-ester pectin (37%) increased from 92.96 J/g to 95.40 J/g during heating process. Structurally, the fluorescence intensity and surface hydrophobicity of gluten added with low-ester pectin (37%) were lower than those added with high-ester pectin (73%). In addition, low-ester pectin (37%) significantly increased the disulfide bond content (from 15.31 μmol/g to 18.06 μmol/g) and maintained β-sheet content of gluten compared with gluten alone at 95 °C, indicating that low-ester pectin was more likely to induce gluten aggregation. However, scanning electron microscope showed that the gluten added with low-ester pectin (46%) exhibited a denser network structure at 95 °C than that added with low-ester pectin (37%). These results will provide a theoretical base for the regulation of gluten aggregation and the quality of gluten-based products by pectin with different esterification degree.
Page 1 of 84
  • 1
  • 2
  • 3
  • 4
  • 5
  • 6
  • 84
Go to

Curated Resources

More resources

Related Particle Size Analyzer

  • BeSEC

    Light Scattering Detector for SEC/GPC Systems

    Dual detection angles: 7° and 90°

    Molecular weight range: 1 kDa to 2 GDa

    Supports radius of gyration Rg > 12 nm

  • PowderPro X1

    PowderPro X1

    Powder Characteristics Tester

    18-in-1 automated powder characterization platform

    Tapped Frequency: 1 – 300 taps/min

    Settable Number of Tap: Max. 9999

  • new-bescan-lab-plus

    BeScan Lab+

    Stability Analyzer

    Particle size ranges from 0.01 to 1000 μm

    Volume fraction up to 95%

    Compliance with ISO/TR 18811, 13097, 21357, 22107, 13317

  • BeVision D3 Series

    Image Analyzer

    Dispersion type: Dry

    Measurement range: 0.5 μm - 26 mm

    Technology: Dynamic Image Analysis

  • Bettersizer 2600 Plus

    Particle Size and Shape Analyzer

    Measurement range: 0.02 - 2,600μm (Wet dispersion)

    Measurement range: 0.1 - 2,600μm (Dry dispersion)

    Dynamic imaging analysis range: 2 - 3,500 μm

  • Bettersizer S3 Plus

    Bettersizer S3 Plus

    Laser Diffraction Particle Size Analyzer

    Measurement range: 0.01 - 3,500μm (Laser System)

    Measurement range: 2 - 3,500μm (Image System)

  • Bettersizer 2600

    Bettersizer 2600

    Particle Size Analyzer

    Measurement range: 0.02 - 2,600μm (Wet dispersion)

    Measurement range: 0.1 - 2,600μm (Dry dispersion)

  • PowderPro A1

    Powder Characteristics Tester

    Operation Mode: Automatic

    Tapping Speed: 50 - 300 taps/min

    Repeatability: ≤3% variation

  • BeVision M1

    BeVision M1

    Automated Static Image Analyzer

    Dispersion type: Dry

    Measurement range: 0.3 - 10,000 μm

    Technology: Static Image Analysis

  • BeVision S1

    BeVision S1

    Classical and Versatile Static Image Analyzer

    Dispersion type: Dry & Wet

    Measurement range: 0.3 - 4,500 µm

    Technology: Static Image Analysis

  • BeDensi T Pro Series

    BeDensi T Pro Series

    Tapped Density Tester with a Wallet-Friendly Solution

    Number of Workstations: 1-3

    Tapping Speed: 100 - 300 taps/min

    Repeatability: ≤1% variation

  • BT-Online1 online particle size analyzer for dry powder

    BT-Online1

    Online Particle Size Analyzer

    Dispersion type: Dry

    Measurement range: 0.1 - 1,000μm

    Accuracy: ≤1% (D50 of certified reference material)

  • BeDensi-B1-S-Scott-Volumeter

    BeDensi B1-S

    Scott Volumeter

    Measurement: Bulk Density

    Compliance with USP, Ph. Eur., ASTM, and ISO standards

  • BeNano 180 zeta max

    BeNano 180 Zeta Max

    Nanoparticle Size and Zeta Potential Analyzer

    Particle size measurement via sedimentation technology

    Refractive index measurement

    Particle concentration measurement