How to Choose a Laser Diffraction Particle Size Analyzer: Matching Optical Design to Your Laboratory Workflow
2026-11-02News
Key Takeaways: Choose by Laboratory Workflow
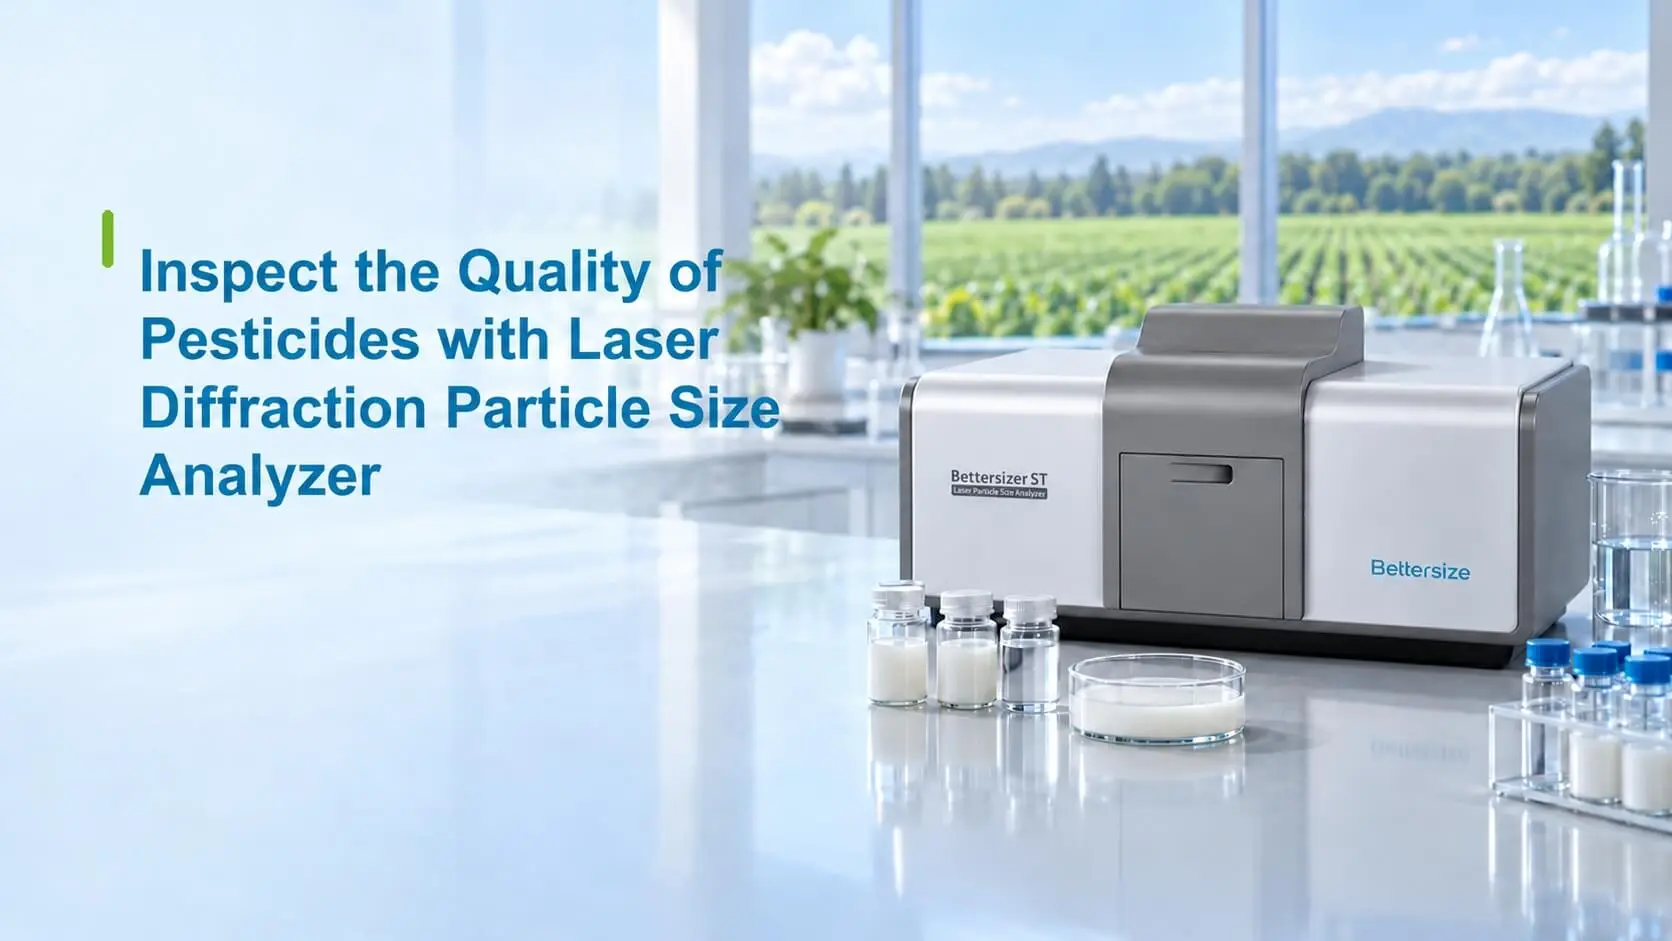
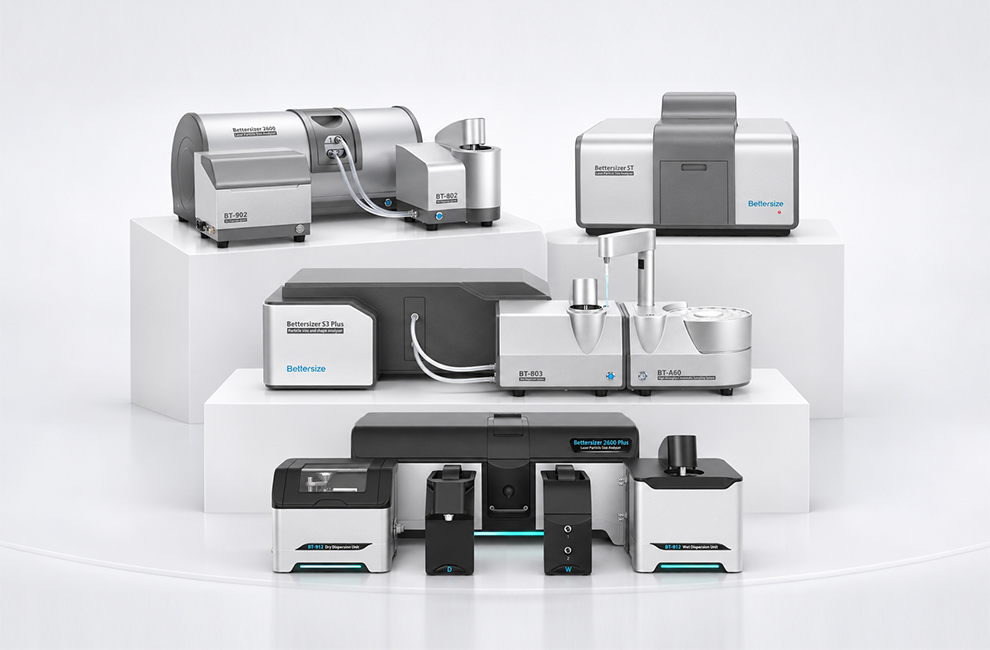
- Bettersizer ST: For routine wet-dispersion QC of similar samples, focus on SOP-based automated measurement, automatic alignment, and cleaning to streamline repeat testing.
- Bettersizer 2600: For laboratories handling different powders and suspensions, compare modular wet and dry dispersion configurations, with dynamic image analysis available as an optional expansion.
- Bettersizer 2600 Plus: For flexible wet and dry dispersion configurations, with the optional PIC-1 module providing particle size, shape, and images in a combined wet-dispersion workflow.
- Bettersizer S3 Plus: For research centered on wet dispersion, finer particle populations, and regular use of laser diffraction alongside integrated dual-camera dynamic image analysis to understand samples.
1. Understand the Optical Design: How Does Scattered Light Become a Particle Size Distribution?
Laser diffraction (LD) analyzes light scattered by particles and uses an optical model and an inverse algorithm to calculate the particle size distribution. In general, larger particles scatter light mainly at smaller angles, while information about smaller particles requires collection over a wider angular range. When choosing an analyzer, consider both its measurement range and how its light source, lenses, sample cell, and detectors work together.
Consider Both Angular Coverage and How Light Reaches the Detectors
The central task of optical design is to deliver the large-angle scattering from fine particles and the small-angle scattering from coarse particles effectively to the detectors. Lens arrangement, sample cell geometry, and wide-angle detector arrays work together to determine how signals are collected and how the analyzer handles samples with broad particle size distributions.
DLOS (Dual Lens Optical System): Wide-Angle Collection in a Compact Optical Path. The Bettersizer ST uses a single laser source, two lenses, and forward, lateral, and backward detectors to collect scattering signals at different angles, covering 0.1–1,000 μm. Its compact design avoids folded optics that can be susceptible to misalignment, providing a stable foundation for signal collection in routine wet-dispersion QC.
Tilted Sample Cell and a 92-Detector Array: More Effective Collection of Large-Angle Scattered Light. The Bettersizer 2600 and 2600 Plus combine Fourier and inverse Fourier optical designs and use a tilted sample cell to reduce signal losses caused by total internal reflection (TIR). Their 92 forward, lateral, and backward detectors cover 0.016°–165°, capturing small-angle signals from coarse particles and large-angle signals from submicron particles to support wet-dispersion sizing from 0.02 to 2,600 μm.
DLOI (Dual Lenses & Oblique Incidence): Large-Angle Scattering Collection for Fine-Particle Research. The Bettersizer S3 Plus uses dual lenses and oblique incidence to collect large-angle signals, including backscattered light. With a 532 nm light source and 96 detectors, it provides a wet laser diffraction range of 0.01–3,500 μm. Its integrated dual-camera dynamic imaging system provides particle images and shape information over 2–3,500 μm, bringing fine-particle sizing and imaging of larger particles into one wet-dispersion workflow.
For samples containing both fine and coarse particles, adequate signal collection is needed at both ends of the distribution. Wide angular coverage and a dense detector array collect scattering information from different particle populations, helping build a complete distribution from the fine to the coarse end. During a demonstration, use representative samples to examine responses at both ends and compare how the curves change under different dispersion conditions.
Distinguish Optical Design from the Calculation Model
Lenses and detectors collect the signals; Mie or Fraunhofer models interpret them. Mie analysis requires optical parameters for the particles and dispersion medium, including the particles' complex refractive index. The Fraunhofer approximation has specific conditions of applicability, so an unknown refractive index alone is not a reason to apply it to every sample.
When the optical parameters of new or composite materials are unclear, parameter selection becomes part of developing the Mie-based method. The Bettersizer 2600 Plus provides a refractive index (RI) measurement function to help determine optical parameters for unknown samples, reducing uncertainty associated with estimating RI solely from experience. We recommend using a sample demonstration to assess how parameter selection affects the particle size distribution, taking the material's properties into account.
Define What You Mean by “Particle Size”
Laser diffraction generally interprets scattering signals using an optical model of spherical particles to produce an equivalent particle size distribution. For nonspherical particles, results can differ from those obtained by sieving or image analysis. The public abstract of ISO 13320:2020 also describes this difference between measurement methods.
This distinction helps guide instrument selection. LD can provide data for comparing particle size distributions between batches. If you also need aspect ratio, circularity, or particle images, evaluate image analysis. These types of information complement one another; specify the measurement principle and statistical basis when interpreting the results.
2. How to Choose a Laser Diffraction Particle Size Analyzer: Four Requirements for Your Shortlist
1. Measurement Range: Cover the Particle Populations That Affect Your Decisions
Start with the size range of your routine samples, then identify any fine particles, coarse particles, or distribution tails that need particular attention. Make these priorities explicit when evaluating an instrument—for example, “compare changes at the fine end after milling” or “investigate an abnormal coarse tail.” This gives the demonstration a clear objective.
Compare wet LD, dry LD, and imaging ranges separately. For the Bettersizer 2600 Plus, wet LD covers 0.02–2,600 μm, dry LD covers 0.1–2,600 μm, and dynamic image analysis covers 2–3,500 μm. Its 0.02 μm lower limit comes from laser diffraction, while PIC-1 imaging starts at 2 μm. Measuring fine-particle size does not mean imaging particles at the same scale.
2. Dispersion Method: Bring Particles into the Optical Path in a Suitable State
Choose wet or dry dispersion based on material behavior and the measurement objective. For wet dispersion, assess whether a suitable medium can wet the particles and maintain a stable dispersion, and whether dissolution or reaction occurs. For dry dispersion, check that feeding and dispersion conditions break up agglomerates sufficiently while preserving the particles you intend to measure.
For example, when comparing samples before and after milling, distinguish changes caused by processing from those caused by dispersion during measurement. Adjust and record conditions such as ultrasonication, circulation, or dry-dispersion pressure, and observe whether the distribution stabilizes before establishing the method for that sample. Set parameters for each material rather than applying one set to all materials.
Include wetted materials, solvent compatibility, circulation volume, and cleaning in your wet-dispersion comparison. These determine which media you can use, how much liquid is consumed, and the work involved in changing samples. The Bettersizer 2600 Plus offers different wet dispersion units, including configurations for specific solvent requirements and small-volume measurements. Confirm solvent compatibility for the selected unit. For laboratories that frequently change samples, these differences can have a more direct effect on daily work than the analyzer's measurement range.
3. Information Required: Particle Size Distribution, or Shape as Well?
If your task is to determine whether a routine sample's particle size distribution has changed, start by evaluating the LD workflow. If you also need to examine the appearance of agglomerates, irregular particles, or coarse particles, dynamic image analysis (DIA) adds useful information.
The Bettersizer 2600 Plus can be equipped with the PIC-1 dual-camera dynamic imaging module to provide size, shape, and particle images in supported combined wet-dispersion workflows. The S3 Plus integrates LD and dynamic image analysis in one instrument. [4,5] During a demonstration, examine actual images within the size range of interest and review image counts, sampling representativeness, and the statistical approach. Images help investigate abnormal particles; detection capability depends on the sample, sampling, and measurement conditions.
4. Efficiency: Follow the Workflow from Sample Preparation to Report Archiving
When evaluating throughput, record a complete test cycle: sample preparation, dispersion, background checks, measurement, cleaning, repeat testing, and reporting. Acquisition time accounts for only part of the cycle.
For routine QC, check whether standard operating procedures (SOPs) can save and reuse test conditions, whether automatic alignment and cleaning are straightforward to run, and whether reports make batch comparisons convenient. The Bettersizer ST supports SOP-based automated measurement, automatic alignment, and configurable automatic cleaning to help establish standardized wet-dispersion QC workflows.
For QC centers with high daily sample volumes, the Bettersizer 2600, 2600 Plus, and S3 Plus can be equipped with the optional BT-A60 automatic sampling system. After preparing and loading suitable samples and setting the SOP, users can start unattended, continuous testing of up to 60 samples with one click, linking automated sampling, dispersion, measurement, and cleaning between samples. This reduces repetitive manual tasks such as individual sample loading and cleaning, helps different shifts follow the same procedure, and gives staff more time for reviewing results and investigating anomalies. We will match a batch-testing configuration to your needs, considering the autosampler's applicable particle size range, sampling volume, and sample dispersion state.
For laboratories working with controlled electronic records, a demonstration can cover user permissions, audit trails, electronic signatures, and data review. Bettersizer 2600 Plus software supports these controlled workflows, and our application team can explain the relevant functions and configurations in the context of your procedures and validation requirements.
3. Which Bettersizer Fits Your Laboratory? Narrow the Options by Workflow
Use the comparison below to identify which configurations to evaluate first. Confirm ranges and capabilities for your specific configuration, samples, and preparation conditions.
The Bettersizer 2600 also supports an optional dynamic imaging module. Our application team can help match the analyzer, wet and dry dispersion units, imaging module, and software functions to your sample list and measurement objectives, aligning the complete configuration with your laboratory's work.
Browse our Bettersizer series product page to explore each model, or use the Bettersizer 2600 Plus Comparison Guide to compare measurement capabilities, optical design, and automation configurations.
4. Before You Buy: Run a Demonstration with Your Own Samples
Prepare a set of samples that represents routine work and the main measurement challenges, and agree in advance on the parameters to examine. Include these five checks:
- Define the measurement objective: Specify the particle size parameters, distribution intervals, or shape features you need to compare, rather than judging the instrument by an attractive curve alone.
- Check method suitability: Record the dispersion medium, optical parameters, obscuration, and dispersion conditions, and assess result stability as you make appropriate adjustments.
- Distinguish repeat measurements from independent sample preparation: Repeated tests on one dispersed sample and tests after fresh sampling and dispersion evaluate different parts of the process.
- Demonstrate the complete procedure: Follow sample preparation through cleaning and report export, recording time, consumables, and manual steps to support budget comparisons.
- Confirm the supplied configuration: List the required accessories, training, maintenance, and validation support. When replacing an instrument, also establish a method-transfer and acceptance plan.
When replacing an existing analyzer, compare representative samples against predefined acceptance criteria and evaluate sample preparation, dispersion, optical inputs, and analysis settings. Using the same measurement principle does not automatically produce identical results. Where necessary, document systematic differences and determine whether method adjustments or partial revalidation are needed.
5. Make Optical Capabilities Part of Your Laboratory Workflow
Choosing a laser diffraction particle size analyzer means establishing a practical sequence: disperse the sample appropriately, collect the information you need with the optical system, turn the results into comparable and traceable data through the software, and enable your team to execute the method consistently.
Comparing particle size distributions, relevant particle images, and complete test procedures with your own samples turns a specification comparison into practical evaluation. Gather your sample types, expected size ranges, current methods, and measurement questions, then contact Bettersize to request sample testing and discuss suitable configurations and methods with our application team. You can also explore the Bettersizer series or visit the introduction to Particle Sizing: A Guide to Laser Diffraction and obtain the guide to learn more about the method.
Frequently Asked Questions
Is a Wider Measurement Range Always Better?
Suitability depends on your samples and measurement task. The range should cover the particle populations of interest, alongside suitable dispersion, optical parameters, and stable results. Compare wet LD, dry LD, and imaging ranges separately.
What Is the Difference Between DLOS and DLOI?
DLOS combines two lenses with forward, lateral, and backward detectors to collect wide-angle signals. The ST uses this design for a compact optical path and routine wet-dispersion QC. The S3 Plus uses DLOI, combining dual lenses and oblique incidence to collect large-angle signals, including backscattered light. Together with its light source and detector design, this supports a wet LD lower limit of 0.01 μm, while dual cameras provide size and shape information.
Should Wet and Dry Dispersion Produce the Same Particle Size Results?
Identical results should not be assumed. Dispersion media, dispersion energy, and the state of the particles during measurement can differ. To establish comparable methods, validate them using representative samples from the same batch and document the conditions and acceptable differences.
Can Laser Diffraction Directly Measure Particle Shape?
LD provides a particle size distribution based on scattering signals and an optical model. Particle images and shape parameters require an appropriate image analysis system. The 2600 Plus offers optional PIC-1 imaging, while the S3 Plus incorporates dynamic image analysis. Confirm capabilities against the selected configuration and imaging range.
Can D90 Reveal a Small Number of Oversized Particles?
D90 is a percentile of the cumulative particle size distribution; by itself, it cannot confirm or rule out a small population of oversized particles. For a volume-based distribution, D90 is the particle size at which the cumulative volume fraction reaches 90%, rather than the maximum particle size. To investigate the coarse end, review the complete distribution and representative sampling, and examine particle images within the applicable range when needed.
Can I Use My Existing SOP After Replacing a Laser Diffraction Analyzer?
The existing SOP is a starting point for method transfer and needs validation on the new configuration. Check sample preparation, dispersion, optical parameters, obscuration, analysis settings, and the response to critical particle populations, then assess comparability against predefined criteria.
|
FURTHER READING / COMPARISON Want to know which one Read the comparison page to see what our instruments can help your workflow. Read the Comparison →Laser Diffraction · Bettersizer Series |
 |
Rate this article
Share On


Recent News