Modernizing Traditional Quality Control: Laser Diffraction vs. Sieving, Sedimentation, and Coulter Counting
2026-11-16News
Particle size quality control needs to answer two questions: how much material is retained on a specified sieve, and what is changing within the particle population? Conventional sieving separates a sample into a limited number of size fractions and reports the mass proportion of each. Within a fraction, particles toward the coarse and fine ends are combined into the same reported value. Two powders can therefore have similar sieve residues yet different fines contents and distribution widths. A few sieve fractions alone make it difficult to determine whether further milling is reducing particle size, or which size interval is changing.
Gravity sedimentation extends the analysis to finer particles, but it distinguishes size fractions by allowing particles to settle through a liquid. At the same particle density and medium conditions, and where Stokes' law applies, smaller particles settle more slowly and require longer waits to obtain fine-end results. For workflows involving frequent batch comparisons or adjustments during milling, a longer test cycle delays the particle size feedback available to process staff.
Laser diffraction collects scattered light at different angles to derive a volume-based particle size distribution across the instrument's measurement range in a single measurement. A more detailed distribution curve, together with Dv10, Dv50, and Dv90, helps us compare changes in the fine end, main peak, and coarse end. Measurement in seconds reduces the time needed to obtain this information. Our Bettersizer ST and Bettersizer 2600 both have typical single-measurement times of less than 10 seconds, providing timely particle size data for batch comparison and milling monitoring.
What Do Laser Diffraction, Sieving, Sedimentation, and Coulter Counting Measure?
The key difference between these methods is the physical response used to define particle size. Understanding each method's equivalent diameter helps you choose a technique that answers the relevant QC question.
|
Method |
Principle and Typical Output |
Suitable Tasks |
Method and Operating Considerations |
|---|---|---|---|
|
Sieving |
Size defined by sieve passage; mass fractions determined by weighing |
Coarse-particle classification, sieve residue measurement, and retention of physical size fractions |
Fine-particle adhesion, static charge, and agglomeration; particle orientation affects the passage of nonspherical particles |
|
Sedimentation |
Stokes-equivalent diameter; pipette and hydrometer methods commonly report mass proportions by size fraction |
Size-fraction analysis of fine-grained soils and sediments; tests requiring a sedimentation method |
Density, viscosity, and temperature; slow settling of fine particles requires longer waits |
|
Coulter counting |
Volume-equivalent diameter by the electrical sensing zone principle; particle counts and number- or volume-based distributions |
Particle number, number concentration, and individual particle volume |
Electrolyte, aperture size, and concentration; control of coincidence and aperture blockage |
|
Laser diffraction |
Equivalent spherical diameter derived from light scattering; commonly reports volume-based particle size distributions |
Rapid batch comparison, assessment of fine and coarse fractions, and tracking of distribution changes |
Use an SOP to standardize sampling, dispersion, optical parameters, and concentration |
Sieving defines particle size by passage through a sieve aperture. Passage depends on particle width and orientation: needle-shaped and plate-like particles change orientation during vibration, affecting whether they pass. Static charge, adhesion, and agglomeration of fine powders can also increase mesh blockage and complicate separation. Laser diffraction adds more detailed particle size information when changes within the fine fraction need to be assessed.
Gravity sedimentation reports a Stokes-equivalent diameter. Where Stokes' law applies and density and medium conditions are unchanged, settling velocity is proportional to the square of particle diameter, d²: halving the diameter reduces settling velocity to one-quarter. Finer particles therefore require longer settling times, while measurements in the submicron region are more susceptible to Brownian motion and liquid convection. Laser diffraction collects scattering signals directly, removing the need to wait for successive size fractions to settle.
Coulter counting reports a volume-equivalent diameter using the electrical sensing zone principle, also known as resistive pulse sensing. Particles dispersed in an electrolyte pass individually through an aperture, displacing electrolyte and generating electrical pulses. With a suitable conductivity contrast and appropriate measurement conditions, pulse amplitude is proportional to individual particle volume, while the number of pulses is used for counting. Method setup centers on the electrolyte, aperture size, and particle concentration.
Laser diffraction reports an equivalent spherical diameter derived from light scattering. Larger particles scatter predominantly at small forward angles, while finer particles require information from larger scattering angles. The system derives a volume-based distribution using Mie theory or the Fraunhofer approximation, which is suitable for relatively coarse, opaque particles. Submicron analysis uses Mie theory with appropriate optical parameters and makes use of large-angle and backscattering detection.
Three Priorities When Modernizing Particle Size QC
1. Speed: Get Results Sooner to Support Decisions
Our review of sediment analysis methods lists typical run times of approximately 15–20 minutes for sieving, tens of minutes to hours for gravity sedimentation, and about 1 minute for laser diffraction. These differences reflect the measurement mechanisms: sieving requires physical separation and weighing, sedimentation requires different size fractions to settle, and laser diffraction analyzes the particle population through scattering signals.
The Bettersizer ST and Bettersizer 2600 both have typical single-measurement times of less than 10 seconds. An SOP organizes background measurement, dispersion, measurement, and cleaning into a consistent workflow, helping laboratories complete repeat testing more efficiently and use particle size feedback for batch comparisons and process adjustments.
Coulter counting provides information for tasks that require individual particle counts or number concentration. When routine QC focuses on volume distributions and changes across a broad size range, laser diffraction allows testing and reporting to be organized directly around the distribution curve.
2. Information: Move Beyond a Few Sieve Fractions
Sieving answers the question, “How much material remains above a specified aperture size?” When the focus shifts to fines content, distribution width, or changes in particle size peaks, a more continuous particle size distribution provides additional comparison points. In a laser diffraction report, Dv10, Dv50, and Dv90 are the diameters at which the cumulative volume distribution reaches 10%, 50%, and 90%, respectively. Reviewing these values alongside the full curve reveals whether samples with similar median sizes still differ at the fine or coarse end.
Submicron fines, the main peak, and the coarse tail can be assessed together in the same laser diffraction report. We combine Dv10, Dv50, and Dv90 with the distribution curve to distinguish fine-end changes, overall shifts in size, and residual coarse particles, helping process staff decide whether to investigate dispersion, milling, or batch differences.
Dv90 identifies the diameter corresponding to 90% cumulative volume; sieve residue describes the actual mass retained on a specified sieve. Assigning these outputs to their respective tasks—distribution assessment and physical retention—makes use of laser diffraction's speed while retaining sieving's role in physical classification.
3. Routine Operation: Standardize the Method for Comparable Data
A consistent QC workflow starts with representative sampling, followed by a clear decision on whether the target is primary particles or agglomerates. Dispersion intensity is then set accordingly. Recording the dispersion medium, stirring or ultrasound conditions, optical model, optical parameters, and sample concentration in an SOP allows repeat tests to follow the same method.
We use the Bettersizer ST's SOP-based automatic measurement to save and reuse these settings, with background measurement, alignment, dispersion, measurement, and cleaning performed in the defined sequence. Standardized operating steps reduce differences in manual settings and support data comparisons across shifts and measurement days.
Why Can D50 Change When the Same Sample Is Measured by a Different Method?
The same particle population produces different distributions when different weighting bases are used. A number distribution gives each particle equal weight; area and volume distributions weight particles by area and volume, respectively. Consider equal numbers of spherical particles measuring 1 μm and 2 μm: each size accounts for 50% by number, but their area shares are 20% and 80%, and their volume shares are approximately 11.1% and 88.9%. Larger particles therefore carry more weight in a volume distribution.
D50 has a clear meaning only when the distribution basis is stated. We use Dv50 for the volume median diameter, while a number median describes the midpoint by particle count. Conversion to a number distribution increases the weight of fine-end data, so the converted result should be assessed against the intended counting task.
Particle shape also affects results across methods: sieving measures passage through apertures, sedimentation measures motion in a liquid, and laser diffraction measures the scattering response. Sieving commonly reports mass fractions, while laser diffraction commonly reports volume fractions. Uniform density allows these fractions to be related; representative samples are then used during method transfer to establish how size metrics relate to quality decisions.
From Sediments to Pesticides: Particle Size Analysis in Practice
Sediments: Sieving for the Coarse Fraction, Laser Diffraction for the Fines
In our “A Practical Workflow for Sediment Grain-Size Analysis with Laser Diffraction and Sieving,” two sediment samples were split at 1 mm. Coarse particles larger than 1 mm were mechanically sieved into fractions and weighed, while the fraction smaller than 1 mm was analyzed using the Bettersizer 2600 Plus. This retained physical classification of the coarse fraction while adding a more detailed size distribution for the material below 1 mm.
For data integration, we converted the fine-fraction results to a mass basis, then combined the sieve results and fine-particle distribution using the measured mass proportions of the coarse and fine fractions as weights. The resulting full distribution links sieving with laser diffraction for samples that require both a coarse-fraction proportion and a detailed fine-fraction distribution.
Pesticides: Compare Formulations and Processing Conditions
In the formulation development and milling monitoring of aqueous pesticide suspension concentrates (SCs), sieve residue measures retained coarse material, while the volume-based particle size distribution reveals the fine end, main peak, and coarse tail. Coarse-end changes are relevant to settling behavior. At the same material mass and with similar particle shapes, size reduction increases total surface area, affecting wetting, dispersion, and stabilizer requirements. Combining Dv10, Dv50, and Dv90 with the curve shape helps process staff compare changes before and after milling.
In our suspension concentrate milling tests, the Bettersizer ST tracked distributions at different milling times. As milling progressed, Dv50 decreased and Dv10 changed relatively little; changes in Dv50 and Dv90 became smaller at later stages. Comparing these metrics with the cumulative distribution curves shows which size fractions are being reduced and provides particle size evidence for deciding whether to continue milling.
In the formulation trials, we separately compared xanthan gum dosage, particle size distribution, and viscosity in two oil-in-water emulsions (EWs), and Dv10, Dv50, and Dv90 in three suspension concentrate formulations. Keeping formulation types and process variables separate makes the relationship between particle size changes and formulation design clearer, and helps identify samples for subsequent stability assessment.
Matching the Bettersizer ST and Bettersizer 2600 to Your Laboratory
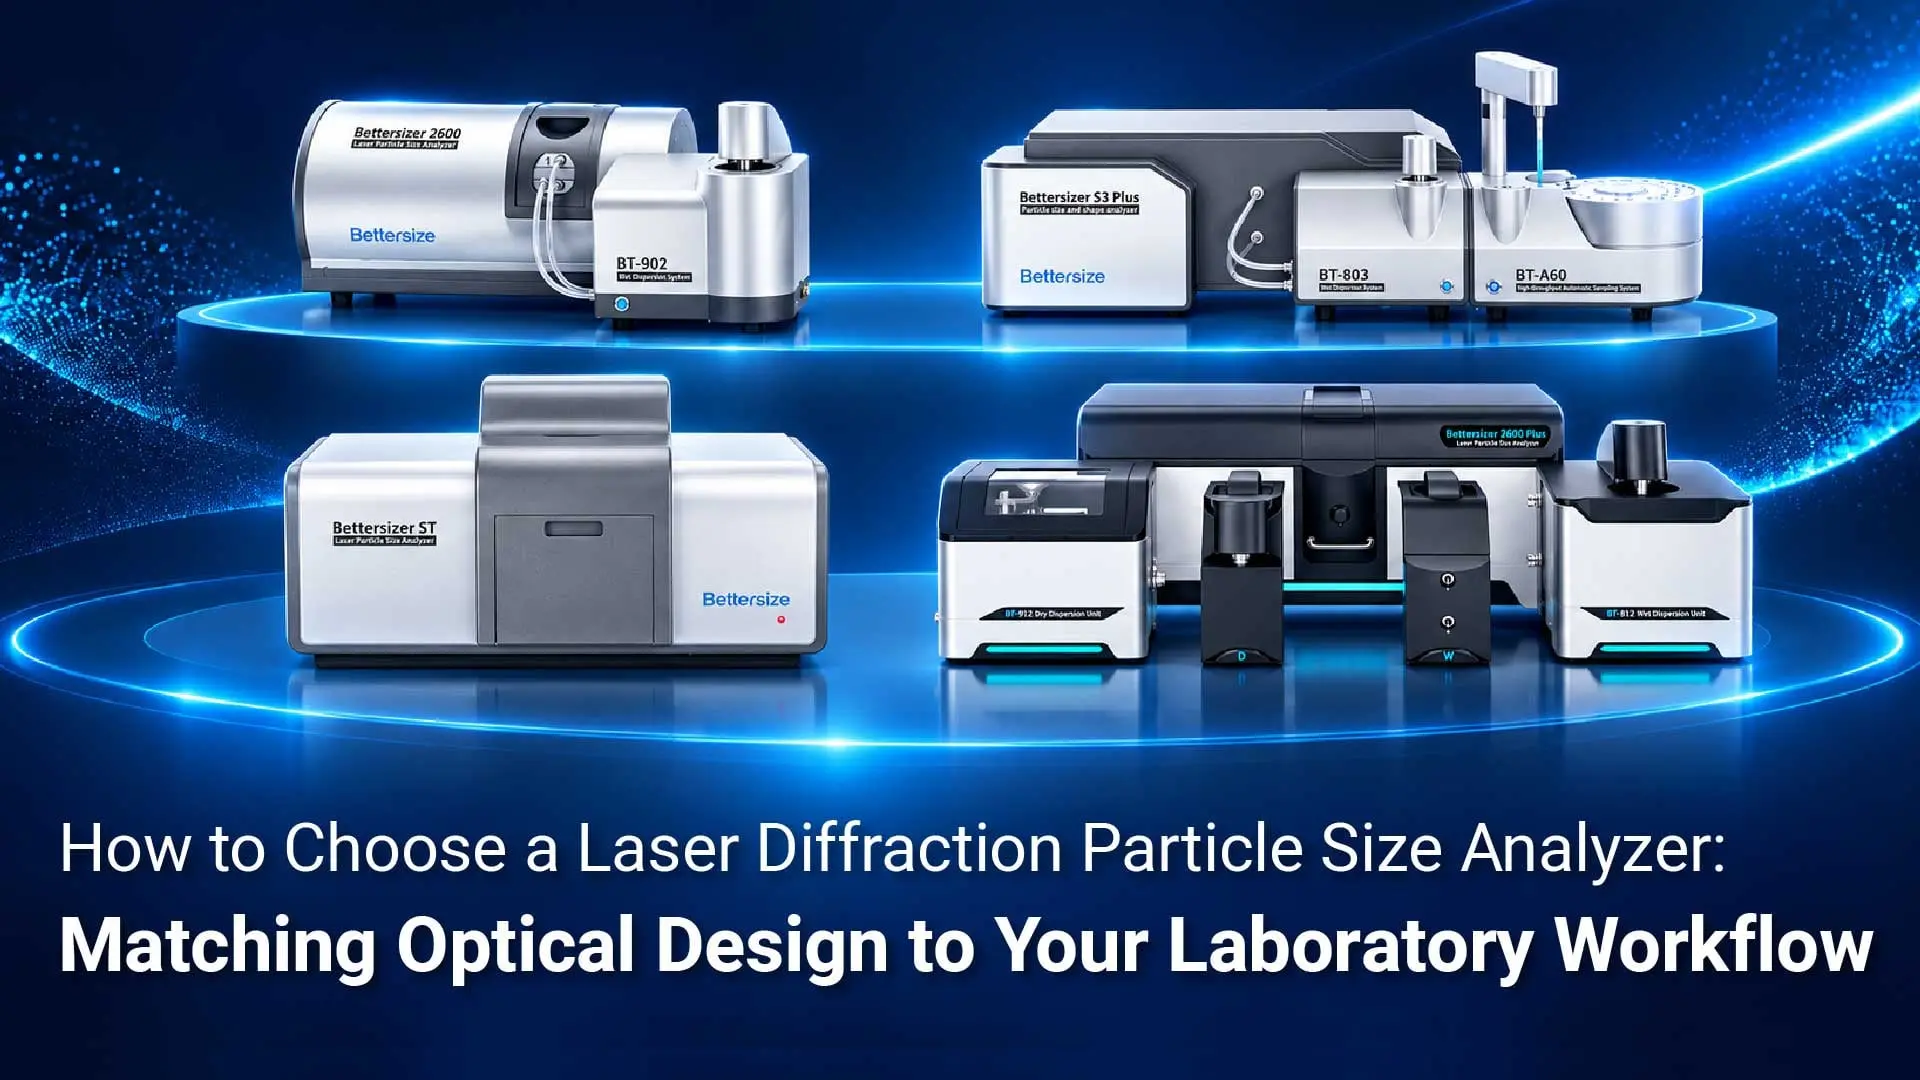
For Routine Wet-Dispersion QC: Bettersizer ST
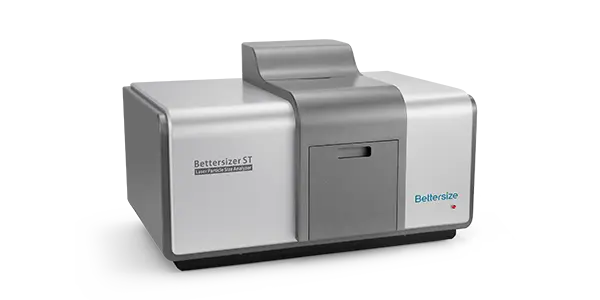
Designed for industrial quality control, the Bettersizer ST offers a wet measurement range of 0.1–1,000 μm. Its Dual Lens Optical System (DLOS), combined with forward, side, and backward detector arrays, collects the multi-angle scattering signals needed for particle analysis from the submicron to millimeter scale, bringing fine- and coarse-end information into the same report.
With one-click SOP recall, automatic alignment, wet circulation dispersion, measurement, and automatic cleaning follow the configured workflow, reducing manual adjustments and differences in parameter settings. Using consistent SOPs for method management across shifts and sites helps teams standardize operating steps and compare incoming, in-process, and finished-product samples more efficiently.
For More Sample Types and a Choice of Wet or Dry Dispersion: Bettersizer 2600

The Bettersizer 2600 provides two analysis paths: 0.02–2,600 μm with wet dispersion and 0.1–2,600 μm with dry dispersion. Its modular dispersion platform supports method development for varied dry powders, suspensions, and samples in different media, addressing the dispersion needs of routine QC and R&D.
For powders that dissolve readily in water, dry dispersion is an option, as are BT-80N or BT-80N Pro wet dispersion units compatible with the intended organic solvent. R&D staff can progressively adjust dry dispersion air pressure, wet dispersion ultrasound, and stirring conditions to assess agglomerate breakup and particle integrity, then standardize suitable dispersion conditions for routine QC.
Four Steps for Transferring an Existing Method to Laser Diffraction
- Define the decision metrics. List the current sieve residue, sedimentation fraction, or counting metrics and the quality decision each supports.
- Select representative samples. Include routine batches, fine- and coarse-end variations, and sample differences that have historically affected decisions.
- Develop and standardize the method. Optimize sampling, dispersion, concentration, and optical analysis conditions, and assess repeat sample preparation separately from repeat measurements.
- Complete parallel validation. Compare the same sample set using the existing and new methods, explain differences, and confirm the new metrics or relationships under the quality system.
These four steps turn faster measurement into an operational QC method: define the objective, establish metrics using actual samples, and standardize the parameters and decision workflow for routine use.
Put Particle Size Data to Work Earlier in Quality Control
Moving from long sedimentation waits to scattering data collected in seconds—and from a few sieve fractions to a view of submicron fines, the main peak, and the coarse tail—allows particle size data to contribute more promptly and fully to quality control. We use the Bettersizer ST to support standardized wet-dispersion QC, and the Bettersizer 2600's wet and dry dispersion platform to support a wider variety of samples and method development tasks.
Upgrading your particle size testing workflow? Provide your sample's physical form, expected size range, current test method, and measurement objectives through our Free Sample Testing page. Our applications team can discuss a test plan and help you assess the distribution information and routine workflow you need using the capabilities of the Bettersizer ST or Bettersizer 2600.
Frequently Asked Questions
1. Can laser diffraction completely replace sieving?
Laser diffraction can handle validated routine particle size distribution testing. Sieving continues to provide physical separation when actual sieve residue or retained physical size fractions are required. During an upgrade, compare existing metrics with laser diffraction data in parallel, then confirm the new testing metrics and workflow within the quality system.
2. Can laser particle size testing really take less than 60 seconds?
An individual instrument measurement can. The Bettersizer ST and Bettersizer 2600 both have typical single-measurement times of less than 10 seconds, supporting rapid repeat measurements. Organizing sampling, preparation, dispersion, and cleaning through an SOP allows laboratories to manage both measurement speed and the overall sample workflow.
3. Can sieving measure submicron particles?
Submicron fines are typically analyzed using techniques suited to fine particles, such as laser diffraction. Conventional mechanical sieving is affected by aperture size, particle adhesion, and agglomeration, and is mainly used for coarser-particle classification and sieve residue measurement. Laser diffraction provides additional information on the distribution within the fine fraction.
4. What is the difference between Coulter counting and the electrical resistance method?
The terms generally refer to the same principle: the electrical sensing zone method, also known as resistive pulse sensing. Particles pass individually through an aperture in an electrolyte; the number of pulses is used for counting, and pulse amplitude for volume analysis. Method settings include the electrolyte, aperture size, and particle concentration.
5. Why do laser diffraction and sedimentation give different results?
They define particle size through different physical mechanisms. Laser diffraction calculates an equivalent spherical diameter from scattering signals and an optical model; sedimentation calculates a Stokes-equivalent diameter from settling velocity, density, and viscosity. Standardize sample treatment and reporting basis, then consider particle shape when interpreting differences to establish a useful relationship between methods.
6. Can a volume distribution be converted directly to a number distribution for QC?
A number distribution can be obtained mathematically, but conversion increases the weighting of fine particles. For QC, check fine-end data quality and the suitability of the converted result for the intended decision. Tasks requiring particle number concentration can use a direct counting method such as Coulter counting.
|
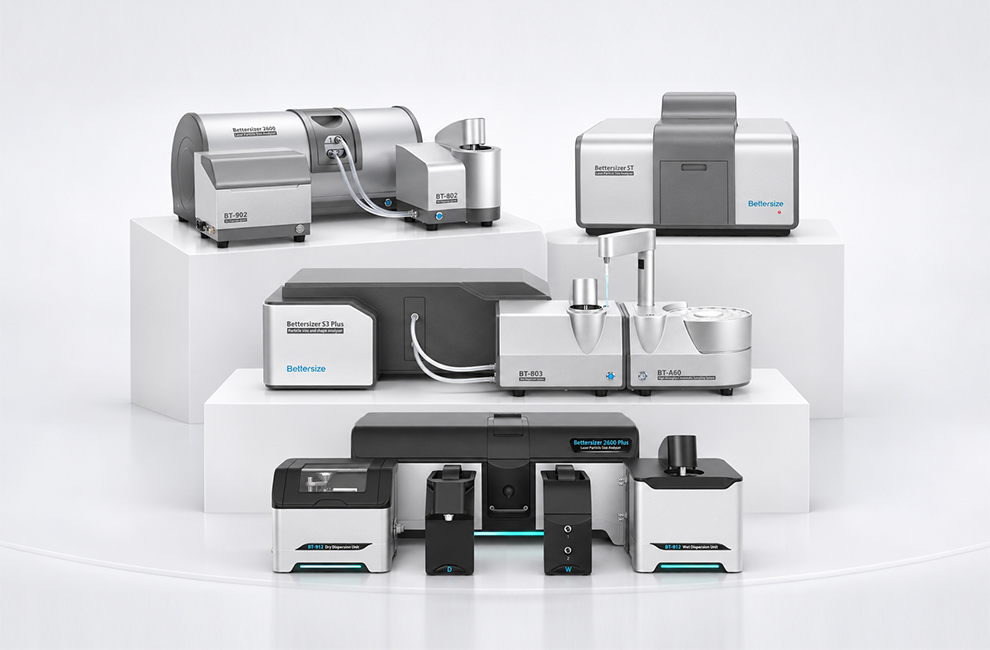
FURTHER READING / COMPARISON Want to know which one Read the comparison page to see what our instruments can help your workflow. Read the Comparison →Laser Diffraction · Bettersizer Series |
 |

Rate this article
Share On


Recent News