Establishing a Method for Laser Diffraction Particle Size Analysis of Lactose Powder
2021-07-21Application Note
This note details a systematic study on lactose particle size distribution measurement, following USP and ISO 13320 standards. It addresses gaps in current guidelines, specifically on choosing dispersive pressure and evaluating dry/wet method results for this common tablet excipient.
| Product | Bettersizer 2600 |
| Industry | Pharmaceuticals |
| Sample | Lactose |
| Measurement Type | Particle Size |
| Measurement Technology | Laser Diffraction |
Jump to a section:
Abstract: Objective: To establish a method for the determination of lactose powder particle size by laser diffraction. Method: Using Bettersizer 2600 with a fully automatic dry dispersion system, to systematically study the particle size measurement of lactose powders. Investigated the effect of different dispersion pressures on the particle size distribution measurement and researched the precision of dry dispersion method. Conclusion: By comparing the measurement results, it is concluded that dry dispersion can control risks well and provide more reasonable data correlation.
Key words: Laser diffraction; Particle size analyzer; Lactose
The powder properties of excipients have important effects on the preparation process and quality. In order to guide the selection of the excipients of the tablet prescription, the prescription and process design of the tablet can be developed from the traditional "experience" to the scientific and quantitative level by measuring the powder study index of the excipient. At the same time, the quantitative control of the excipients also helps to ensure the quality and stability of the tablets.
Lactose is one of the most common kinds of tablet excipients. The USP has clear regulations on raw materials particle sizing by laser diffraction method, such as the structure and principle of the instrument, the specific method of dry and wet dispersions, the factors in the measurement process, etc. However, for specific lactose, there is no related instruction on how to choose the dispersive pressure and how to evaluate the results of dry and wet methods. This paper carried out a systematic research on lactose particle size distribution measurement in accordance with the USP and the ISO 13320.
1. Experiment
1.1 Instruments
- Bettersizer 2600 laser particle size analyzer from Bettersize Instrument Ltd;
- MS303S electronic scale from Mettler Toledo;
1.2 Sample and reagent
- No.1: non-micronized lactose sample (batch No.00116-17);
- No.2: micronized lactose sample.
2. Particle size distribution measurement and method evaluation
2.1 Study on the methodology of dry dispersion method
Dry dispersion is to transport powder particles by compressed air, disperse powder particles by collision of particles and particles, collision of particles and pipe, and airflow shear. Lactose powder was composed by small organic molecules particles, which could break under the shear stress and collision. In order to ensure the dispersal of large agglomerate without breaking the original particles, the USP requires investigating the effect of different dispersive intensity on measurement results (USP 429):
In dry dispersion experiments, we investigated the effect of dispersed pressure on the particle sizing results. The dispersed pressure ranged from 0.05 MPa to 4 MPa, and a set of d
ata was tested every 0.05 MPa to 0.1 MPa.
Abscissa: dispersion pressure; Ordinate: particle size; Blue
curve: D10; Orange curve: D50; Grey curve: D90.
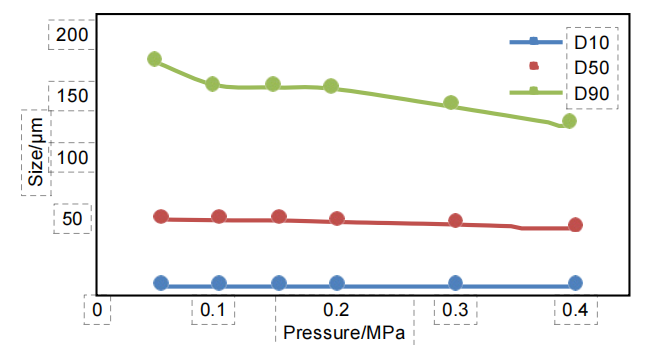
The ideal pressure titration curve, as the dispersion pressure increases, the particle size gradually decreases, and the curve gradually reaches a stable period. If pressure increases further, the curve will go further downward, which corresponds to the gradual dispersal of large agglomerate to single particles. If the pressure is further increased, the drug particles could break.
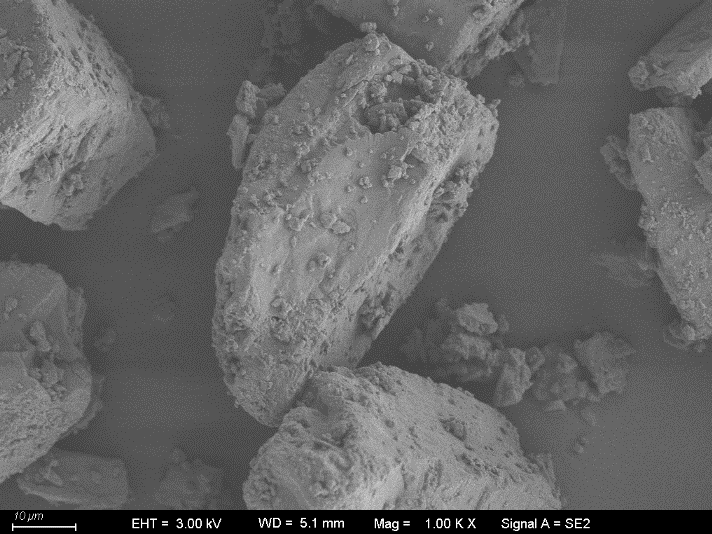
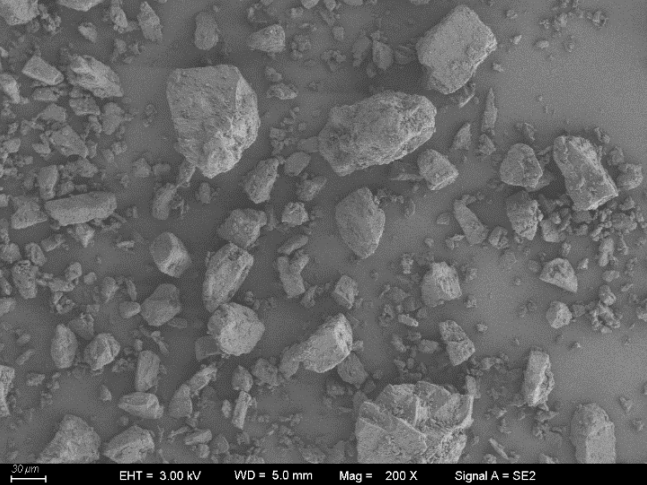
Through the above pressure titration curve, lactose sample appeared an obvious "stable platform", which represented the results between 0.1 MPa and 0.2 MPa. For further diagnosis, we captured the image of micronized lactose sample (Figure 2 & 3), which shown that the sample was semitransparent irregular crystal particles. Judging from the state, the sample was easy to break. When increasing the dry dispersion pressure, the risk of particle breakage would increase consequently.
2.2 Research of the precision of dry dispersion method
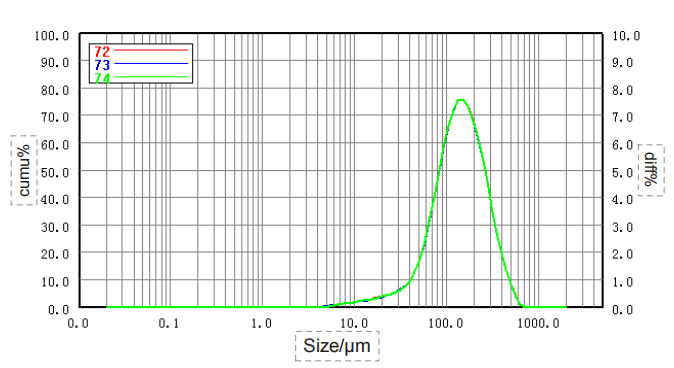
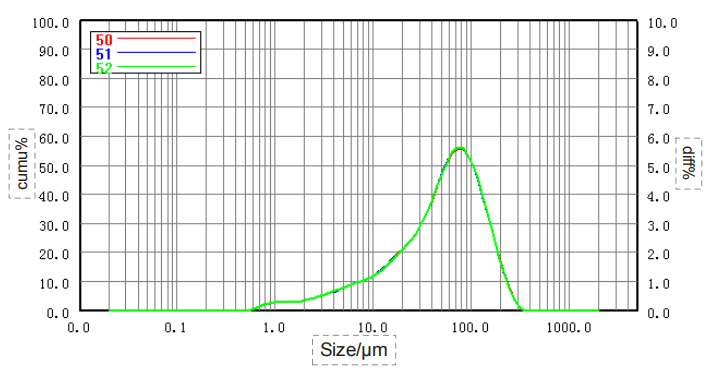
Considering the fragile property of lactose, the precision of the sample size was investigated under dispersion pressure 0.1 MPa. Figure 4 and 5 shown the particle size distribution curves and repeatability data of p-micronized and micronized samples.
The repeatability results measured by Bettersize particle size analyzer 2600 for both samples far exceeded the requirements of the USP: the fluctuation of D50 data was less than 0.5%, and the relative standard deviation of the D10 and D90 data was below 1%, indicating the high accuracy of the dry dispersion method.
| Number | Sample |
D10 / µm
|
D50 / µm | D90 / µm |
| 72 | No. 1 lactose | 57.40 | 141.4 | 304.1 |
| 73 | No. 1 lactose | 57.15 | 141.2 | 304.0 |
| 74 | No. 1 lactose | 57.32 | 141.2 | 304.1 |
| RSD | 0.22% | 0.08% | 0.02% |
| Number | Sample |
D10 / µm
|
D50 / µm | D90 / µm |
| 50 | No. 2 lactose | 7.822 | 55.8 | 144.7 |
| 51 | No. 2 lactose | 7.840 | 55.76 | 144.0 |
| 52 | No. 2 lactose | 7.813 | 55.81 | 144.2 |
| RSD | 0.18% | 0.05% | 0.25% |
3. Conclusion
Dry dispersion is an adaptive way to measure particle size distribution of lactose. But considering the fragility of lactose, the test pressure should be as small as possible to prevent the break of the lactose original particles. In the above test, we chose 0.1 MPa and obtained satisfied results.
About the Author
| Dr Xuebing Li, Shiqi Liu, Mei Li, Liuyang Xu Engineers @ Application Research Lab, Bettersize Instruments |
|
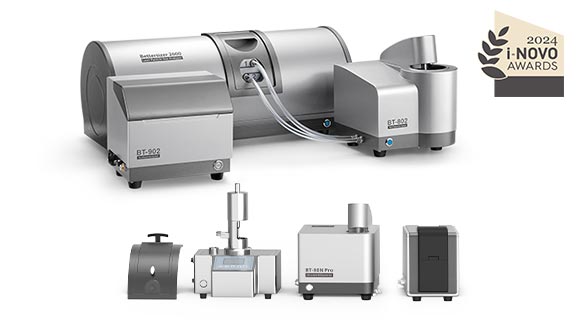
Bettersizer 2600 The Bettersizer 2600 utilizes proven Laser Diffraction Technology to measure particle sizes ranging from 0.02 to 2,600 μm.
|
 |
LOGIN TO ACCESS EXCLUSIVE CONTENT
More Resources Including
- Application Notes & Collections
- Webinars & Workshops
- Presentations & Videos
- Monthly Newsletters
- Exclusive Events...

Recommended articles
Rate this article