How to Use Particle Size Data to Evaluate Pesticide Formulations and Milling Performance
2026-10-22News
Insight
Particle size data turn the effects of formulation and processing conditions into comparable results. In pesticide R&D and QC, it is useful to review D10, D50, D90, Span, and the full particle size distribution together. D50 describes the median particle size, while Span and D10/D90 help show distribution width and changes at the fine and coarse ends. In Bettersize’s pesticide application experiments, changes in xanthan gum content, pressure conditions, and milling time were each associated with changes in particle size distribution. Combined with measurements such as viscosity, these data provide a clear basis for formulation screening and process comparison.
Why Can’t D50 Represent the Entire Particle Size Distribution?
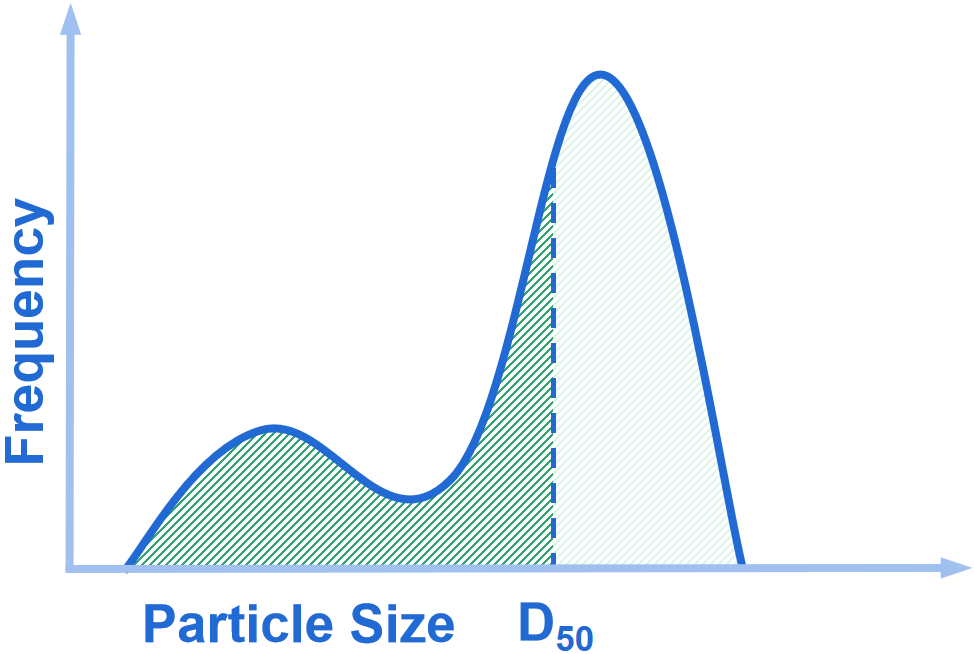
D50 is the particle size at which the cumulative volume distribution reaches 50%; in other words, it is the median particle size by volume. Think of it as a useful “center marker” for the distribution: it quickly shows whether a sample is generally coarser or finer, but it does not tell you what is happening at either end. For more on D50, visit the Bettersize Wiki.
D10 and D90 are the particle sizes at which the cumulative volume distribution reaches 10% and 90%, respectively. Span is commonly calculated as (D90 − D10) / D50. It is a dimensionless measure of distribution span; a smaller value generally indicates a narrower D10-to-D90 interval relative to D50. Together with the full particle size distribution curve, these metrics help show whether the median size has changed, whether the distribution has widened, and whether the coarse end has shifted.
How does this help with pesticide formulation development? Two formulations can have similar D50 values and still have different particle size distributions. Reviewing D50, Span, D10, and D90 alongside target properties such as viscosity and suspension behavior helps formulators compare systems more precisely and identify what to investigate in the next formulation or process trial.
How Does Laser Diffraction Help Teams Compare Samples?
In laser diffraction measurement, a dispersed sample passes through a laser beam, and multiple detectors capture the light scattered by particles at different angles. Particle size affects the scattering pattern; the instrument uses an optical model and calculation method to convert the signal into a volume-based particle size distribution. Bettersizer ST provides characteristic particle sizes such as D10, D50, and D90, as well as the full distribution curve, allowing R&D and QC teams to move beyond a single median value and assess the overall distribution.
When comparing formulations, batches, or process conditions, standardizing and recording sample dispersion and measurement conditions makes it easier to relate changes in the results to the variable being investigated. This gives sample comparisons a sounder basis and supports method reuse.
How Does Xanthan Gum Content Affect the Particle Size Distribution of Emulsions?
Xanthan gum is commonly used as a thickener and rheology modifier. In an emulsion formulation, changing its concentration also changes the system’s viscosity. Xanthan gum and wetting or dispersing agents serve different formulation functions, so particle size and rheological behavior should be assessed together rather than relying on a single measurement.
In Bettersize’s application experiments, we used high-speed shear to process 10% cypermethrin EW and 10% bifenthrin EW samples and measured them at room temperature. As xanthan gum content changed, D50 first increased and then decreased in both systems, while Span first decreased and then increased. This shows that the relationship between xanthan gum content and particle size distribution was not simply linear. By comparing multiple metrics, formulators can observe how particle size distribution and viscosity respond together as thickener levels change.
In the 10% bifenthrin EW experiment, the two reported D50 extreme values were 0.92 μm and 1.20 μm, and the two Span extreme values were 1.19 and 0.31. Considering the viscosity results for this system, the experiment selected the formulation with 0.075% xanthan gum. For R&D, this illustrates how particle size distribution and viscosity can be used together in formulation screening. The exact correspondence between each xanthan gum concentration and each extreme value should be checked against the original data before being listed.
How Does Milling Time Change the Particle Size Distribution of Suspension Concentrates?
Milling changes the particle size distribution of suspension concentrates (SC). We compared SC samples milled for different times. As milling time increased, D50 decreased from 1.015 μm at 0.5 hours to 0.812 μm at 4 hours. D90 decreased from 12.39 μm at 0.5 hours to approximately 4.7 μm in the later milling stages. Overall, the distribution shifted toward smaller particle sizes as milling progressed, with the change becoming less pronounced at later times.
Images from the BeVision S1 image particle size analyzer provide a visual complement to the particle size data: coarse particles larger than 10 μm were visible in the 0.5-hour sample, while the particle appearance changed markedly in the 4-hour sample. For SC formulation and process teams, D50 tracks the median particle size, D90 helps monitor the coarse end, and the full distribution curve shows how the distribution shape changes. Together, these results make it easier to assess particle size changes during milling and plan subsequent evaluations of dispersant and milling conditions.
How Do Pressure Conditions Relate to Particle Size Results for Wettable Powders?
In a wettable powder (WP) comparison, the values listed for D[4,3], D10, D50, and D90 were all lower under the 0.8 MPa pressure condition than under 0.2 MPa. This provides a direct comparison of particle size results under two pressure conditions. Recording pressure conditions alongside particle size data supports side-by-side comparison during formulation and process evaluation. For the full sample details and experimental context, see the original application note.
Turning Particle Size Data into Routine R&D and QC Decisions
1. Define the variable to compare: formulation level, filler composition, pressure condition, or milling time.
2. Review D10, D50, D90, Span, and the full distribution curve together instead of judging change from a single median value.
3. Record sample dispersion and measurement conditions to build a repeatable comparison method.
4. Combine particle size results with formulation targets such as viscosity and suspension behavior to decide the next optimization step.
5. When evaluating storage stability or a specific failure mechanism, interpret particle size results alongside the corresponding stability and formulation validation data.
How Does Bettersizer ST Support Pesticide R&D and QC?
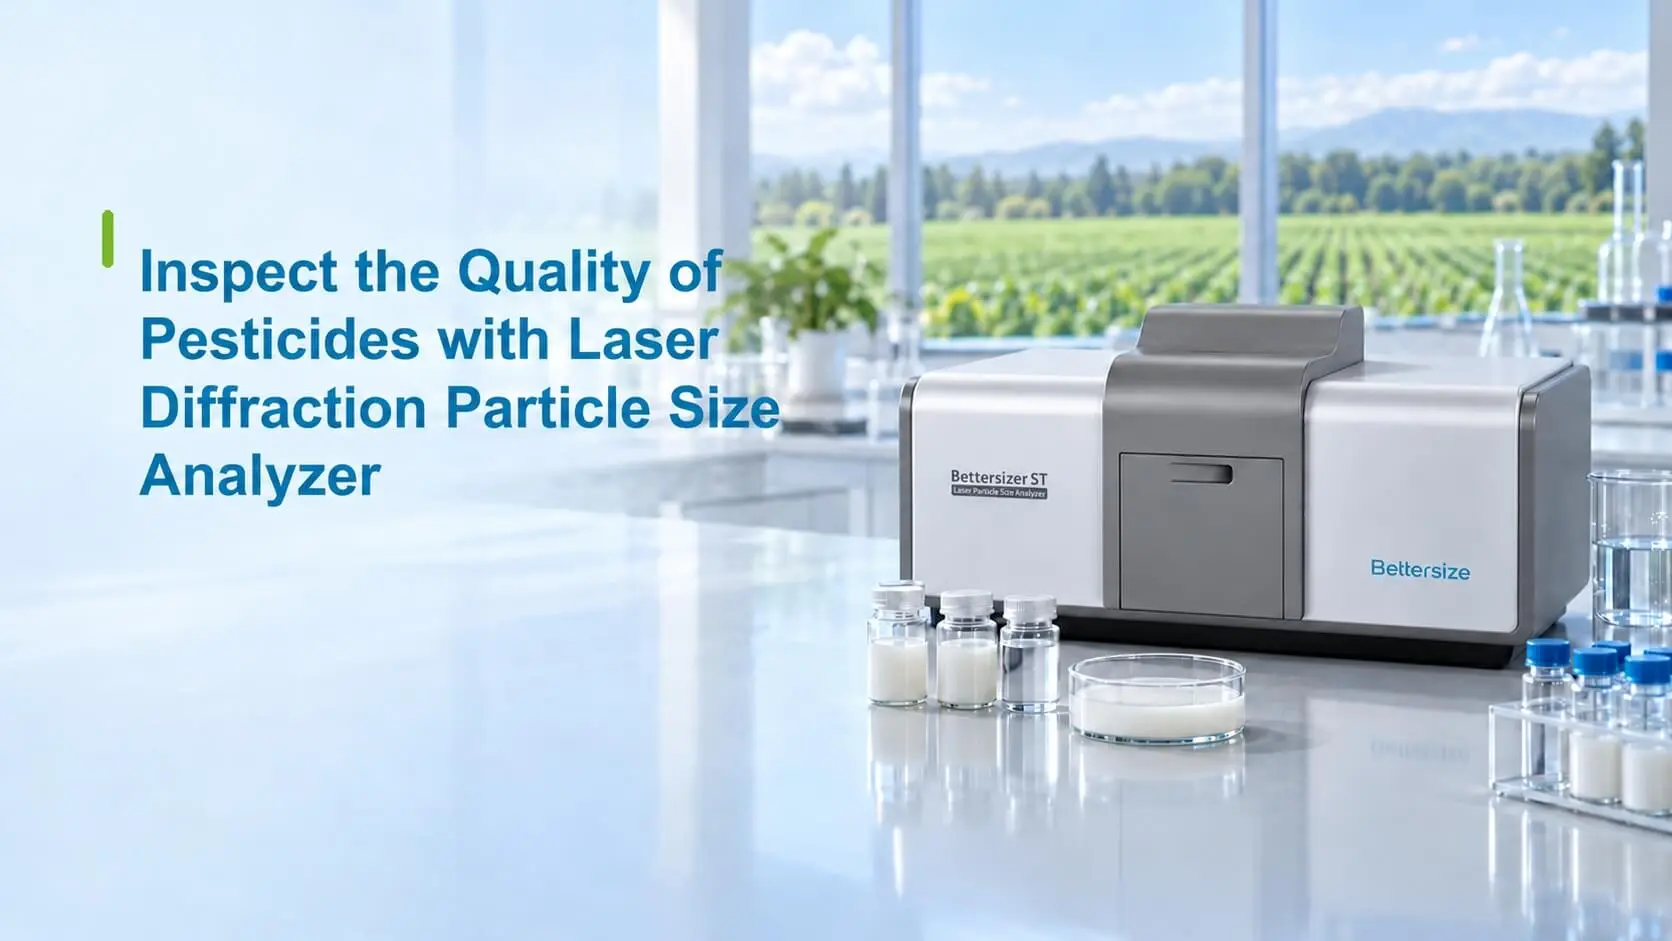
Bettersizer ST is a laser diffraction particle size analyzer designed for industrial quality control. Its automatic wet circulation system transports, circulates, and disperses samples. For laboratories comparing multiple formulations or monitoring particle size across batches, ST provides particle size distributions and characteristic values such as D10, D50, and D90, helping teams use a consistent particle analysis workflow for formulation screening and routine QC.
SOP-based automatic measurement saves and reuses test parameters and workflows, helping teams perform repeat measurements using an established method. Automatic alignment reduces the need for manual adjustment, while automatic cleaning supports instrument cleaning between different samples. By standardizing the measurement workflow, laboratories can more easily compare formulations and batches. Measurement methods should be optimized for the sample.
See how the Bettersizer ST can fit into your pesticide formulation development or QC workflow. If you would first like to understand how your sample can be analyzed, apply for Free Sample Testing. Submit the sample form and measurement objective to discuss a testing plan with the Bettersize application team and receive sample analysis results and instrument recommendations.
Frequently Asked Questions
Why should pesticide formulators review D50 and Span together?
D50 is the median particle size by volume, while Span describes the distribution width from D10 to D90 relative to D50. Together, they help compare the center and width of a formulation’s particle size distribution. When the goal is to monitor suspension stability directly, pair particle size analysis with Bettersize’s BeScan Lab+ analyzer, which uses Static Multiple Light Scattering (SMLS) to monitor undiluted samples for changes such as sedimentation, creaming, and flocculation.
Does a smaller Span mean a pesticide formulation is always more stable?
A smaller Span generally indicates a narrower D10-to-D90 interval relative to D50. To evaluate stability over time, combine particle size characterization with direct stability monitoring and storage testing.
Will particle size keep increasing as xanthan gum content increases?
Not necessarily. In the two EW systems tested, D50 first increased and then decreased as xanthan gum content changed, while Span first decreased and then increased. Formulation screening should consider particle size distribution and viscosity together.
Will SC particle size keep decreasing as milling time increases?
In the SC comparison, D50 decreased overall with milling time, while D90 declined to approximately 4.7 μm in the later milling stages and the rate of change became less pronounced. Review multiple characteristic particle sizes and the full distribution curve when assessing milling performance.
What particle size analysis can Bettersizer ST support in a pesticide laboratory?
Using laser diffraction, Bettersizer ST provides particle size distributions and characteristic values such as D10, D50, and D90. These results can be used to compare formulations, pressure conditions, milling times, or batches.
How can I apply for Free Sample Testing for a pesticide sample?
Submit the sample form and measurement objective through Bettersize’s Free Sample Testing page. The application team can discuss a testing plan based on the sample and provide sample analysis results and instrument recommendations.
|
FURTHER READING / APPLICATION NOTE Want to see the full experimental parameters, PSD curves, and repeatability data tables? Read the original application note for the full experimental methods, data, and findings. Read the Original →Pesticide · Laser Diffraction · Particle Size Distribution |
 |
Rate this article
Share On


Recent News