
Application of Laser Particle Size System in Pesticide Industry
2021-07-27Application Note
| Product | Bettersizer ST, BeVision S1 |
|---|---|
| Industry | Agrochemical Analysis |
| Sample | Pesticide |
| Measurement Type | Particle Size, Particle Shape |
| Measurement Technology | Laser Diffraction, Static Image Analysis |
Abstract: The particle size distribution of pesticides directly affects the trajectory of particle movement, surface energy and adhesion. Optimizing the particle size distribution of pesticides in the formulation development process and monitoring the particle size distribution of pesticides in pesticide production have a great significance for improving product quality and stability. This paper mainly introduces the principle and characteristics of laser diffraction particle size analyzer and applies it to study the influence of different composition on the particle size distribution during the formulation development process. At the same time, the influence of different production process parameters on the particle size distribution during the production process of the preparation is investigated. The research results show that the laser diffraction particle size analyzer can not only optimize the component content in the formulation development, but also effectively monitor the particle size distribution of the pesticide in the process production to ensure the stability of product performance.
With the depletion of energy sources and the increasing awareness of environmental protection, the processing of pesticide formulations will play an invaluable role in the sustainable development of the pesticide industry and ecological environment protection. Generally, the pesticide is processed into EW, SC, SE, WP, MF, etc. The particle size dispersion of technical product of pesticide is too fine to decrease the residual effect period, accelerate the photodegradation speed and volatility, and is too coarse to affect the specific surface area and reduce the biological activity. The particle size distribution of the drug directly affects the dispersity of the preparation, the biological activity, the stability of the suspension and the coverage area, and has become an indispensable key control variable in the pesticide preparation and production process, so accurating particle size distribution is critical.
The particle sizing methods mainly include Coulter method, image method, electric resistance method, light scattering method, etc.
The laser diffraction particle size analyzer which has its unique advantages, such as fast measurement, low measurement limit, wide measurement range, good reproducibility, high sensitivity and high resolution, and has been widely used in the pesticide industry is recommended in the Chinese agricultural industry standard NY/T2886-2016, which has promoted the rapid development of pesticide formulation processing to a certain extent[1].

1.Experiment
1.1 Instrument
- Bettersizer ST Laser Particle Size System from Bettersize Instrument Ltd.
- BeVision S1 Image Particle Size Analyzer from Bettersize Instrument Ltd.
1.2 Sample and reagent
- Different kinds of pesticides
- Surfactant, deionized water, methyl oleate
2.Principle of laser diffraction particle size analyzer
A sample, dispersed at an adequate concentration in a suitable liquid or gas, is passed through the beam of a monochromatic light source, usually a laser. The light scattered by the particles, at various angles, is measured by multi-element detectors, and numerical values relating to the scattering pattern are recorded for subsequent analysis. These numerical scattering values are then transformed, using an appropriate optical model and mathematical procedure, to yield the proportion of the total volume of particles to a discrete number of size classes forming a volumetric particle size distribution (PSD). The laser diffraction technique for the determination of PSDs is based on the phenomenon that particles scatter light in all directions with an intensity pattern that is dependent on particle size. Figure 1 illustrates this dependency in the scattering patterns for two sizes of spherical particles. In addition to particle size, particle shape and the optical properties of the particulate material influence the scattering pattern.
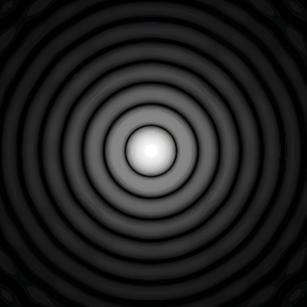
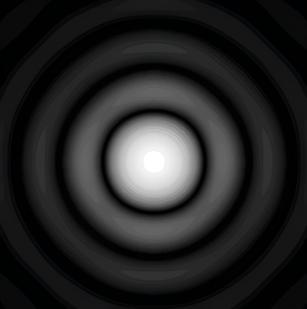
Figure 1. Scattering simulation of two spherical particles (Figure a. corresponds to a particle diameter twice as shown in Figure b.)
3.Measurement and results
3.1Application in the development of pesticide formulations
3.1.1Effect of xanthan gum content on particle size distribution of water emulsion
Low-mass concentration of xanthan gum can achieve good thickening performance and high viscosity characteristics that make it as an effective thickener [2]. The reasonable particle size distribution in formulation development depends on high quality formulations. In this experiment, the effects of different xanthan gum concentrations on the particle size distribution of 10% cypermethrin EW and 10% bifenthrin EW were studied by high-speed shearing machine and Bettersizer ST at room temperature, as shown in Figure 1. The results showed that with the increase of xanthan gum content, the D50 of the two emulsion systems first increased and then decreased, while the span first decreased and then increased. The D50 and span extreme points in the 10% bifenthrin system were 0.92 um, 1.20 um and 1.19, 0.31, and the corresponding xanthan gum contents were 0, 0.025% and 0, 0.075%.
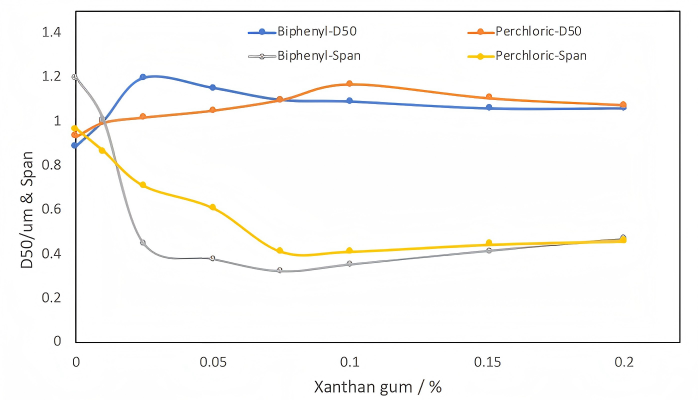
Figure 2. Curves of D50 and span variation of different xanthan gum content
Further investigate the effect of different xanthan gum contents on the viscosity of two aqueous emulsions. The viscosity-shear rate curve is shown in Figure 3. The results show that the two emulsion systems have shear thinning properties and belong to pseudoplastic fluids. The rheological property of the gum matches the two emulsion systems, so with the xanthan gum content increases, the viscosity of the aqueous emulsion system also increases accordingly. Comprehensive analysis of viscosity and particle size distribution, the optimal concentration is 0.075%, which will play a guiding role in the optimization of future water emulsion formulations.
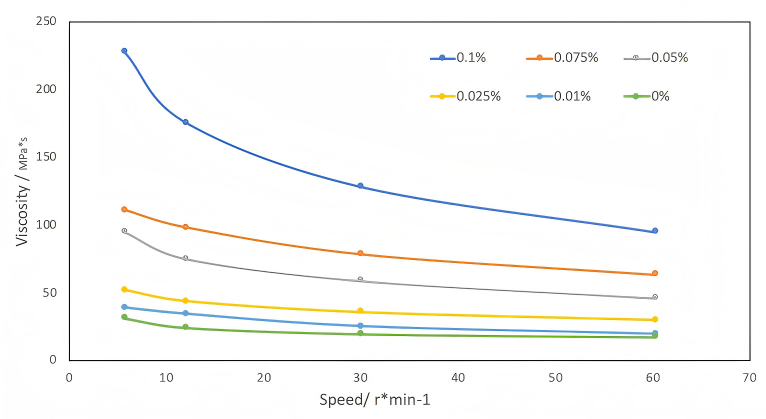
Figure 3. Variation of viscosity of water emulsion with different xanthan gum content
3.1.2Effect of filler on particle size distribution of suspension concentrate
The suspension concentrate is a solid pesticide which is hardly soluble in water and stably dispersed in water with particles size smaller than 5um. The particle size and particle size distribution of the suspension concentrate directly affect the suspension rate and stability. Generally, the smaller the particle size, the more uniform the distribution and the suspension. The higher the suspension rate, the smaller the delamination rate, and the content and species of fillers, raw materials, wetting agents and dispersants have an important effect on the performance of the suspension. This experiment mainly investigated the suspension of three different formulations in water. The dispersed state and the characteristic particle diameter are shown in Table 1. The D50 of formula 2 is significantly smaller than formula 1 and 3, which means that it has better suspension and stability in water. Formula 1 has the largest particle size, more than 5um, and is susceptible to gravity to accelerate sedimentation and the storage stability.
Table 1. Characteristic particle size of suspending agents in different formulations
3.2Application in the development of pesticide production
3.2.1Effect of pressure on the particle size distribution of wettable powder
In order to ensure the high dispersion and uniform dispersion of the active ingredients, WP is generally processed by multiple mixing and pulverizing processes. In this experiment, the particle size distribution of WP under the pressure of 0.2MPa and 0.8MPa is mainly investigated. The characteristic particle size is shown in Table 2. Under the large shear pressure and collision of 0.8MPa, WP exhibits a finer particle size distribution, which proves that the laser diffraction particle size analyzer can effectively monitor the particle size distribution of products under different production processes and ensure the stability of product performance.
Table 2. Characteristic particle size of WP at different pressures
3.2.2Effect of different grinding time on the particle size of suspension concentrate
In this experiment, the effects of different milling time on the particle size distribution of SC were investigated. The characteristic particle size and cumulative particle size distribution curves are shown in Table 3 and Figure 4.
Table 3. Characteristic particle size of SC at different grinding time
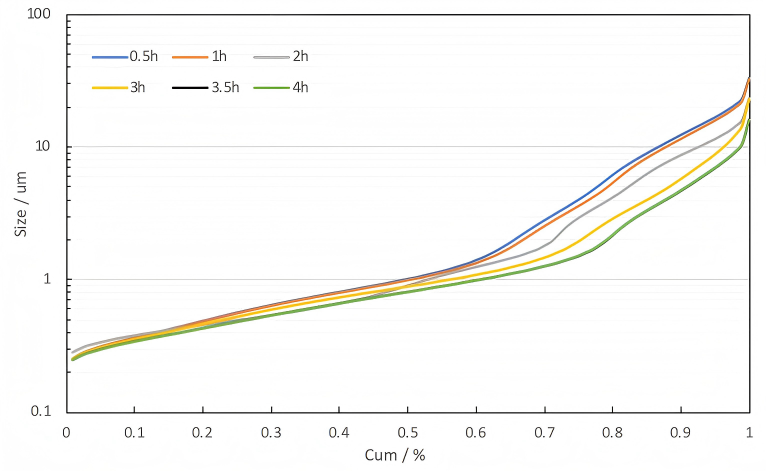
Figure 4. Cumulative particle size distribution curve of SC at different grinding times
It can be seen from Table 3 and Figure 1 that with the increase of grinding time, D50 gradually decreases from 1.015um to 0.814um in the interval of 0.5h-3.5h, and D90 gradually decreases from 12.39um to 2.721um; as the particles become smaller, the surface energy becomes larger and agglomeration is more likely to occur at 3.5h and 4h. Although in the absence of an effective dispersant, a finer particle size distribution cannot be obtained, so D50 and D90 hardly change significantly. BeVision S1 image particle size analyzer was used to observe the grinding time of 0.5h and 4h. As shown in Figure 2, it can be found that the coarse particles above 10um existed at 0.5h, and the particles changed obviously after the grinding time reached to 4h. From the above, the distribution of particles under different grinding time can be effectively monitored by the laser diffraction particle size analyzer, thereby ensuring the stability of the product performance.
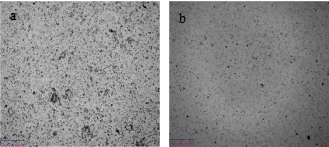
Figure 5. Image of SC under grinding time 0.5h(a) and 4h(b)
4.Conclusion
1) In the development of pesticide formulations, the laser diffraction particle size analyzer can effectively optimize the formula of the components to ensure best performance of pesticide.
2) In the process of pesticide products, the laser diffraction particle size analyzer can effectively monitor the product particle size distribution and ensure the stability of the product performance.
References
[1] Kippax P. Systematic method development for laser diffraction particle sizing [J]. American Laboratory, 2004, 36 (16): 20-23.
[2] Zhao Xiangyang, Zhang Jie, You Yuan. Study on rheological properties of drilling fluid xanthan gum[J]. NATURAL GAS INDUSTRY, 2007, 27 (3): 72–75.
LOGIN TO ACCESS EXCLUSIVE CONTENT
More Resources Including
- Application Notes & Collections
- Webinars & Workshops
- Presentations & Videos
- Monthly Newsletters
- Exclusive Events...

Recommended articles
Rate this article