Pesticide Particle Size Analysis: How to Obtain Reliable Results Across Formulations
2026-10-29News
Meaningful pesticide particle size results start with a method suited to the formulation. First define what you intend to measure, then control the dispersion medium, bubbles, and dispersion process. Interpreting a particle size distribution under clearly defined, consistent test conditions makes it more useful for formulation development and quality control.
Suspension concentrates, oil-in-water emulsions, and oil dispersions are different dispersed systems. In the laboratory, establishing a method suited to the sample is the starting point for understanding particle size data.
Why Does Particle Size Distribution Matter in Pesticide Development and Quality Control?
Particle size distribution describes how particle sizes are distributed within a sample and is an important part of pesticide formulation characterization. Particle size and distribution are associated with application properties such as uniformity and efficacy. Researchers and quality control teams can use particle size changes to inform their work, although a particle size report alone cannot establish field efficacy.
When comparing formulations or batches, we therefore recommend reviewing the full distribution alongside characteristic diameters such as D10, D50, and D90. Together, these reveal both the extent of a size change and the part of the distribution in which it occurs. Before comparing results, confirm that the reports use the same distribution basis and test method.
Start by Defining the Target: Solid Particles or Emulsion Droplets?
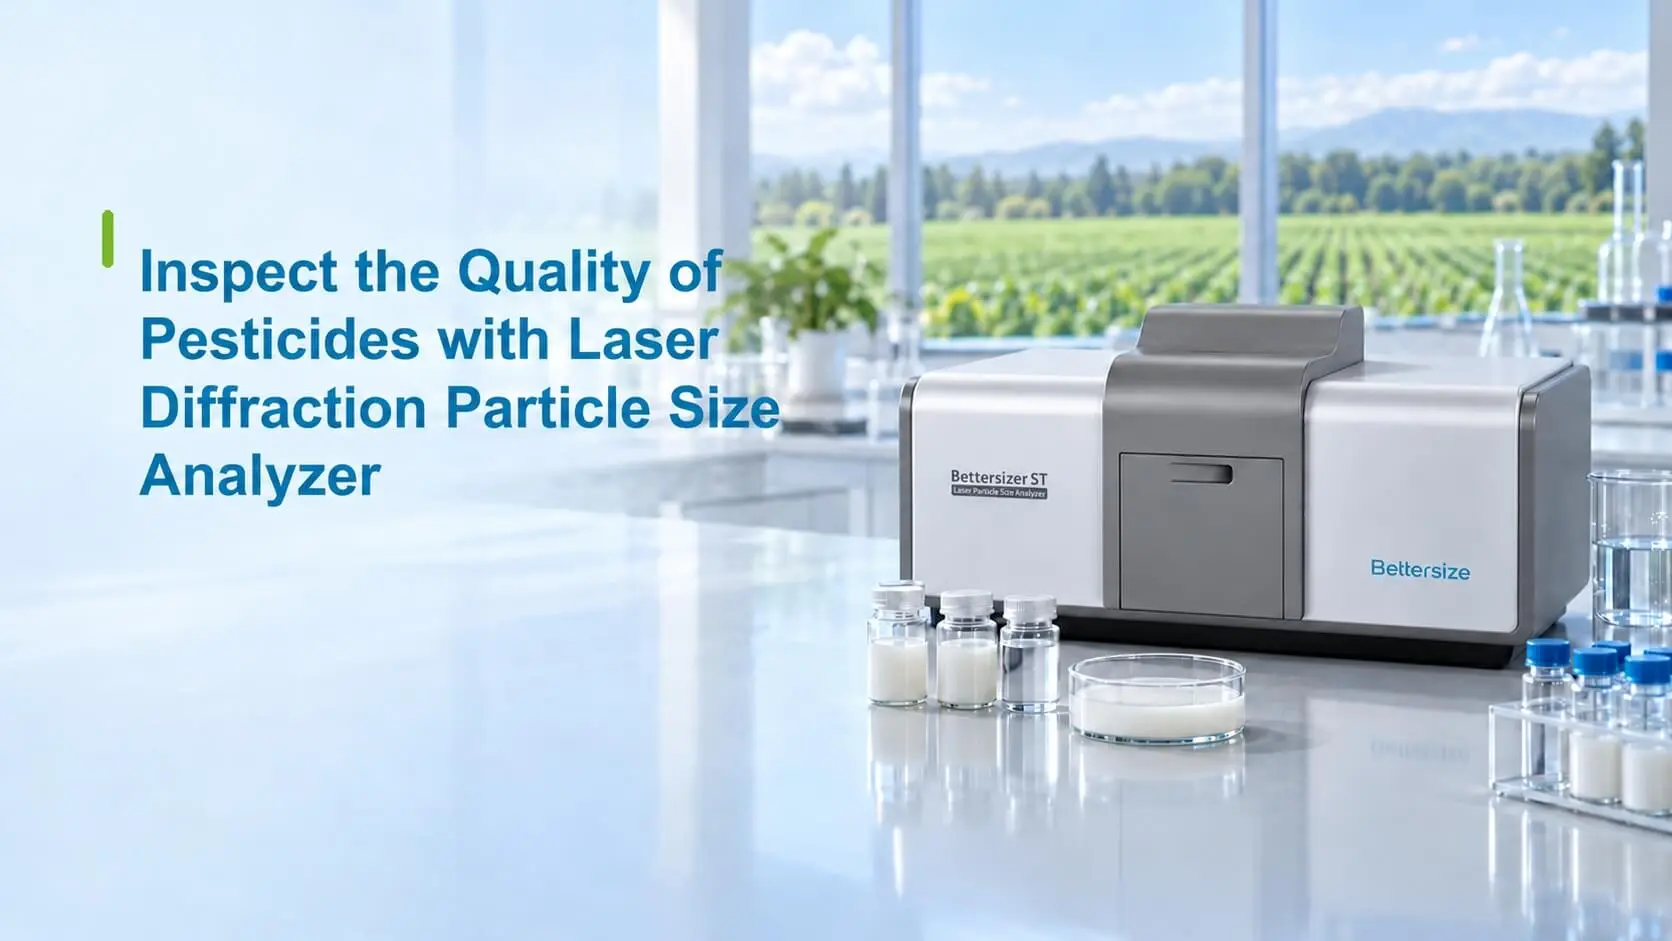
Laser diffraction analyzes light scattering signals and uses an optical model to calculate particle size distributions. It can characterize dispersed systems such as suspensions and emulsions. Sample preparation and measurement conditions need to reflect the measurement target and sample state.
Dispersing solid particles and preserving the state of emulsion droplets are separate tasks in pesticide analysis. Defining the question a measurement should answer helps guide sample preparation and gives the resulting distribution a clear basis for interpretation.
What Are the Testing Priorities for Six Common Pesticide Formulations?
Begin by identifying the measurement target and the main sources of interference for each formulation. The table below draws on Bettersize's testing experience to summarize practical considerations for six common formulation types.
|
Formulation |
Measurement target |
Key considerations |
Practical tips from Bettersize |
|---|---|---|---|
|
Suspension concentrate (SC) |
Solid particles |
Agglomeration after storage; adequate dispersion |
Use water as the dispersion medium. If a stored sample has agglomerated, approximately 1 min of ultrasonication can help disperse the agglomerates. |
|
Oil-in-water emulsion (EW) |
Emulsion droplets |
Remove bubbles while avoiding emulsion breakdown |
Use water to measure the droplets. Keep circulation speed below 800 rpm. Apply ultrasonication for approximately 1 min and do not exceed 3 min; excessive treatment may break the emulsion and alter the droplet state. If needed, use a small-volume sample cell, such as the BT-804, to reduce bubble formation. |
|
Oil dispersion (OD) |
Solid components |
Use the same diluent as in production; prevent dissolution of the target component |
Use the same diluent as in production and keep pump speed below 800 rpm. When using an oil-resistant pump, avoid internal ultrasonication; predisperse the sample externally with approximately 1 min of ultrasonication before loading it into the instrument. |
|
Wettable powder (WP) |
Solid particles |
Bubbles during wetting and dispersion |
Use water as the dispersion medium. Add the powder directly or predilute it, keeping dispersion time below 2 min. If bubbles occur, use a defoamer or brief ultrasonication. |
|
Water-dispersible granules (WDG) |
Solid particles after dispersion |
Predisperse; avoid excessive ultrasonication |
Use water as the dispersion medium. Predisperse the granules into a suspension, then add the sample with a pipette. Keep circulation speed below 800 rpm and ultrasonication time below 2 min to avoid particle breakage. |
|
Flowable concentrate for seed treatment (FS) |
Solid particles |
Solubility and the effect of pigment absorption on optical signals |
Use water as the dispersion medium. For samples with higher solubility, add sample until near saturation and ultrasonicate for approximately 1 min to disperse the solids. Absorption by blue or black pigments can produce obscuration of 30%–40% alongside a scattering intensity reading of approximately 5. High obscuration alone does not establish that the concentration is too high. |
The practical tips in the table are drawn from Precautions for Particle Size Analysis of Different Pesticide Formulations and provide a reference for method development. Confirm the dispersion medium, circulation speed, and ultrasonication conditions for the specific sample and dispersion system. For FS samples, the scattering intensity value of approximately 5 is an instrument reading reported in the source; no unit is specified.
Three Checks to Make Pesticide Particle Size Data More Useful
1. Is the Dispersion Medium Suitable for the Component Being Measured?
Select a dispersion medium with both the measurement target and sample compatibility in mind. If the target component dissolves during preparation, the measured distribution may no longer represent the particle state you intended to characterize. Assess the medium's effect during method development before comparing formulations.
2. Does the Dispersion Process Alter the Measurement Target?
Define the purpose of dispersion in advance. For dispersed solid particles, confirm that the treatment sufficiently breaks up agglomerates. For emulsion droplets, check whether the treatment changes the state of the emulsion. Use stepwise trials to observe changes in the distribution, then select conditions based on both the results and the sample state. Avoid choosing conditions simply because they produce a smaller particle size reading.
3. Do the Optical Signals Support Your Interpretation?
Obscuration describes how much the light beam is attenuated as it passes through the sample and helps assess measurement conditions. Review it alongside the scattering signal, sample color, and repeated measurements. For colored formulations in particular, deciding whether to add more sample or flag an abnormal result based on obscuration alone can overlook the effect of light absorption.
From a Single Measurement to Routine Quality Control
When a method will be used by different operators or to track batches over time, include the following four elements in the laboratory's standard operating procedure (SOP):
- Define the purpose: Specify the materials being compared, the measurement target, and the sample state.
- Confirm the method: Check medium compatibility and assess dispersion conditions and changes during measurement.
- Record the conditions: Document sampling, predispersion, sample addition, circulation, ultrasonication, and optical model settings.
- Compare consistently: Review distribution curves, characteristic diameters, and repeated measurements under consistent conditions.
This gives particle size reports a traceable experimental context. When R&D, production, and quality control teams discuss differences, they can first check method consistency and then identify changes that warrant further investigation.
From Particle Size to Stability: Choose a Bettersize Solution for Your Measurement Task
Different measurement tasks call for different types of information. The following Bettersize products support particle size, particle shape, and physical stability analysis:
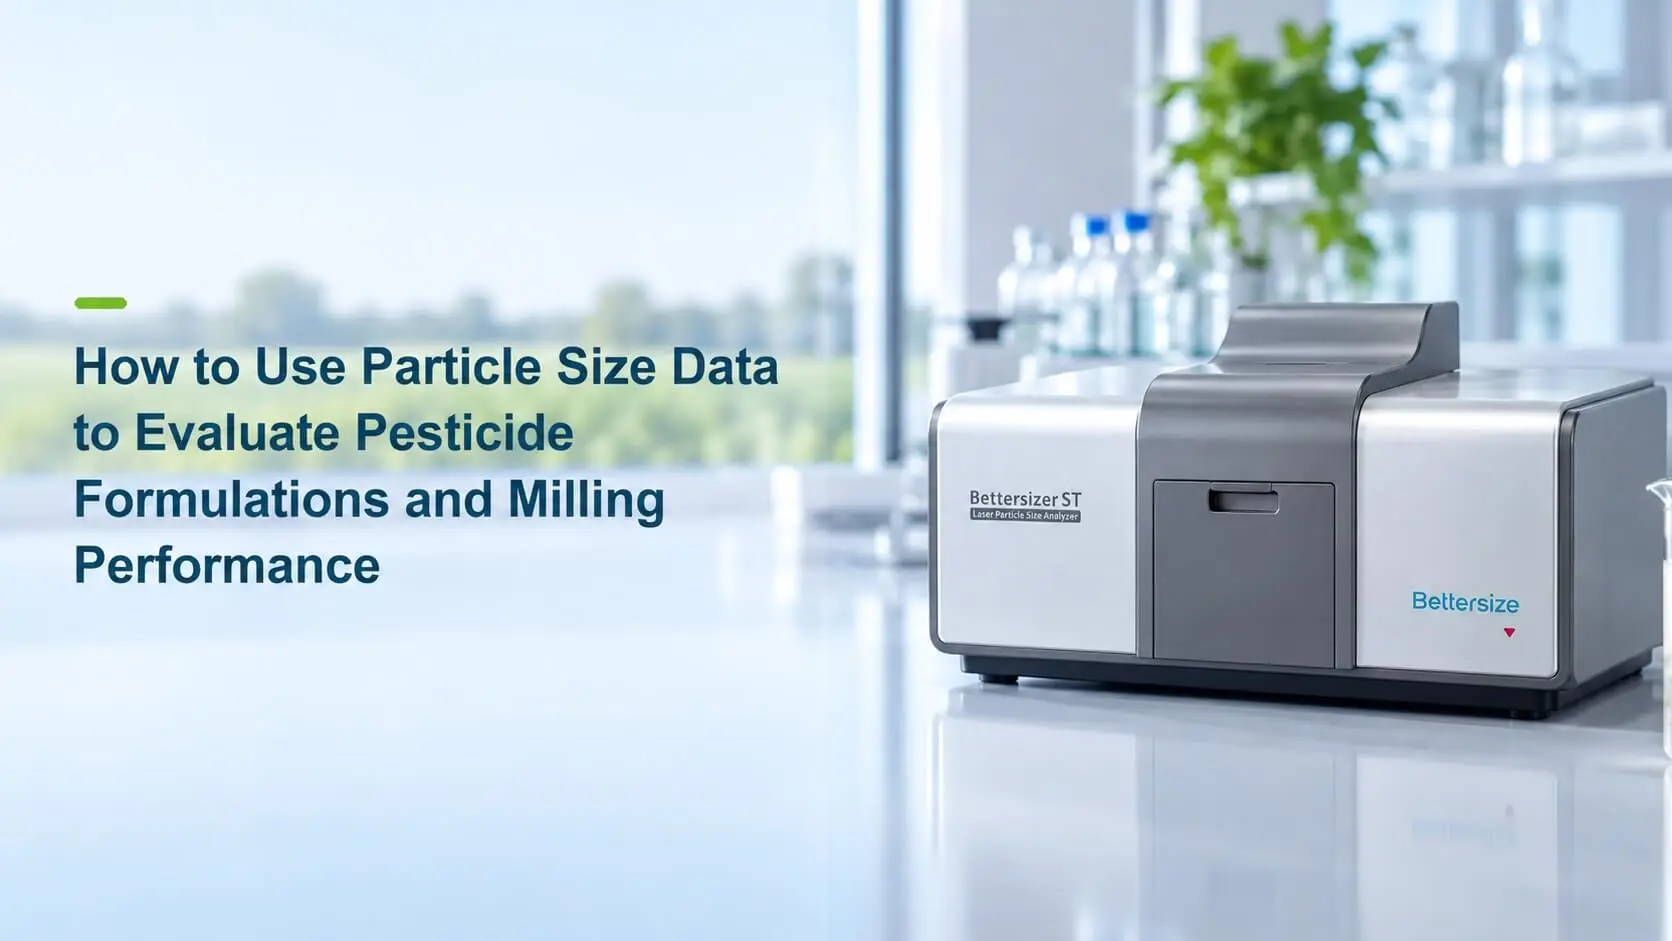
- Particle size QC and method development for common micron-scale formulations: Bettersizer Series laser diffraction particle size analyzers characterize size distributions to help compare particle size differences associated with dispersion, milling, or batches.
- Characterizing nanopesticides and microemulsions: BeNano Series nanoparticle size and zeta potential analyzers use dynamic light scattering to measure nanoscale particle size. Models equipped with zeta potential measurement provide additional information for comparing formulations in nanodispersions suitable for light scattering analysis.
- Visual investigation of particle morphology and coarse particles: BeVision Series particle size and shape analyzers use particle images to provide size and shape information and help examine the appearance of coarse particles. For wet samples, consider the BeVision S1, which supports wet measurements.
- Monitoring physical stability kinetics in undiluted formulations: BeScan Lab stability analyzers, such as BeScan Lab+, use static multiple light scattering to track changes in transmitted and backscattered light from undiluted samples within the applicable concentration range. These measurements help reveal sedimentation, separation, and other destabilization processes, supporting the assessment of physical stability during storage.
Combining particle size, morphology, and stability information helps address different development questions about the same formulation. Explore Bettersize's agrochemical analysis solutions and discuss sample suitability and instrument configurations with the team.
If you are developing a method for a particular formulation, submit your sample information through Bettersize's free sample testing page. Describe the formulation type, target component, and current challenges so the team can discuss your testing needs. Give your next pesticide particle size analysis a clearer starting point with a method suited to your sample.
Frequently Asked Questions
Why Should Pesticide Particle Size Testing Start with the Formulation Type?
Formulation types differ in their measurement targets and dispersion systems. Establishing whether the target is solid particles or emulsion droplets is the first step in selecting a medium and sample treatment method.
Does Longer Ultrasonication Make Particle Size Results More Reliable?
Ultrasonication time should be determined by the sample and measurement purpose. Treatment must balance adequate dispersion with preserving the intended sample state, and the conditions should be confirmed through method development trials.
Can Pesticide Particle Size Reports from Different Laboratories Be Compared Directly?
First check the measurement principle, sample preparation conditions, optical model, and distribution basis. Identical parameter names in two reports do not establish that the test methods are consistent.
Can D50 Alone Describe the Full Particle Size Distribution?
D50 is one characteristic value within a distribution and cannot describe the entire curve. Review it alongside D10, D90, and the full distribution to assess changes in the fine fraction, central region, and coarse fraction.
Can Particle Size Testing Directly Demonstrate Pesticide Efficacy?
Particle size testing provides information on particle dimensions and their distribution; it does not replace efficacy evaluation. Combine it with formulation, stability, and application test information to support development decisions.
What Information Should I Provide When Discussing Testing with Bettersize?
Provide the formulation type, sample state, target measurement parameters, expected size range, and any special handling requirements. The website's free sample testing form accepts sample and contact information, and the team will discuss the specific arrangements with you.
|
FURTHER READING / Lab Tips Want to explore this tip further? Read the original lab tip for the full experimental methods, data, and findings. Read the Original →Lab Tips |
 |
Rate this article
Share On


Recent News