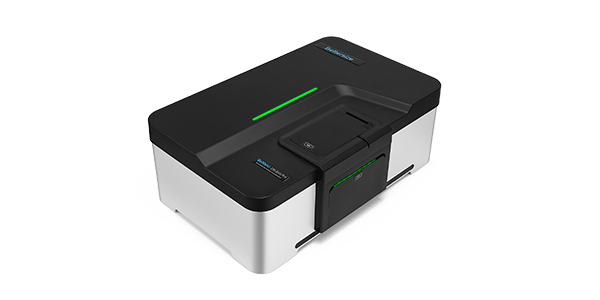
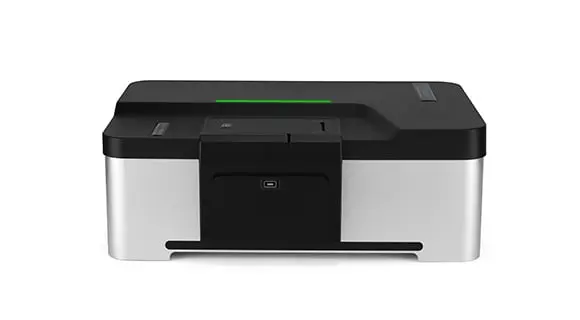
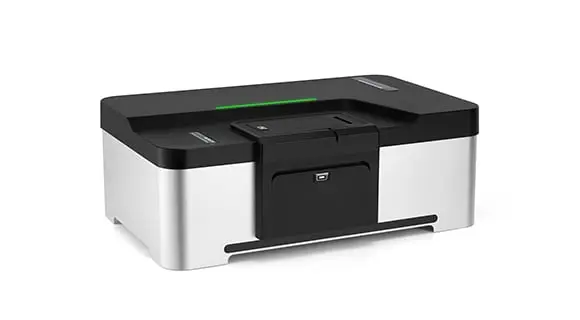
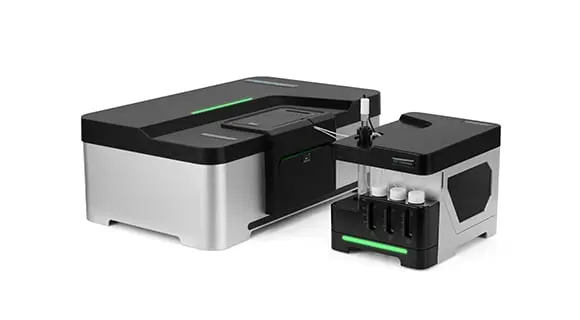
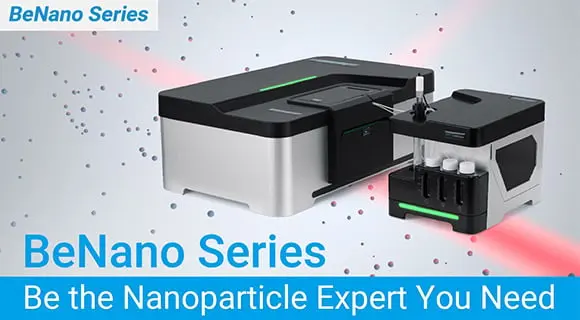
BeNano Series
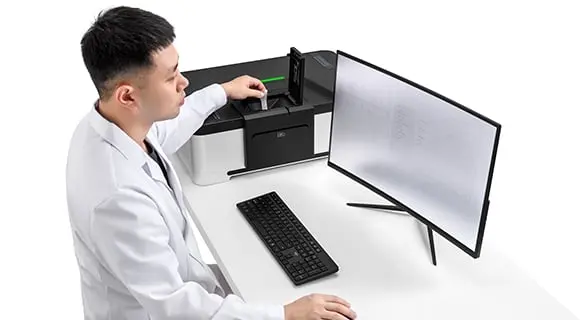
The BeNano series comprises seven models and represents a state-of-the-art generation of nanoparticle analyzers that integrate light scattering and transmission techniques. It provides precise measurements of particle size and concentration, zeta potential, molecular weight, refractive index, and rheological properties, all within a single compact system.
Features and Benefits
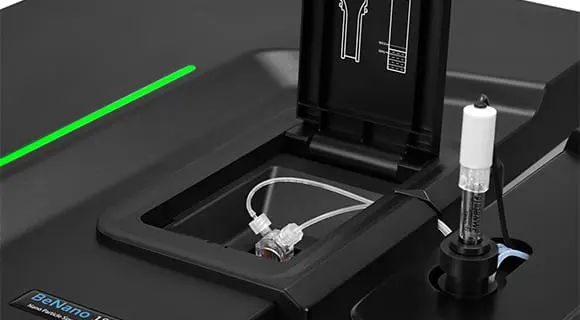
- ● Size range: 0.3nm - 15μm
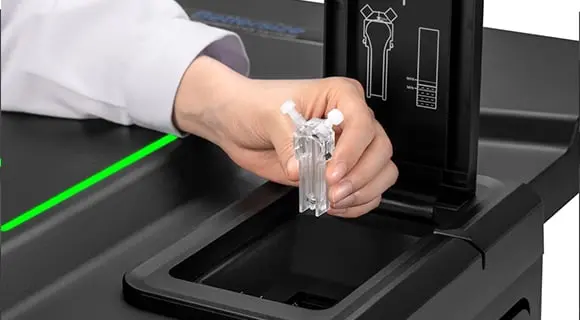
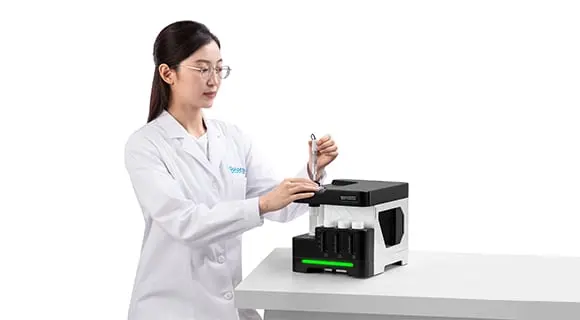
- ● Minimum sample volume: 3μL
- ● APD (Avalanche Photodiode) detector providing exceptional sensitivity
- ● Automatic adjustment of laser intensity
- ● Intelligent algorithm of result evaluation
- ● DLS backscattering (173°) detection technology
- ● User-adjustable scattering volume for concentrated samples
- ● PALS (Phase Analysis Light Scattering) technology
- ● Programmable temperature control system
- ● Compliance with 21 CFR Part 11, ISO 22412, ISO 13099

BeNano Series
Die BeNano-Serie ist die neueste Generation von Nanopartikel-Größen- und Zetapotenzial-Analysatoren, entwickelt von Bettersize Instruments. Dynamische Lichtstreuung (DLS), elektrophoretische Lichtstreuung (ELS) und statische Lichtstreuung (SLS) sind in das System integriert, um präzise Messungen der Partikelgröße, des Zetapotenzials und des Molekulargewichts zu liefern. Die BeNano-Serie wird in akademischen und industriellen Prozessen in verschiedenen Bereichen angewendet, einschließlich, aber nicht beschränkt auf: Chemieingenieurwesen, Pharmazie, Lebensmittel und Getränke, Farben und Pigmente sowie Lebenswissenschaften.