Pesticide Particle Size Analysis: Formulation and Milling Quality
2026-10-23News
Key Takeaways
Formulation screening: Review D10, D50, D90, and the full particle size distribution together. In our laboratory testing, Formulation 2 had a D90 of 3.106 μm, below the 5 μm settling-risk reference used in our testing.
Milling decisions: Tracking D50 and D90 revealed a particle size plateau after about 3.5 hours under the conditions tested. These results point to to the risk of fine-particle re-agglomeration, offering a practical clue for optimizing milling endpoints and dispersant systems.
A complementary characterization workflow: Use Bettersizer ST to monitor particle size during milling, BeVision S1 to inspect particle morphology and screen for coarse particles, and BeScan SMLS to track changes in the stability of the undiluted suspension. Together, these tools provide complementary information from process development to finished-product stability assessment.
Why Should Pesticide Quality Control Consider the Full Particle Size Distribution?
D50 is the particle size at the 50% point of the cumulative size distribution, while D10 and D90 correspond to the 10% and 90% points. D50 helps compare the distribution’s median position; D10 and D90 add information about its fine and coarse ends. Reviewing these values alongside the full distribution curve helps R&D and QC teams identify changes in the center, tails, and overall shape, then compare the results with formulation targets and process records. For more on D50, see the Bettersize Wiki entry on D50.
Active ingredient particles must balance size reduction with application performance. Particles that are too fine may undergo faster photodegradation and volatilization, shortening the residual efficacy period; particles that are too coarse have less surface area and may reduce biological activity. Spray droplets have their own coverage requirements: droplets that are too large may roll off crop leaves, while very fine droplets are more prone to wind drift. Active ingredient particles and spray droplets are different targets, so each should be evaluated against its own application objectives.
How Do Three Formulations Differ in Their Characteristic Particle Sizes?
In the first suspension concentrate (SC) test, we compared three formulations containing the same active ingredient particles but different wetting and dispersing agents. Our testing uses 5 μm as a practical reference for discussing settling risk: Formulation 1 had a D90 of 5.921 μm, above this reference, suggesting that its coarse particle fraction may present a greater risk of settling and separation. Formulation 2 had a D90 of 3.106 μm and a D50 of 0.887 μm; all three of its characteristic sizes were lower than those of Formulations 1 and 3. Under the conditions tested, Formulation 2’s wetting and dispersing system produced a finer distribution, making it a candidate for further evaluation alongside suspension behavior and storage targets.
Table 1. Characteristic particle size values by formulation.
|
Formulation |
D10 (μm) |
D50 (μm) |
D90 (μm) |
|---|---|---|---|
|
Formulation 1 |
0.810 |
2.766 |
5.921 |
|
Formulation 2 |
0.353 |
0.887 |
3.106 |
|
Formulation 3 |
0.672 |
1.739 |
4.730 |
How Can Particle Size Data Track SC Milling Progress?
In a separate milling-time comparison, extending milling from 0.5 to 4 hours reduced D50 from 1.015 μm to 0.812 μm and D90 from 12.39 μm to 4.749 μm. D10 remained between 0.344 and 0.375 μm across the measured time points. Reviewing the full distribution curve alongside these values shows how the median and coarse end changed, instead of relying on milling time alone.
Table 2. Characteristic particle size values at each milling time.
|
Milling time (h) |
D10 (μm) |
D50 (μm) |
D90 (μm) |
|---|---|---|---|
|
0.5 |
0.365 |
1.015 |
12.39 |
|
1 |
0.363 |
0.982 |
11.25 |
|
2 |
0.375 |
0.893 |
8.623 |
|
3 |
0.354 |
0.886 |
5.772 |
|
3.5 |
0.345 |
0.814 |
4.721 |
|
4 |
0.344 |
0.812 |
4.749 |
The final milling interval is especially informative. From 3.5 to 4 hours, D50 changed from 0.814 μm to 0.812 μm, while D90 rose slightly from 4.721 μm to 4.749 μm. The results indicate a plateau in this sample set. The milling results are consistent with a risk of colloidal re-agglomeration: as particles become finer, their specific surface area and surface energy increase; if the system approaches its isoelectric point (IEP) and there is not enough free dispersant to cover the newly exposed surface, fine particles may re-agglomerate. For these conditions, 3.5 hours is a useful endpoint to evaluate. Extending milling may not produce a finer distribution and can add energy use and grinding-media wear. If a finer target is needed, the dispersant system should be evaluated alongside milling time.
We also used the BeVision S1 image particle size analyzer to observe samples milled for 0.5 and 4 hours. Images of the 0.5-hour sample showed coarse particles larger than 10 μm, while the 4-hour sample appeared visibly finer. These images complement the laser diffraction results, allowing the milling trend to be examined through both distribution data and particle appearance.
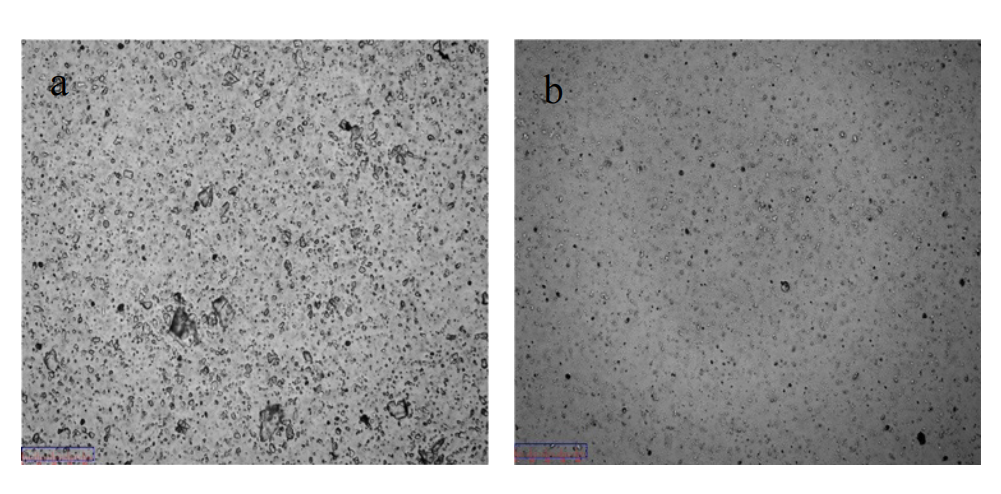
Figure 1. BeVision S1 images of SC samples milled for 0.5 and 4 hours.
How Does the Bettersizer ST Support Pesticide R&D and QC?
Bettersizer ST is a laser diffraction particle size analyzer with a DLOS dual-lens optical system and a measurement range of 0.1–1,000 μm. It was used to measure particle size distributions in the SC samples described here. Its automatic wet dispersion unit transports, circulates, and disperses samples. SOP-based automatic measurement can save and reuse test parameters and workflows, supporting routine comparisons using an established method. Measurement methods should be optimized for the sample and target distribution. Learn more about Bettersizer ST.
If you are developing a particle size evaluation method for pesticide suspensions, prepare your sample information, formulation or milling conditions, and testing objectives. Submit a request through Bettersize’s Free Sample Testing service to discuss a suitable test plan with our application team.
Frequently Asked Questions
Why review D50 and D90 together when evaluating a pesticide suspension?
D10, D50, and D90 correspond to the 10%, 50%, and 90% points of the cumulative particle size distribution. D50 indicates the median position, while D90 adds information about the coarse end. Together with the full distribution curve, they help show whether the center and coarse fraction are changing in step and can draw attention to coarse particles that may affect settling risk.
Does a smaller D50 always mean a better formulation?
No. Particles that are too fine may photodegrade and volatilize faster, shortening residual efficacy. Excessive milling may also bring the system closer to its IEP; if dispersant coverage is insufficient, fine particles may re-agglomerate. Formulation screening should therefore consider D10, D50, D90, the full distribution curve, and the intended application. Formulation 2 was finer in this formulation comparison, but suitability should be assessed against the formulation’s targets and stability evaluation.
How can particle size data help assess milling progress?
Comparing D50, D90, and the full distribution over time shows how the median and coarse end change. In our milling comparison, D50 was nearly unchanged and D90 increased slightly from 3.5 to 4 hours, indicating a plateau in this sample set. These results point to to re-agglomeration risk. The 3.5-hour point is worth evaluating as a potential endpoint under these conditions; if a finer target is still required, consider the dispersant system as well as milling time.
How can the storage stability of a pesticide suspension be evaluated?
Use Bettersizer ST to control particle size during milling, then pair it with the BeScan Static Multiple Light Scattering (SMLS) analyzer. BeScan measures the undiluted SC product directly and can track early sedimentation, syneresis, and flocculation kinetics. Together, the instruments provide complementary particle size and stability information for a more complete formulation and process assessment.
How can I request free testing for a pesticide sample?
Submit your sample information and testing objectives through Bettersize’s Free Sample Testing page, then discuss the testing plan with our application team
|
FURTHER READING / APPLICATION NOTE Want to see the full experimental parameters, PSD curves, and repeatability data tables? Read the original application note for the full experimental methods, data, and findings. Read the Original →Pesticide · Laser Diffraction · Particle Size Distribution |
 |
Rate this article
Share On


Recent News