D10, D50, D90 Reporting: Particle Size Analyzer Best Practices
2026-07-22News
Imagine two powder samples that share exactly the same median particle size. At first glance, they appear identical. In production, however, one flows smoothly while the other generates excessive dust, clogs equipment, or produces inconsistent products. The difference between them lies in particle distribution rather than just the median particle size. To capture such variations, laboratories report D10, D50, and D90, the particle diameters below which 10%, 50%, and 90% of the sample volume are found. Together, these metrics provide a far more complete picture of particle size distribution. A particle size analyzer generates them efficiently, provided the sample has been prepared and dispersed using methods suited to its physical characteristics.
The Distribution Metrics: D10, D50, and D90
Before interpreting results from a particle size analyzer, it is important to consider what each distribution parameter represents. D10, D50, and D90 describe the spread of particle sizes within a sample and reveal information that a single average value cannot provide.
|
D10
|
D10 (The Fine End): The diameter below which 10% of the sample volume exists. Manufacturers monitor this value to evaluate dust generation during powder handling, dissolution rates for pharmaceutical ingredients, and powder packing efficiency in tablet compression. |
|
D50
|
D50 (Median Particle Size): The particle diameter at which 50% of the cumulative sample volume consists of smaller particles. It serves as the primary reference for routine quality control and production monitoring. |
|
D90
|
D90 (The Coarse End): The diameter below which 90% of the sample volume falls. This parameter helps identify oversized contaminants, incomplete milling in mineral processing, or large agglomerates that may block spray nozzles or interfere with battery electrode production. |
Looking at D50 alone can conceal important process changes. A batch may maintain the same median particle size even though the proportion of fine or coarse particles has shifted enough to affect product performance, stability, or manufacturing efficiency. Evaluating D10, D50, and D90 collectively allows laboratories to monitor changes across the entire particle size distribution, establishing a more reliable basis for quality control and process optimization.
Dispersion and Measurement Best Practices by Sample Type
|
1
|
Dry, Free-Flowing Coarse PowdersMinerals, ceramic powders, and abrasives generally disperse easily, but representative sampling is still essential for accurate particle size analysis. Larger particles naturally separate from finer material during storage and transport, so using a rotary riffler before measurement helps preserve the original particle size distribution. Once a representative sample is secured, dispersion pressure can then be optimized by gradually increasing air pressure from approximately 0.5 bar to 4.0 bar until D50 and D90 stabilize. After both values reach a consistent plateau, the selected pressure is sufficient to separate agglomerated particles and avoid breaking fragile grains into smaller fragments. |
|
2
|
Cohesive and Micron-Scale PowdersBattery cathode materials, pigments, and active pharmaceutical ingredients (APIs) pose unique analytical challenges because strong surface forces encourage particles to form agglomerates. Consequently, measured particle size distributions often reflect clusters of particles instead of the primary particles themselves. Wet dispersion addresses this by combining a compatible surfactant with controlled ultrasonication. The surfactant improves particle wetting and allows the dispersing liquid to penetrate agglomerates more effectively, while ultrasonication provides the mechanical energy needed to separate individual particles. Throughout the process, D10, D50, and D90 should be monitored continuously, with results recorded only after D90 stabilizes, confirming complete de-agglomeration without promoting re-agglomeration. |
|
3
|
Liquid Emulsions and SuspensionsPrinting inks, agricultural crop protection formulations, and emulsified chemical products demand measurement conditions that preserve droplet or particle integrity over the course of the analysis. A chemically inert carrier liquid prevents suspended particles from dissolving and emulsion droplets from coalescing before analysis. Meanwhile, careful dilution keeps optical obscuration between 5% and 15%. Laser light is less likely to undergo multiple scattering in this range before reaching the detector, preventing artificially low D10 and D50 values and ensuring the reported particle size distribution accurately represents the sample. |
Overcoming Human Error Through Automation
Reliable particle size analysis depends on repeatable laboratory procedures as much as instrument performance. Variations in sampling, cleaning, dispersion time, or measurement settings introduce unnecessary differences between operators, particularly for sensitive parameters such as D10 and D90. Pre-programmed Standard Operating Procedures (SOPs) enable standardized workflows, reducing operator-dependent variability and improving reproducibility across laboratories.
Some materials, such as pigments and mineral samples, also benefit from combining complementary analytical techniques. A particle size analyzer using laser diffraction rapidly measures volumetric particle size distributions, while integrated dynamic image analysis provides visual confirmation of individual particles. When an unusually high D90 value appears, image data supports differentiation between a genuine oversized particle, a temporary agglomerate, or an irregular crystal, allowing laboratories to interpret results with greater confidence.
Delivering Consistent Particle Size Data
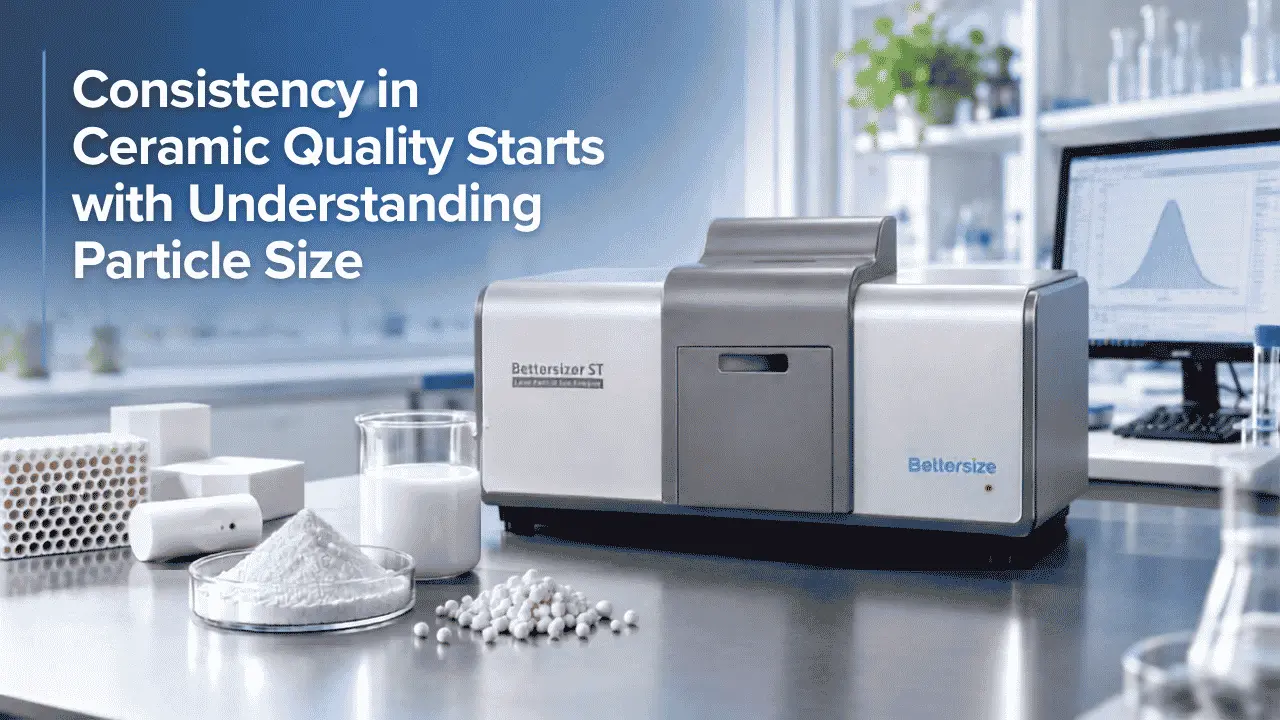
Every sample presents a different analytical challenge, which is why accurate particle size reporting can never rely on a one-size-fits-all approach. Representative sampling, effective dispersion, and proper measurement all influence the reliability of D10, D50, and D90. Bettersize Instruments has developed particle size analyzers to accommodate a wide range of materials and analytical requirements, including the Bettersizer 2600 Plus with wet, dry, and dynamic imaging capabilities; the Bettersizer S3 Plus for simultaneous particle size and shape analysis; and the Bettersizer ST for efficient routine wet testing. Speak to our specialists now for more information about our Bettersizer range and how it can help you achieve dependable, reproducible particle size data.
Rate this article
Share On


Recent News