Consistency in Ceramic Quality Starts with Understanding Particle Size
2026-09-17News
Ceramic performance depends on both raw material properties and processing conditions. Sintering conditions, dispersion state, and powder particle size distribution can all influence the final product, so particle size distribution is a key raw-material parameter to monitor in ceramic production.
In routine QC, particle size analysis is most useful when it supports comparisons between samples and batches. A single value such as D50 rarely describes the whole distribution.
From D10, D50, and D90 to the full distribution
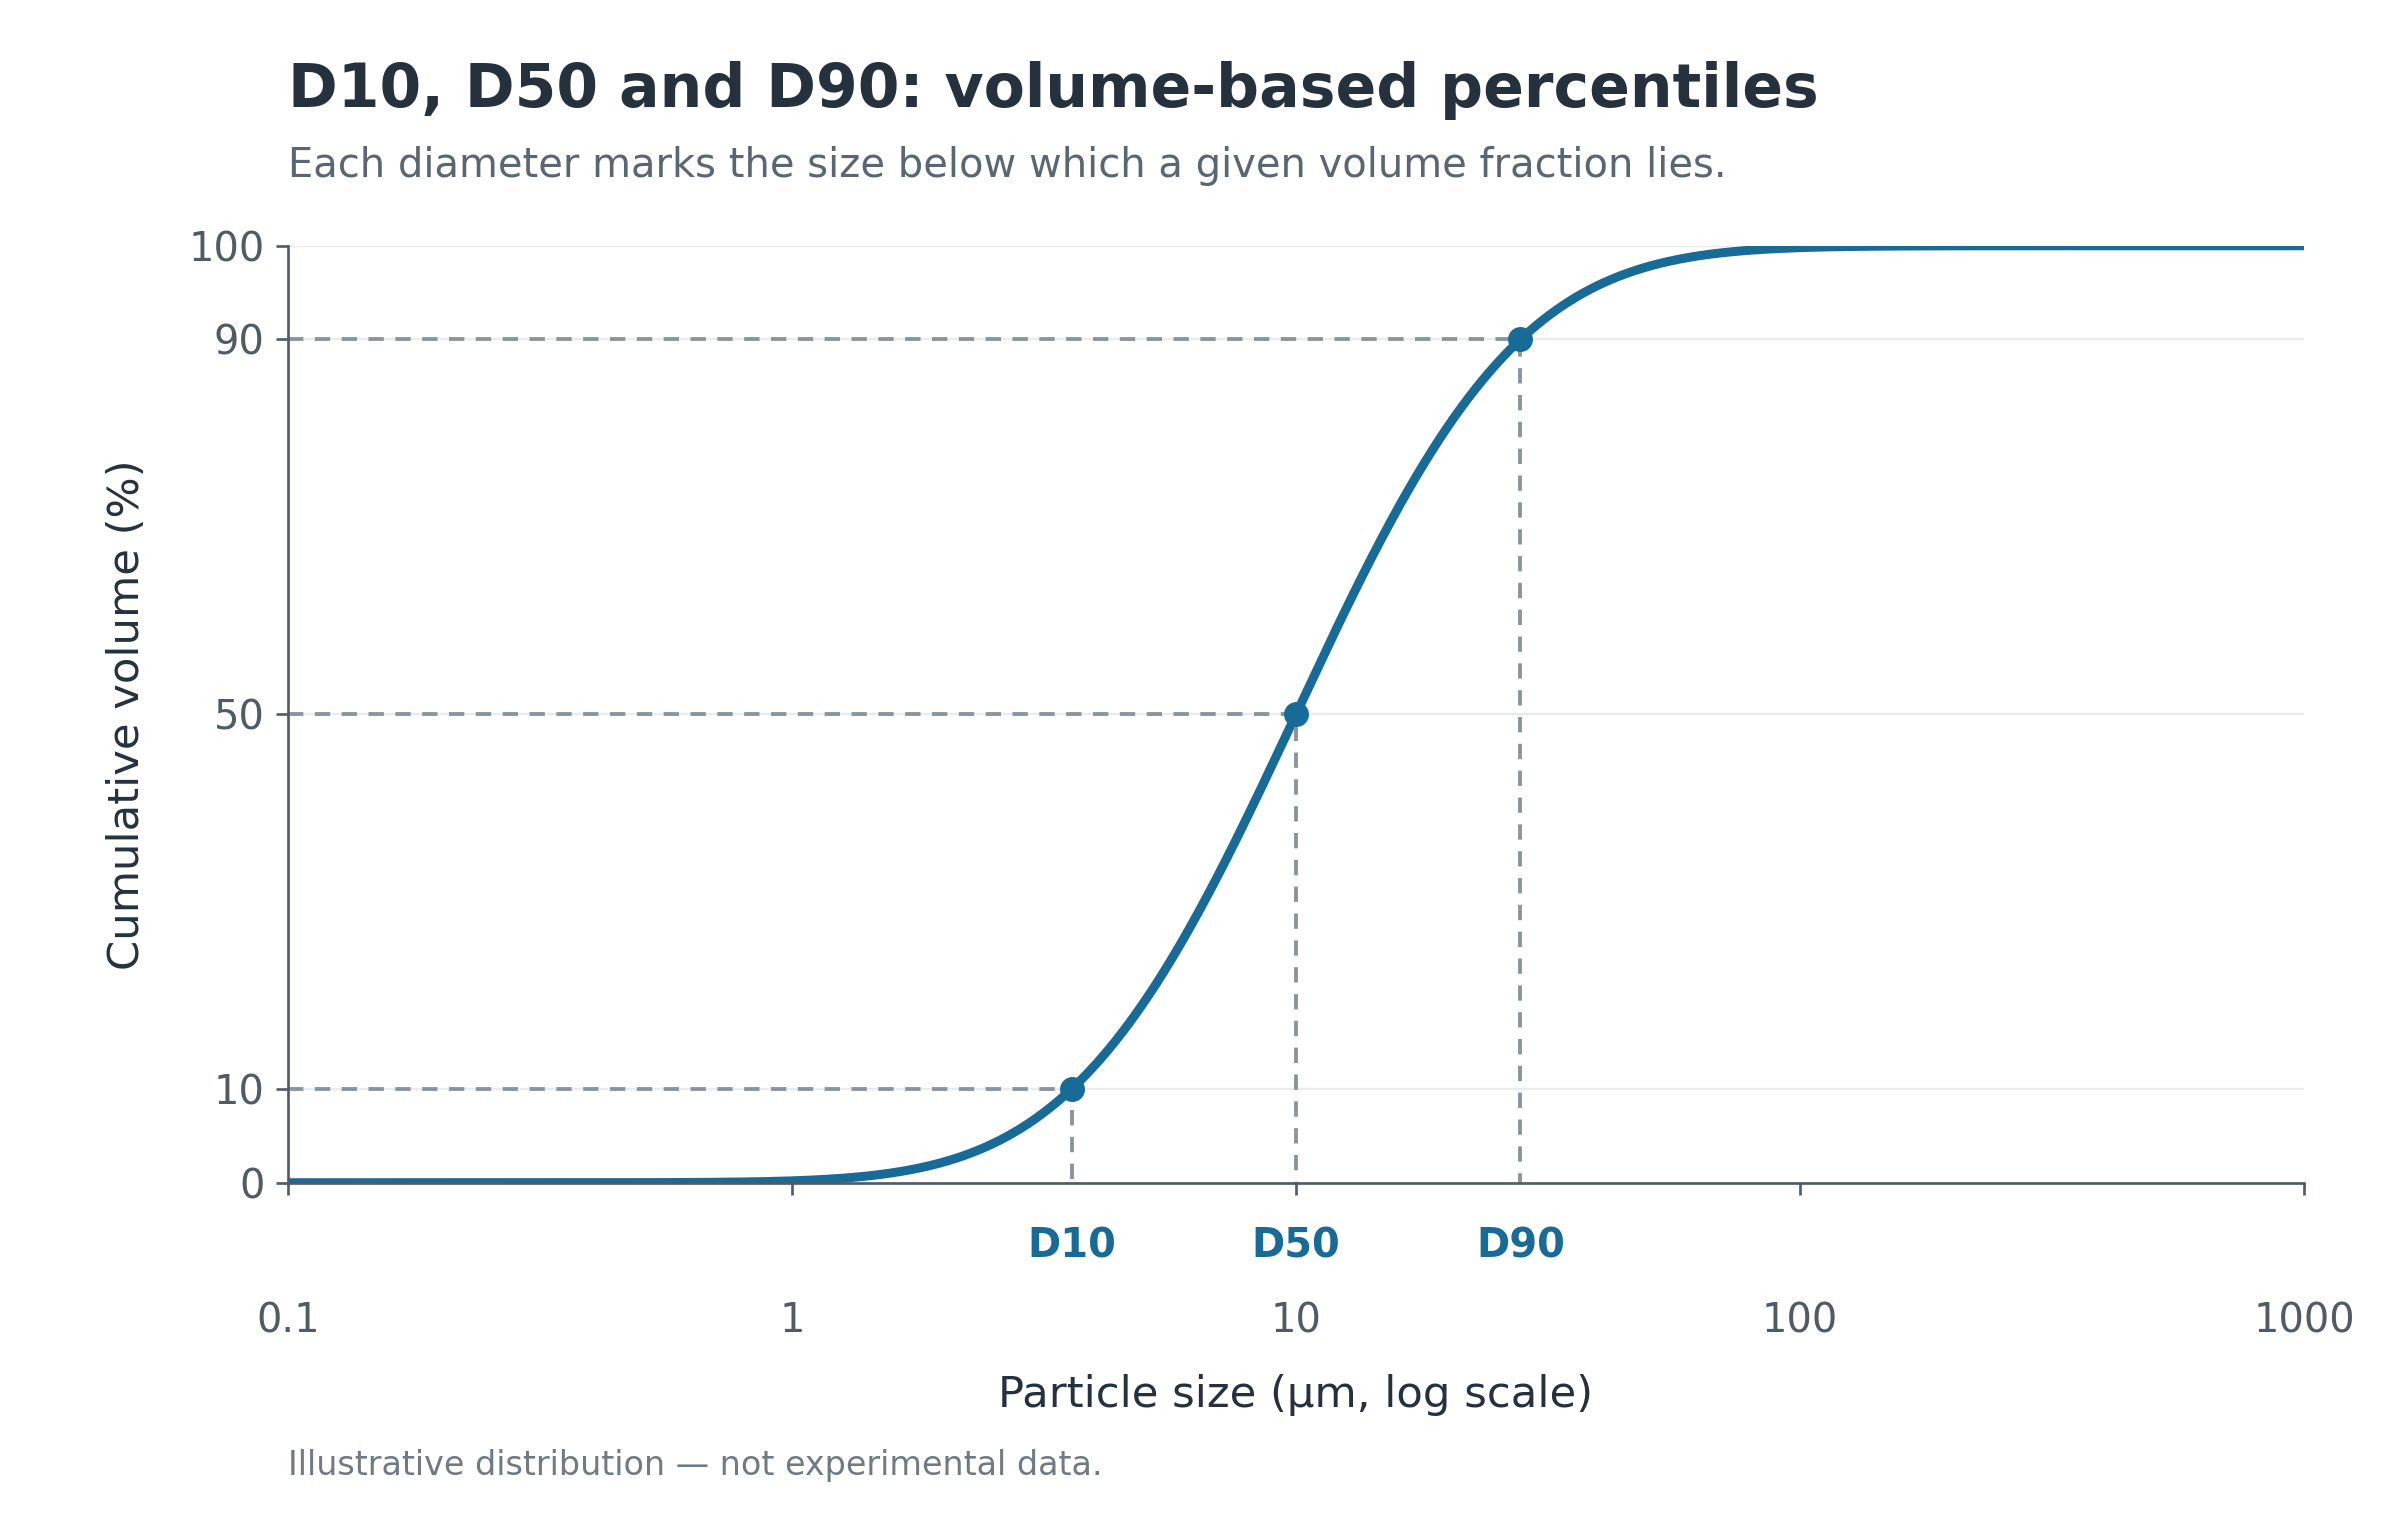
In a volume-based particle size distribution, D10, D50, and D90 are the particle sizes below which 10%, 50%, and 90% of the cumulative particle volume falls. D50 is widely used as a characteristic size, but it does not describe the full distribution.
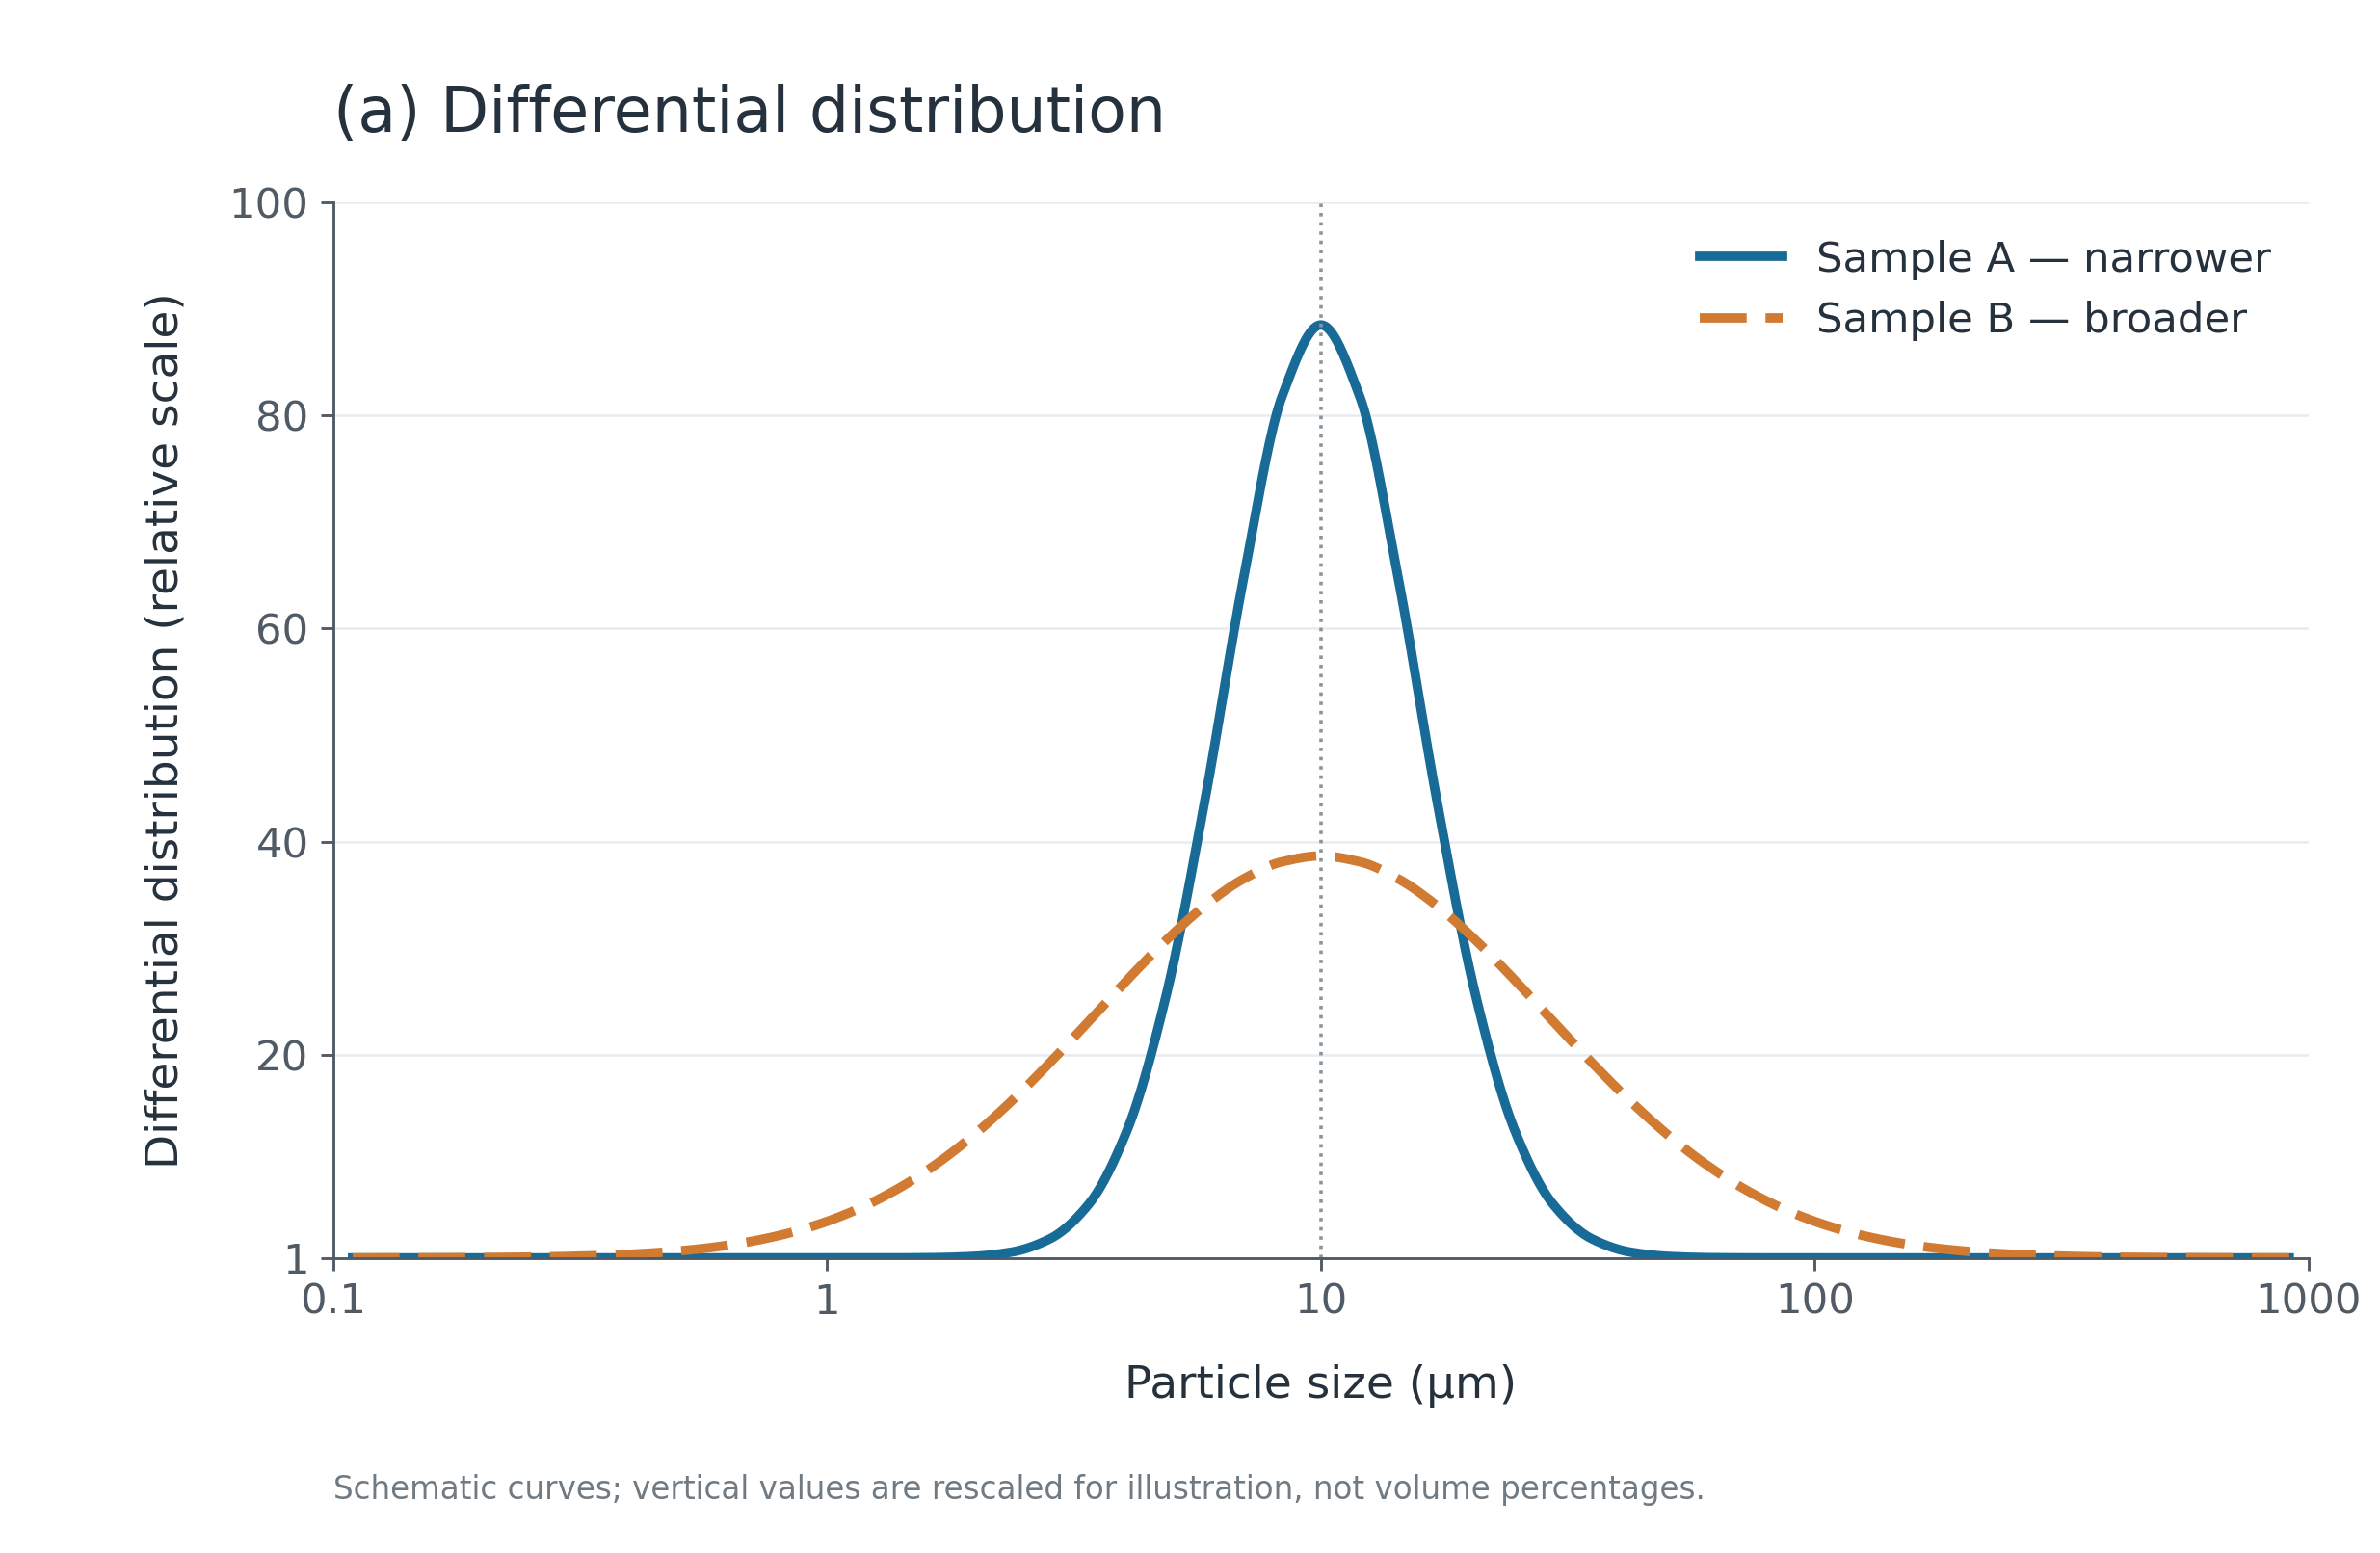
Two samples can have similar D50 values yet differ at the fine or coarse end, in distribution width, or in overall curve shape. For ceramic powders and slurries, D10, D50, D90, and the full distribution curve should be read together to show where the samples differ.
Compare samples using the full particle size distribution
Bettersizer ST reports the full particle size distribution together with characteristic sizes such as D10, D50, and D90. These results provide a consistent basis for comparing samples and batches in routine QC. For ceramic powders and slurries, results should be interpreted only under confirmed sample-preparation and dispersion conditions.
Track particle size across process stages
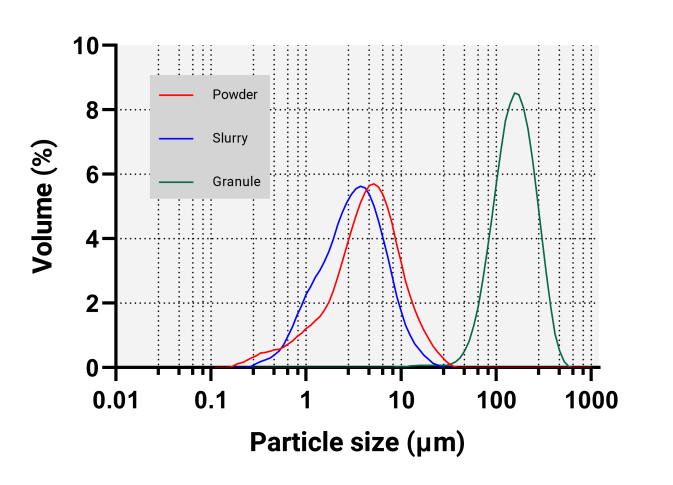
Alumina may be tested as powder, slurry, or granules at different points in production. Wet milling can produce a slurry from powder, while spray drying can produce granules from agglomerated fine particles. Because each stage has a different measurement target, particle size results need to be read in the context of the sample state and the purpose of the process step.
In this test, Bettersizer ST measured three commercially purchased alumina samples. The granule sample was distributed at larger particle sizes. The powder and slurry distributions were close, but still distinguishable, with the powder slightly coarser.
For routine QC, separate comparison baselines can be established for raw powder, milled slurry, and granules, then used to track batch changes under consistent test conditions. Because the three materials in this test were commercially purchased samples, the results compare sample forms; they are not a quantitative before-and-after study of one batch moving through consecutive process stages.
Repeatability comes before batch comparison
Before comparing batches or process stages, establish how much the same sample varies across repeated measurements. In five repeated measurements of the alumina granule sample, D50 ranged from 146.6 to 149.1 µm, and the five distribution curves closely overlapped. The reported repeatability values for D10, D50, and D90 were 0.65%, 0.67%, and 0.53%, respectively.
In routine QC, this baseline helps separate normal measurement variation from changes that may require a repeat test or further investigation. Repeatability should be confirmed for other ceramic samples under their own dispersion conditions and test methods.
Build a test method that can be repeated
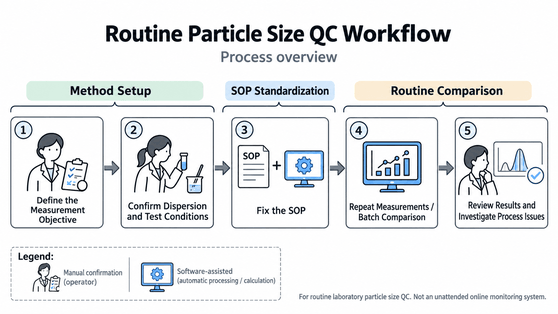
Define the measurement objective before using particle size analysis for routine QC. Powders and slurries generally need suitable circulation and ultrasonic conditions to reach a stable dispersion. With granules made from agglomerated fine particles, first decide whether the measurement should represent the intact granule or the dispersed primary powder. That choice affects the medium, circulation, and ultrasonic settings. Repeat measurements can show that a method is stable under defined conditions, but the particle state represented by the result still depends on the method. Confirm the dispersion and test conditions for the sample and measurement objective, then fix the key parameters for routine use.
Use SOPs to keep routine testing consistent
- Standardize the method: include confirmed steps such as medium supply, bubble removal, automatic alignment, background measurement, circulation and ultrasonic dispersion, particle size measurement, result saving, drainage, and automatic cleaning in the SOP. This reduces repeated setup between operators and batches.
- Measure quickly: Bettersizer ST has a typical measurement time of <10 s. This figure applies to the measurement step only; the total test cycle still depends on sampling, sample preparation, dispersion, and cleaning.
- Manage cleaning: cleaning can run after measurement with configurable cleaning cycles, drainage time, and cleaning circulation speed, so cleaning requirements remain part of the defined method.
- Review results: the software reports particle size distribution curves, data tables, and characteristic sizes such as D10, D50, and D90. Custom report templates and PDF/Excel output support incoming-material comparison, in-process checks, and result review.
Use particle size data as part of the quality decision
Particle size control in ceramics does not mean making every material as fine as possible, and powder, slurry, and granules should not share one acceptance criterion by default. Define the measurement target and particle size requirement for each process stage, compare changes with a consistent method, and interpret them alongside downstream process requirements and finished-product testing.
The alumina test shows how Bettersizer ST characterizes the particle size distributions of powder, slurry, and granules and how the granule sample performs in repeated measurements. With confirmed dispersion conditions, SOPs, and result management, particle size analysis can support incoming-material comparison, in-process checks, and result review. It informs quality decisions but does not replace finished-product performance testing.
When developing a particle size method for ceramic powders, define the process stage, the particle state to be measured, and the size range to be controlled. Then use representative samples to confirm the dispersion and measurement conditions. The Bettersize application team can use this information to discuss a test approach for routine QC.
FAQ: Ceramic Particle Size Analysis
1. Why monitor particle size distribution in ceramic quality control?
Particle size distribution is a raw-material quality parameter that can influence ceramic performance together with factors such as dispersion state and sintering conditions. It is useful for comparing similar samples and tracking batch changes, but it does not replace finished-product performance testing.
2. Is D50 enough to evaluate the particle size of a ceramic powder?
Usually not. D50 describes the median of the distribution, but samples with similar D50 values can still differ at the fine end, the coarse end, in distribution width, or in curve shape. D10, D50, D90, and the full particle size distribution curve should be evaluated together.
3. How should particle size results for alumina powder, slurry, and granules be interpreted?
Each sample form can represent a different process stage and measurement objective. In the BT020 test, commercially purchased alumina granules were distributed at larger particle sizes, while the powder and slurry were closer in size. The results compare different sample forms; they are not a before-and-after measurement of one batch moving through successive process steps.
4. Why confirm dispersion conditions before testing ceramic particle size?
Wet particle size results depend on how the sample is dispersed. Powders, slurries, and granules can require different media, circulation, and ultrasonic settings depending on the measurement objective. Those conditions should be confirmed during method development rather than applying one parameter set to every sample.
5. How does Bettersizer ST support routine QC for ceramic samples?
After a method is confirmed, SOPs can save and reuse test parameters and workflow steps. Automatic alignment, wet circulation dispersion, automatic cleaning, and reporting then support consistent routine testing. The typical measurement time is <10 s for the measurement step; it does not include sampling, sample preparation, dispersion, or cleaning.
6. Can particle size analysis determine whether a finished ceramic product is acceptable?
No. Particle size data can support incoming-material comparison, in-process checks, and result review, but finished-product performance also depends on other material and process factors. Particle size results should be considered alongside process requirements and finished-product tests.
|
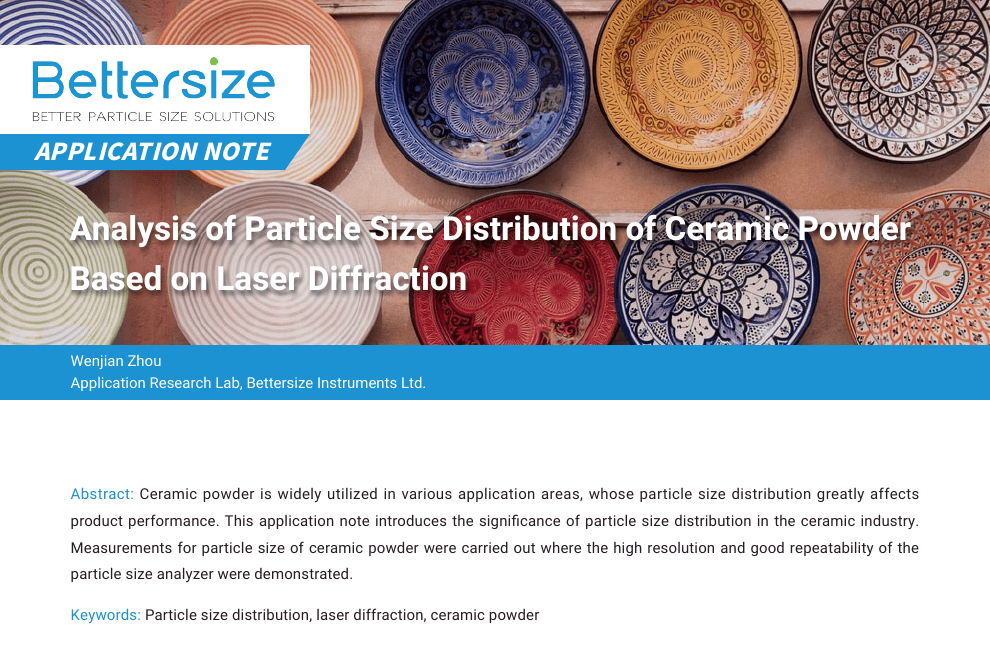
FURTHER READING / APPLICATION NOTE Want to explore this study further? Read the original application note for the full experimental methods, data, and findings. Read the Original →Ceramic Powder · Laser Diffraction · Particle Size Distribution |
 |
Rate this article
Share On


Recent News