Measuring Particle Size and Shape of Needle Coke Using the BeVision D3
2026-04-29Application Note
Abstract: Needle coke, a premium carbon material with highly oriented crystalline structure, plays a key role in the manufacturing of ultra-high power graphite electrodes and lithium-ion battery anodes. The performance and consistency of needle coke depend on its particle size distribution (PSD) and morphology, specifically its high aspect ratio. This study uses the BeVision D3 dynamic image analyzer to measure the PSD and morphology of needle coke particles. The results show that dynamic image analysis offers high-throughput and accurate particle size and shape measurements, enabling improved production efficiency and product quality. The data obtained was compared with traditional sieve methods, demonstrating strong agreement and showcasing the benefits of dynamic imaging.
Keywords: Needle coke, article size distribution (PSD), Particle shape, Dynamic image analysis, BeVision D3, Aspect ratio, Graphite electrodes, Lithium-ion batteries, Quality control
| Product | BeVision D3 |
| Industry | |
| Sample | Needle coke |
| Measurement Type | Particle Size, Particle Shape |
| Measurement Technology |
Needle coke is a premium carbon material characterized by a highly oriented crystalline structure, giving it exceptional electrical conductivity, thermal shock resistance, and an ultra-low thermal expansion coefficient. These properties make it an essential raw material for ultra-high power (UHP) graphite electrodes for electric arc furnaces (EAF) used in iron and steel metallurgy, as well as for lithium-ion battery (LiB) anodes in the rapidly growing new energy sector. Its superior performance is closely linked to its intrinsic microscopic anisotropy, while the macroscopic particle size distribution (gradation) and particle morphology (needle-like structure) play a crucial role in fully realizing its functional advantages.
Particle size distribution (PSD) directly influences the packing density and mechanical strength of downstream products. At the same time, the material’s high aspect ratio is fundamental to its performance, as particles with reduced aspect ratios disrupt crystalline alignment and degrade end-product quality. Traditional quality control methods, including sieving, can provide gradation data, but fail to capture key morphological attributes, such as particle needle-degree or true particle length. Static image analysis offers some shape information, but is limited by small sample volumes, low statistical reliability, slow throughput, and poor correlation with sieve-based results, significantly restricting its usefulness in process control and optimization.
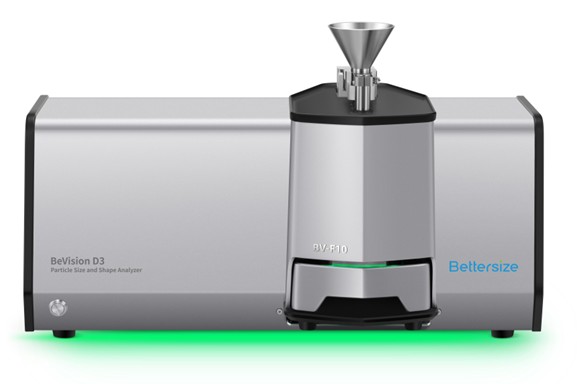
BeVision D3 overcomes these limitations by employing dynamic image analysis to simultaneously acquire high-resolution particle size and morphology data. This approach enables high-throughput detection of tens of thousands of particles in a single test, providing statistically robust PSD and aspect-ratio measurements that support more accurate evaluation and process improvement.
Instruments and Methods
The BeVision D3 dynamic image particle size and shape analyzer equipped with the BV-F10 free fall dispersion unit was used to measure the PSD and morphological characteristics of needle coke samples. For comparison, sieve analysis was conducted using a vibrating sieve analyzer equipped with Tyler standard sieves.
Table 1. BeVision D3 Test Configuration
| Dispersion method | Free fall |
| Imaging | 5-megapixel CMOS |
| Feeding control | Automatic |
| Number of particles measured | 102,000 pcs |
| Test duration | 13 mins |
Results and Discussion
Particle Size Analysis
The maximum Feret diameter (XFmax) was used to characterize the particle length of needle coke, while the minimum chord length (XCmin) was used to characterize the particle width. Each sample was measured three consecutive times to evaluate PSD repeatability. Figure 1 presents the resulting length and width distributions.
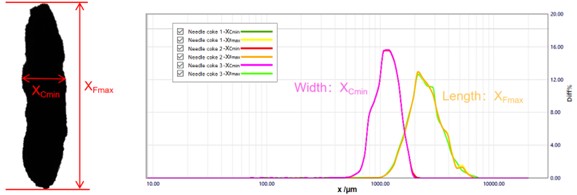
Figure 1. Length (XFmax) and Width (XCmin) distributions of the needle coke
Table 2. Repeatability of Three PSD Measurements
| Average | Standard deviation | Repeatability | |
| XFmax (Q=10%) | 1667.39 μm | 13.28 μm | 0.80 % |
| XFmax (Q=50%) | 2457.21 μm | 8.29 μm | 0.34 % |
| XFmax (Q=90%) | 3811.84 μm | 20.57 μm | 0.54 % |
| Xcmin (Q=10%) | 831.24 μm | 0.24 μm | 0.03 % |
| Xcmin (Q=50%) | 1159.88 μm | 0.83 μm | 0.07 % |
| Xcmin (Q=90%) | 1547.66 μm | 3.50 μm | 0.23 % |
In this analysis, X(Q=n%) denotes the particle length or width below which n percent of all measured particles fall, equivalent to traditional percentile metrics such as D10, D50, and D90. For example, an XFmax(Q=10%) value of 1667.39 μm indicates that 10% of particles have a maximum Feret diameter less than or equal to 1667.39 μm.
Overall, the needle coke sample exhibits a length distribution ranging from approximately 1000 to 7000 μm and a width distribution of roughly 500 to 2000 μm. The three repeated measurements show excellent consistency, with repeatability deviations below 1%.
Sieve Correlation
The BeVision software includes a sieve correlation function that outputs PSD results directly comparable to traditional sieving data. Figure 2 compared the particle width distribution obtained from sieve analysis with the histogram results from the BeVision D3.
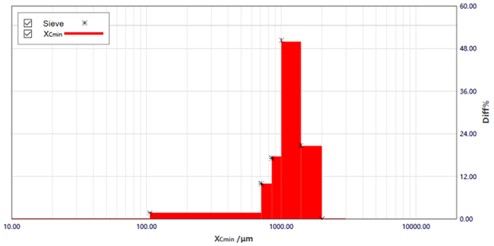
Figure 2. BeVision D3 Particle width distribution XCmin and (※:) sieve histogram
Table 3. BeVision D3 Test Configuration
| Mesh | Size (μm) | Percentage (%) |
| 10 | 2000 | 0.02 |
| 14 | 1400 | 20.73 |
| 18 | 1000 | 50.36 |
| 20 | 850 | 17.14 |
| 25 | 710 | 9.96 |
| 140 | 106 | 1.79 |
| Pan | 0 | 0 |
Table 4. BeVision D3 results
| XCmin /μm | Diff /% |
| 2000.00 | 0.02 |
| 1400.00 | 20.60 |
| 1000.00 | 49.97 |
| 850.00 | 17.63 |
| 710.00 | 9.98 |
| 106.00 | 1.77 |
| 0.00 | 0.03 |
A comparison of the results demonstrates strong agreement between the particle size classes measured by the BeVision D3 and those obtained through the sieve analyzer. Because the BeVision D3 can produce sieve-equivalent PSD outputs, users relying on conventional sieving methods can easily transition to the BeVision D3 without modifying existing QC specifications or thresholds.
Particle Shape Analysis
The length-to-width ratio (L/W ratio) is a critical morphological metric for describing the degree of needle-like structure in needle coke particles. As illustrated in figure 3, the L/W ratio is defined as the particle’s length divided by its width, based on the minimum bounding rectangle of the particle’s projected image. A larger L/W ratio corresponds to a more elongated, needle-like particle.
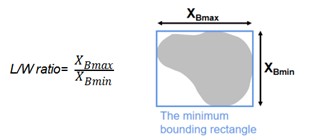
Figure 3. Definition of L/W ratio
Needle coke particles with an L/W ratio greater than 3 signifies a high quality, highly anisotropic material with a well-developed, needle-like or fibrous microstructure. These particles exhibit elongated geometry and intact structural characteristics, which are essential for maintaining proper alignment during graphitization. Their abundance directly influences the upper performance limit of the raw material.
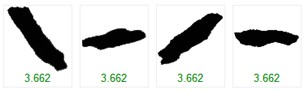
Figure 4. Examples of Needle-like particles
Particles with an L/W ratio of 3 or less are considered blocky. These shorter, more equiaxed particles do not orient effectively during extrusion molding, disrupting microstructural order in the final product and degrading mechanical, electrical, and thermal properties.
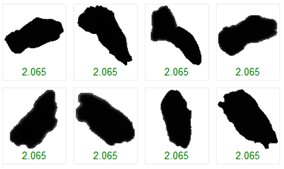
Figure 5. Examples of Blocky particles
Table 5. Volume-weighted proportion of needle-like and blocky particles
| Q(L/W ratio > 3,000) | 81.65 % |
| Q(L/W ratio ≤ 3,000) | 18.35 % |
Examples of blocky particles are shown in Figure 5. Table 5 summarized the volume-weighted proportions of needle-like and blocky particles. In this context, Q denotes the fraction of particles whose size or shape parameters exceed or fall below a specified value.
Conclusion
The BeVision D3 successfully measured more than 100,000 needle coke particles within a 13-minute test interval. Compared with traditional sieve analysis, which typically requires approximately 30 minutes for sample preparation, measurement, and post-test sieve cleaning, the BeVision D3 delivers substantially higher measurement efficiency with significantly reduced maintenance demands.
By employing dynamic image analysis technology, the BeVision D3 captures particle length, width, and shape simultaneously in a single run. When using the built-in sieve-correlation function, the PSD results of BeVision D3 align closely with those obtained from standard sieving, allowing QC laboratories to transition smoothly from conventional methods to dynamic imaging without altering established quality specifications. This transition improves workflow efficiency and reduces labor costs.
Additionally, the BeVision D3 provides 100% particle image retention and complete per-particle data records, enabling R&D teams to conduct in-depth structural and morphological analysis. This comprehensive dataset supports process optimization, raw material evaluation, and product performance improvement across both production and research environments.
About the Authors
 |
Echo Cao |
 |
Weichen Gan |
|
|
|
BeVision D3Advanced Image Analyzer
|
|
LOGIN TO ACCESS EXCLUSIVE CONTENT
More Resources Including
- Application Notes & Collections
- Webinars & Workshops
- Presentations & Videos
- Monthly Newsletters
- Exclusive Events...

Recommended articles
Rate this article