Measuring Molecular Weight with the BeNano 90 Zeta Using Static Light Scattering
2021-02-25Application Note
The weight-average molecular weight measurement of the PEO standard was performed in this application note, and the measured value was determined through the Debye plot. The measured value is quite close to the literature value, thereby demonstrating that the BeNano 90 Zeta is a useful and reliable tool for characterizing the molecular weight of proteins.
| Product | BeNano Series |
| Industry | Chemicals |
| Sample | Polymer Standards |
| Measurement Type | Molecular Weight |
| Measurement Technology |
Jump to a section:
Introduction
Composed of smaller subunits called monomers, a macromolecule is a very large molecule of a high molecular weight. Most common macromolecules include natural and synthetic polymers, proteins, and polypeptides. The molecular weight of a macromolecule closely correlates to its physical, biological and chemical properties. Therefore, molecular weight measurement is one of the important factors in macromolecular characterization. Molecular weight measurement involves methods such as gel permeation chromatography, centrifugal sedimentation, end-group analysis, and osmotic pressure. Besides the above-mentioned methods, static light scattering (SLS) is another technique for the characterization of molecular weight.
In this application note, the BeNano 90 Zeta (Bettersize Instruments Ltd.) was utilized to characterize the molecular weight of a polyethylene oxide (PEO) standard dissolved in water using the SLS method. The results will endorse the ability of BeNano 90 Zeta for characterizing molecular weight.
Theory and Instrumentation
In an SLS experiment, the scattering intensity of a macromolecule in the solution is detected and analyzed to obtain the molecular weights of macromolecules, typical sample including polymers and proteins. When a vertically polarized laser beam irradiates onto the sample, the macromolecules scatter light in all directions, and according to the Rayleigh equation, the molecular weight and the scattering intensity at a certain angle are related by:
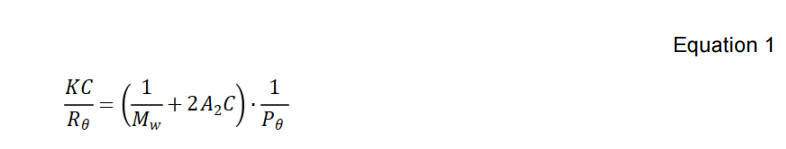
where C is the sample concentration, θ is the detection angle, Rθ is the Rayleigh ratio that is used to characterize the intensity ratio between the scattered light and the incident light at angle θ, Mw is the sample’s weight-average molecular weight, and A2 is the second virial coefficient. Equations 2 and 3 below define the constant K and the shape factor Pθ.
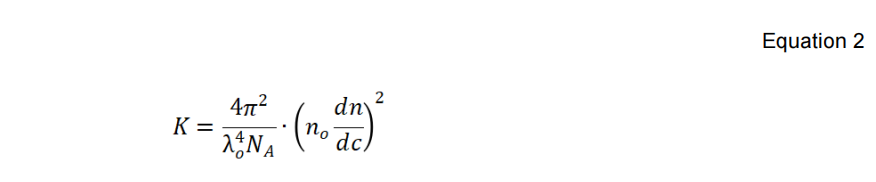
The λ0, NA, n0 and dn/dc in Equation 2 are the wavelength of the incident laser in a vacuum, Avogadro’s number, refractive index of the solvent, and the refractive index increment of the suspension with respect to concentration under constant temperature, respectively. Equation 3 below defines the shape factor Pθ with λ0, NA, n0, θ, and Rg, which is the macromolecule’s radius of gyration.

The only terms remain unknown in the Rayleigh equation as shown in Equation 1 are MW, A2, and Pθ. When the macromolecule’s radius of gyration Rg is much less than the wavelength of the incident light λ0 (usually smaller than 1/40 of the incident wavelength), the sample is considered to scatter homogenously at all angles, where the Pθ approximates to 1.0. Therefore, the molecular weight calculations based on any angle yield identical and accurate results. Under this circumstance, the Rayleigh equation is simplified into:
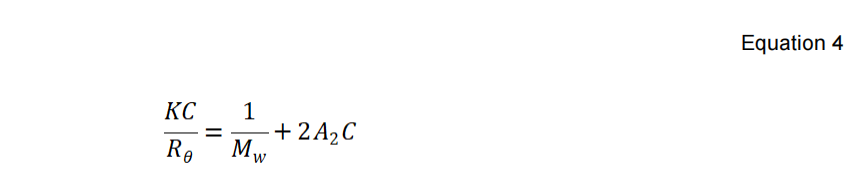
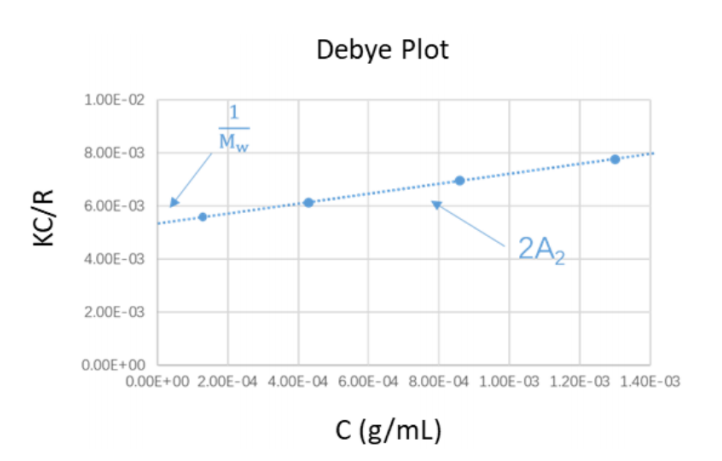
The Mw (molecular weight) of the PEO standard in this application note was determined on the BeNano 90 Zeta of Bettersize BeNano Series. The scattered intensity of PEO solutions were detected at 90°with various concentrations. The Debye plot is then constructed by plotting and linearly fitting the KC/Rθ values versus the concentration profiles of the suspensions. The slope of the linear regression equation is used to calculate the second virial coefficient A2, while the extrapolation of the linear regression to zero concentration yields the reciprocal of molecular weight.
Experiment
A toluene standard with known Rayleigh ratio was prepared and used for reference. PEO aqueous solutions were prepared at the concentration 20, 10, 5, 2.5, 2.0, 1.5, 1.0, and 0.5mg/mL, and filtered by 0.22 μm PES filter.
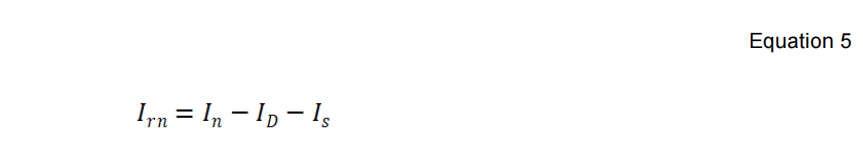
The device measured the dark count rate (ID), scattering intensity of the standard toluene sample (ISTD), scattering intensities of the solvent (Is), and scattering intensities of the samples at different concentrations (I1, I2, I3…In). The residues of absolute scattering intensities of the samples at different concentrations with respect to the solvent were calculated as:
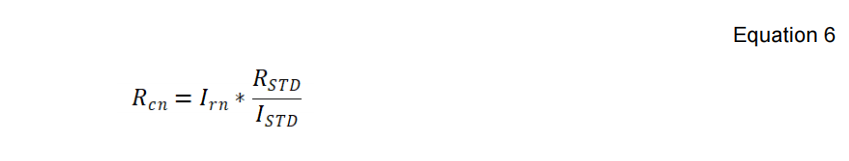
Using the calculated absolute scattering intensities (Irn), ISTD, and the known Rayleigh ratio of the standard toluene sample (RSTD), the Rayleigh ratio of samples at different concentrations were calculated as follow:
With the calculated Rcn, the Debye plot was constructed by plotting the KC/Rcn against the concentration profiles. The molecular weight and the second virial coefficient were obtained through the intercept and slope from the linear regression of Debye plot. The experimental results were then compared with the literature values to verify the accuracy of the results.
Results and Discussion
The literature values of weight-average molecular weight (Mw) and the refractive index increment for the PEO standards examined in this application note are 20.217kDa, and 0.132, respectively. The Debye plot constructed from the experimental data is displayed in the Figure 3 below. From the linear regression equation of the Debye plot, the molecular weight Mw and the second virial coefficient were calculated, as shown in Table 1.
|
Intercept
[1/kDa]
|
Calculated Mw
[kDa]
|
Slope
[L*mol/g^2]
|
A2
[mL*mol/g^2]
|
|
0.0435
|
22.989
|
3.006
|
0.001503
|
Table 1. Molecular weight and second virial coefficient results from Debye Plot.
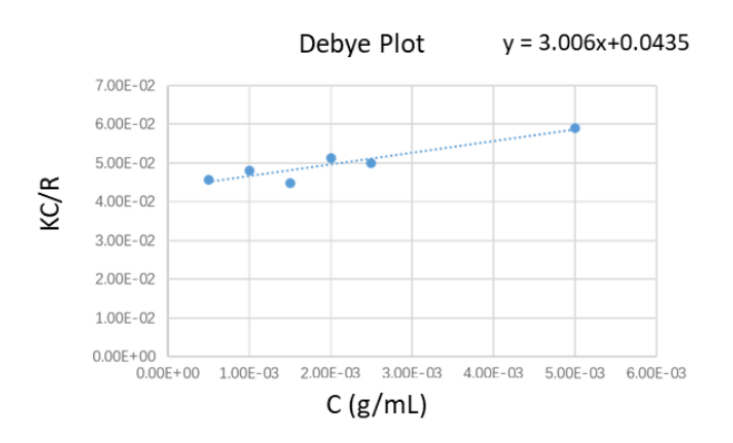
As seen from Table 1, the weight-average molecular weight result of the PEO standard obtained by the BeNano 90 Zeta was 22.98kDa, and the deviation between this measured value and the literature value of 20.217kDa was around 10%.
Conclusions
The weight-average molecular weight measurement of the PEO standard was performed in this application note, and the measured value was determined through the Debye plot. The measured value is quite close to the literature value, thereby demonstrating that the BeNano 90 Zeta is a useful and reliable tool for characterizing the molecular weight of proteins.
About the Authors
| Shelly Zhang, Zhibin Guo, Hui Ning Application Engineers @ Bettersize Instruments |
|
Advanced Nanoparticle Size & Zeta Potential Analysis
|
|

LOGIN TO ACCESS EXCLUSIVE CONTENT
More Resources Including
- Application Notes & Collections
- Webinars & Workshops
- Presentations & Videos
- Monthly Newsletters
- Exclusive Events...

Recommended articles
Rate this article