Investigating Antibody Aggregation and Molecular Weight with the BeSEC
2026-01-12Application Note
Abstract: Monoclonal antibody aggregation is a critical quality attribute affecting safety and efficacy of biopharmaceuticals. In this study, size-exclusion chromatography combined with static light scattering and refractive index detection was applied to characterize molecular weight and aggregation states of monoclonal antibodies, enabling accurate differentiation and quantification of monomers, dimers, and higher-order aggregates.
Keywords: Monoclonal antibodies, Antibody aggregation, Size-exclusion chromatography (SEC), Static Light scattering, Molecular weight determination, Biopharmaceutical characterization
| Product | BeSEC |
| Industry | |
| Sample | Thermally Expandable Alumina Microspheres |
| Measurement Type | Protein aggregation and molecular weight analysis |
| Measurement Technology |
Size-Exclusion Chromatography (SEC)
|
Introduction
Monoclonal antibodies (mAbs) are highly specific proteins that recognize and bind to antigens on pathogens such as viruses and bacteria, enabling rapid detection through assays like ELISA and immunofluorescence. Beyond diagnostics, mAbs play a critical role in oncology by identifying tumor-associated antigens and supporting early cancer screening. As therapeutics, monoclonal antibodies can directly target tumor cells; for example, Rituximab binds CD20 on B-cell lymphoma cells, triggering immune-mediated clearance. Additionally, antibodies can be conjugated to chemotherapeutic agents or radionuclides to form antibody-drug conjugates (ADCs), which deliver cytotoxic payloads to tumor cells while minimizing off-target effects.
During formulation, monoclonal antibody solutions often contain dimers, trimers and higher order aggregates. These species can increase immunogenicity upon administration, which poses safety concerns. Therefore, accurate quantification of oligomers and aggregates is essential for formulation development, quality control and aggregate characterization.
Experimental Section
This study employed a size-exclusion chromatography (SEC) system equipped with refractive index (RI) and light scattering (LS) detectors. The LS detector is the BeSEC LS2 from Bettersize Instruments with 90° and 7° detection angles. The BeSEC workstation integrates light scattering with RI or UV signals to calculate molecular weight distributions and averages including Mn, Mw and Mz.
System Configuration:
- Detectors: Light Scattering (LS) + RI
- Column: Shodex PROTEIN LW-803
- Mobile phase: Phosphate-buffered saline (PBS)
- Flow rate: 0.7 mL/min
- Injection volume: 100 μL
- Column temperature: 40 ℃
- dn/dc: 0.185 mL/g
Sample Preparation:
Three monoclonal antibody samples (A, B and C) were prepared for analysis. Each sample was weighed and dissolved in PBS to a concentration of 2–5 mg/mL, stirred until fully transparent, then filtered through a 0.22 μm PES syringe filter. The filtered solutions were transferred into autosampler vials for SEC injection.
Results and Discussion
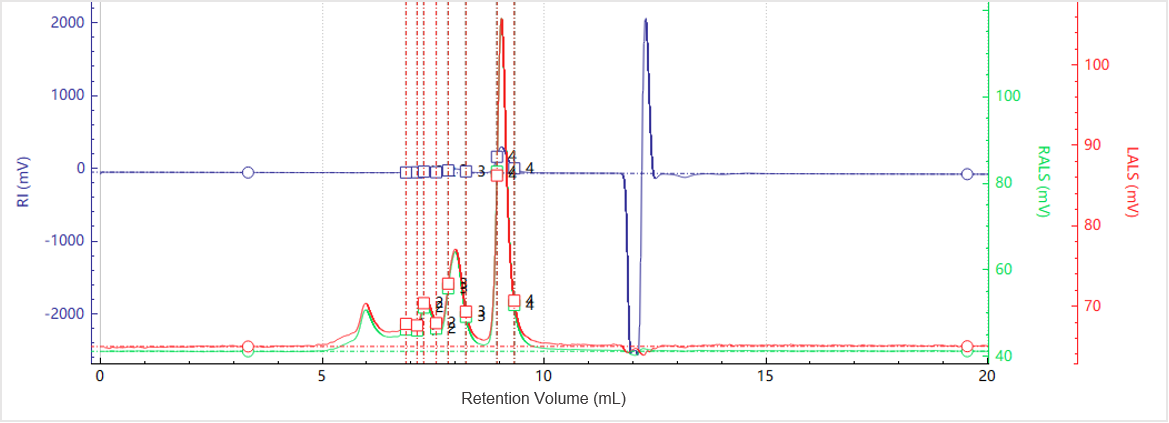
Figure 1. Elution profiles of the multi-detector signals for Sample A
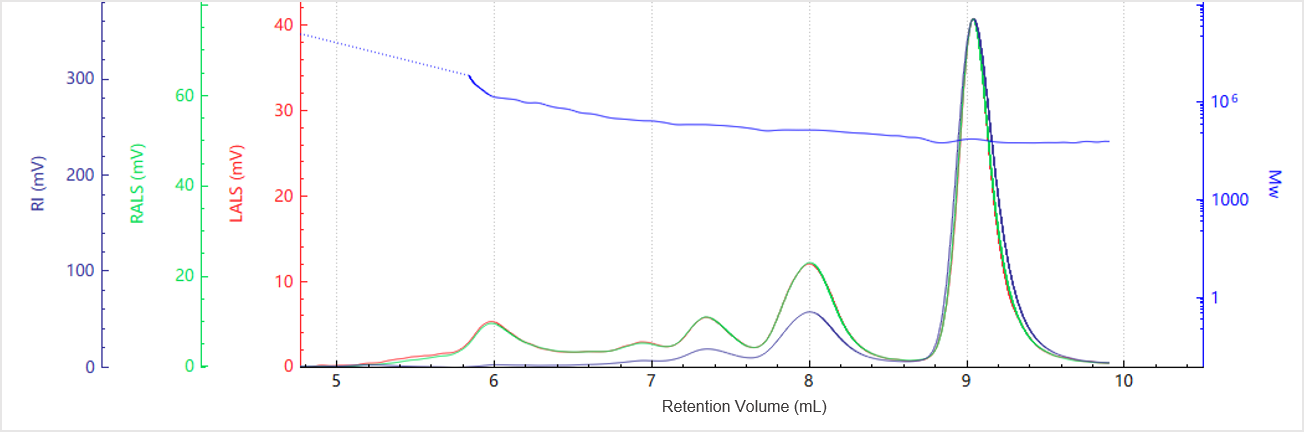
Figure 2. Elution profile of the molecular weight for Sample A
Figure 1 shows the elution profiles of the multi-detector signals for Sample A, while Figure 2 presents the corresponding molecular weight distribution. The light scattering signals at 90° and 7°, along with the RI trace, reveal multiple distinct peaks, indicating the presence of different aggregation states within the sample.
Peak-based integration was used to calculate the molecular weight of each species, as summarized in Table 1. The molecular weight versus elution volume plot demonstrates a gradual decrease in molecular weight with increasing elution volume, consistent with the separation principle of SEC, where larger species elute earlier than smaller ones. Each peak exhibits a molecular weight plateau, reflecting the relatively narrow molecular weight distribution of individual oligomeric states within the protein sample.
Table 1. Molecular weight results for peaks in Sample A
| Peak | Mw (Da) | Ratio of Peak n/Peak 1 | Area (%) |
| Peak 1 |
149776 |
1 | 75.8 |
| Peak 2 |
295157 |
1.97 | 17.4 |
| Peak 3 |
450351 |
3 | 3.8 |
The molecular weight of Peak 1 is approximately 150 kDa, consistent with the theoretical value of a monoclonal antibody monomer. Peaks 2 and 3 scale as clean multiples of Peak 1, corresponding to the dimeric and trimeric species. Quantitative analysis shows that the monomer accounts for 75.80% of the total protein, while aggregated species collectively exceed 5%. For therapeutic applications involving injection, these aggregates are of concern, as they may increase immunogenic risk and negatively affect product safety.
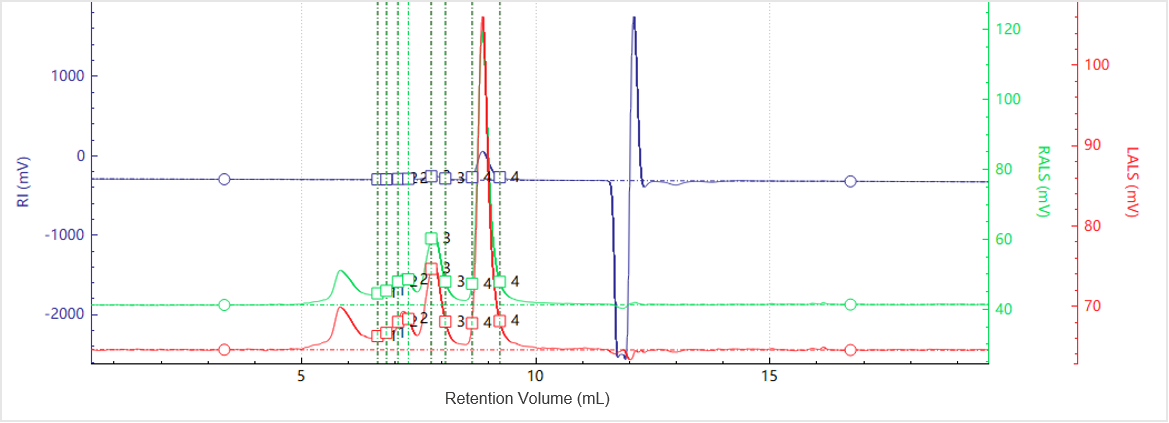
Figure 3. Elution profiles of the multi-detector signals for Sample B
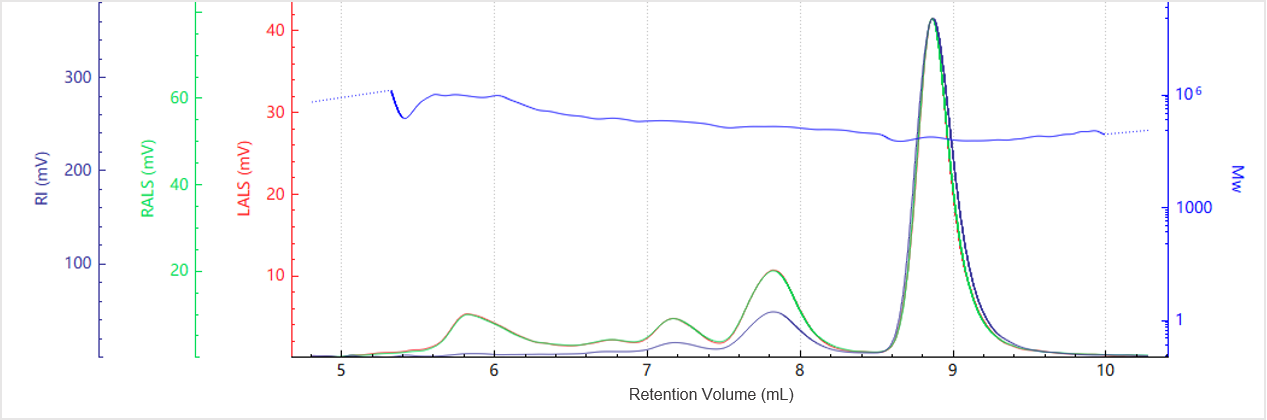
Figure 4. Elution profile of the molecular weight for Sample B
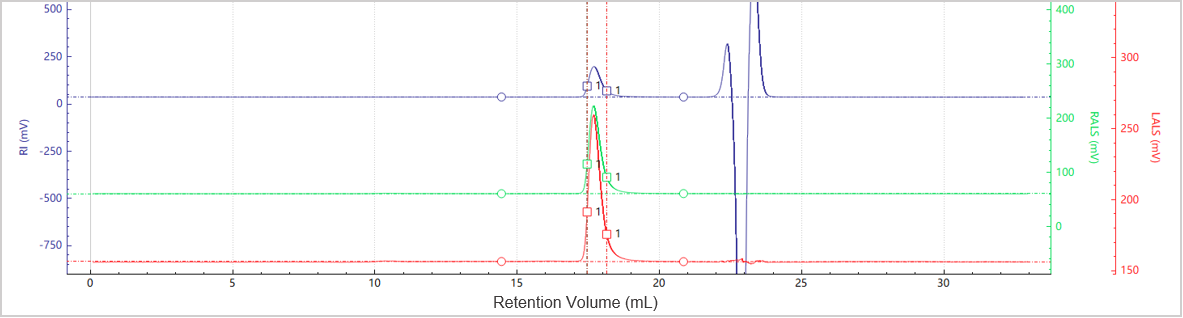
Figure 5. Elution profiles of the multi-detector signals for Sample C
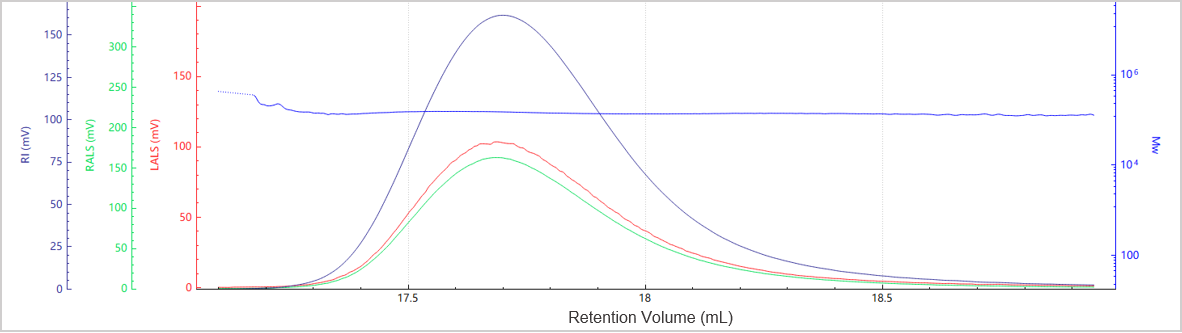
Figure 6. Elution profile of the molecular weight for Sample C
Figures 3 and 4 display the chromatogram and molecular weight profile for Sample B. In addition to the main peak, a smaller peak appears at an earlier elution time, suggesting the presence of higher-order aggregates.
Figures 5 and 6 illustrate the chromatogram and molecular weight profile of Sample C, which exhibits a single dominant peak, indicating minimal aggregation is present in this sample.
Table 2. Molecular weight results for peaks in Sample B
| Peak | Mw (Da) | Ratio of Peak n/Peak 2 | Area (%) |
| Peak 1 |
298048 |
1.97 | 1.34 |
| Peak 2 |
151546 |
1 | 98.6 |
Table 3. Molecular weight results for peaks in Sample C
| Peak | Mw (Da) | Ratio of Peak n/Peak 2 | Area (%) |
| Peak 1 |
147709 |
1 | 100 |
Table 2 shows that sample B contains a dimer in addition to the primary monomer peak. The dimer’s molecular weight is approximately twice that of the monomer, and its relative abundance is low at 1.34%, suggesting minimal aggregation. In contrast, Table 3 shows that Sample C contains solely the main peak, with no detectable oligomers or higher-order aggregates. This profile reflects excellent structural integrity and suggests that Sample C is the most stable among the three tested formulations.
Conclusion
In this application note, the BeSEC LS2 detector was employed to measure molecular weights of monoclonal antibody samples. Aggregates in biopharmaceuticals can significantly impact therapeutic performance and patient safety, as large aggregates may trigger immune responses. Understanding the type and level of aggregates in monoclonal antibody formulations is therefore critical. The BeSEC system demonstrates that static light scattering can effectively resolve monomer, dimer, and higher-order species and quantify their content. This capability is highly valuable for the development, stability assessment, and quality assurance of biological drugs.
About the Authors
 |
Zhibin Guo |
|
BeSEC
Advanced Light Scattering Detector
|
|
LOGIN TO ACCESS EXCLUSIVE CONTENT
More Resources Including
- Application Notes & Collections
- Webinars & Workshops
- Presentations & Videos
- Monthly Newsletters
- Exclusive Events...

Recommended articles
Rate this article