Characterizing the Size and Size Distribution of Monoclonal Antibody Modified Latex Particles
2022-01-17Application Note
BeNano 90 provides accurate immunodiagnostic results, a powerful process-monitoring tool for developing latex-antibody immunological reagents.
| Product | BeNano Series |
| Industry | Pharmaceuticals |
| Sample | Polystyrene Latex Nanoparticles |
| Measurement Type | Particle Size, Zeta Potential |
| Measurement Technology |
Jump to a section:
Introduction
Turbidimetry (also known as turbidimetric immunoassay) is a commonly used approach for the diagnosis of clinical immunological reagents. PETIA (Particle-enhanced turbidimetric immunoassay) is one of the homogeneous turbidimetric that has emerged in recent years, which is a more stable and accurate access to quantifying the level of antigen-antibody complexes in body fluids. It detects the opaqueness of the diagnostic reagent containing immunoparticles mixed with the specimen, which might possibly contain the target analyte (antigen).
Polystyrene latex nanoparticles coated with monoclonal antibodies are commonly applied as antigen-antibody complexes in PETIA. The concentration, size, and size distribution of latex particles are critical indicators for developing such immunodiagnostic reagents, since they significantly affect the responsiveness and sensitivity of PETIA tests and also the stability of the reagents.
In this application note, the particle size and size distribution of three latex samples coated with monoclonal antibodies in the R&D stage were characterized.
Experimental
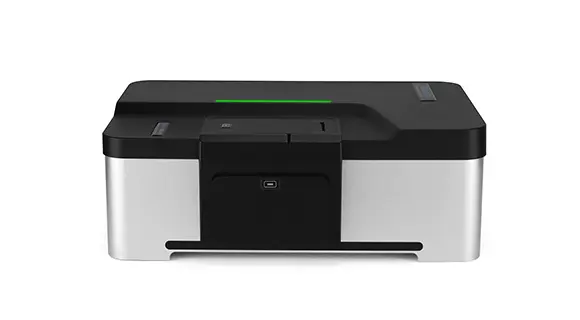
The BeNano 90 nanoparticle analyzer from Bettersize Instruments Ltd. was utilized. It is equipped with a laser with a wavelength of 671 nm and a power of 50 mW as the light source, with an APD detector set at an angle of 90° to collect scattered light signals.
Three latex complexes were measured, and the corresponding information is shown below.
| Sample | Dilution Times | Dispersant |
| A | 1,000 | Distilled Water |
| B | 1,000 | Distilled Water |
| C | 2,000 | Distilled Water |
The measurements were performed at 25 °C with the built-in temperature control unit in the BeNano 90. Each sample was measured at least three times to obtain the standard deviations of sizes and investigate the result repeatability.
Results and Discussion
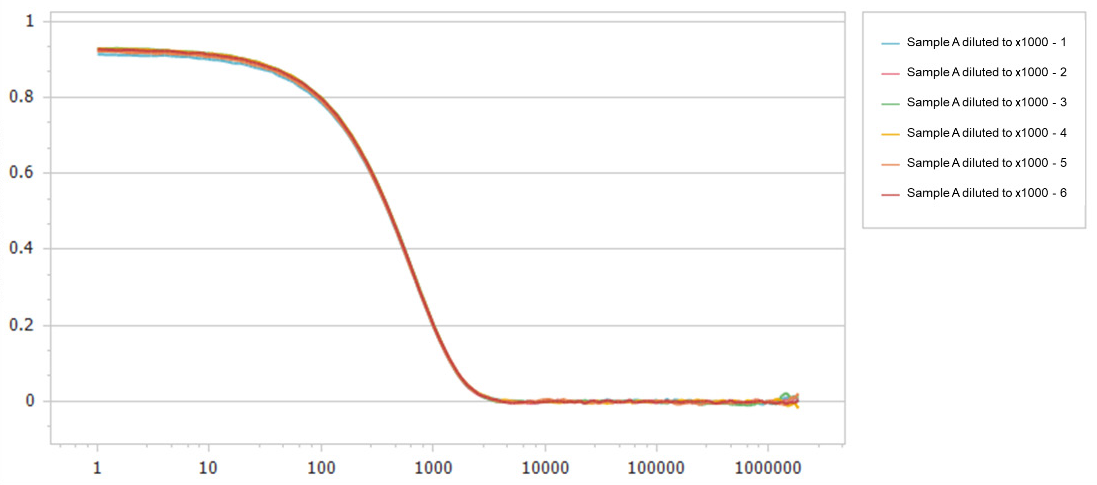
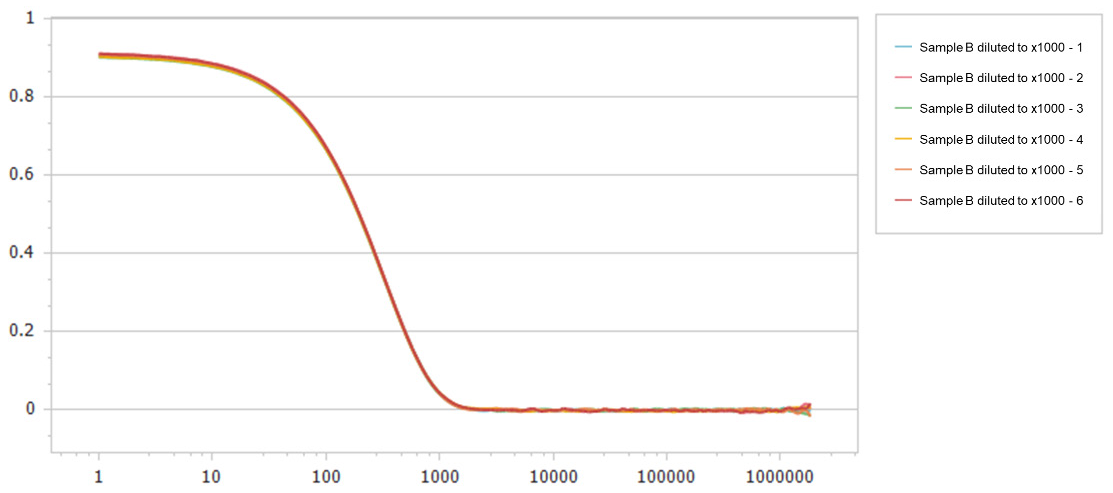
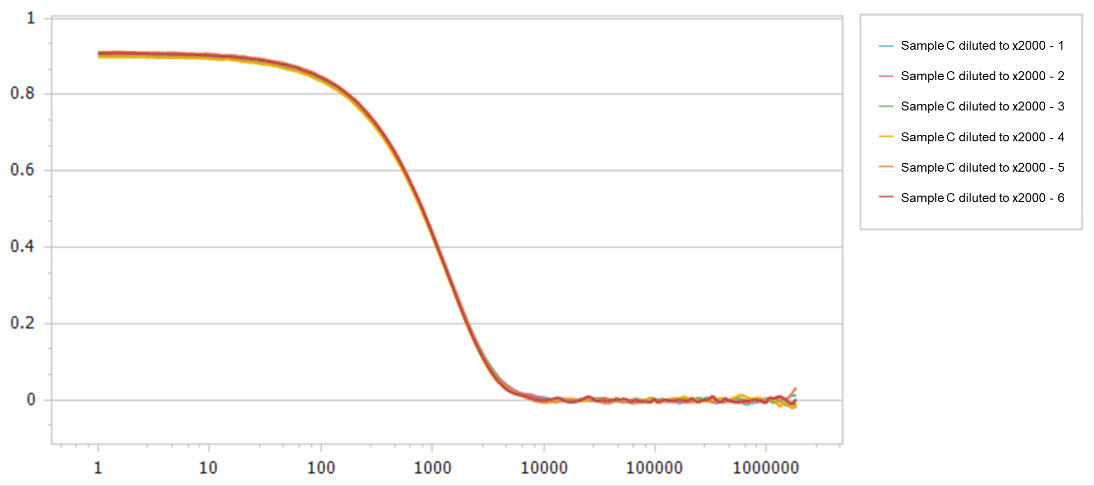
By analyzing the original scattered light signals, the correlation functions of samples are obtained, as shown below.
Figures 1 - 3 show the correlation functions of three samples. As shown, the correlation functions are with high repeatability, which illustrates the excellent stability of the optical system of the BeNano 90.
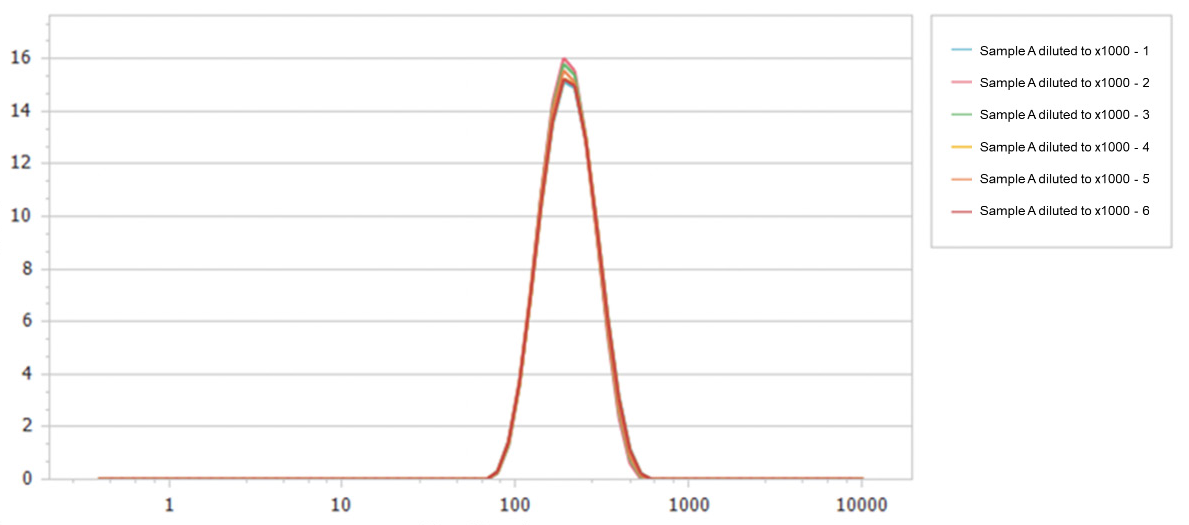
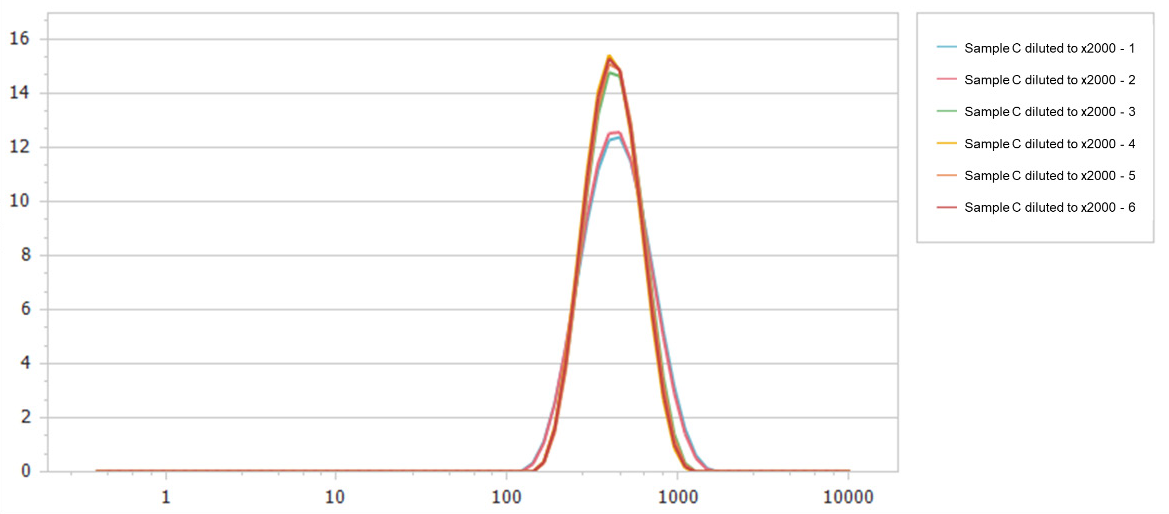
Figures 4 - 6 show the particle size distributions (PSD) of three samples. The PSD of each sample achieves good repeatability under such test conditions.
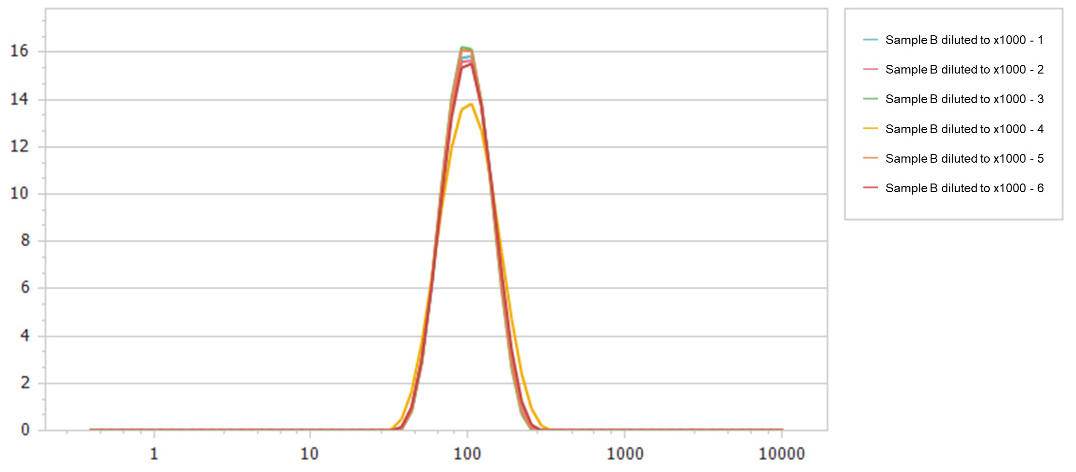
Comparing the PSDs of the three samples in Figure 7, it can be concluded that the size of Sample C > Sample A > Sample B, and their PSDs are highly differentiated.
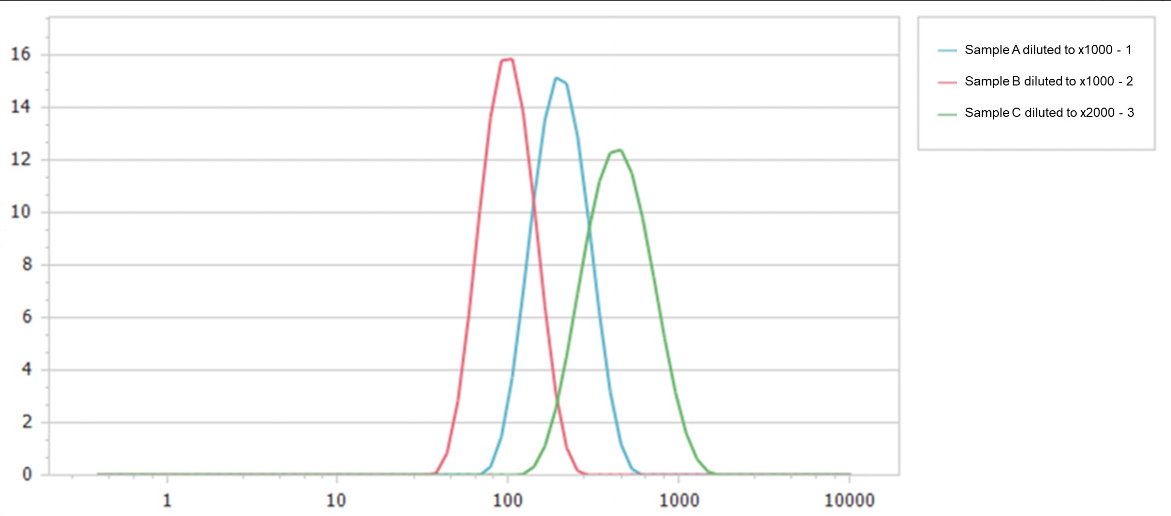
From the measurement results in Table 2, we can see that the Z-average sizes of the three samples are significantly different. Sample C is the greatest in size, Sample A is the second, and Sample B is the smallest. The difference in size between sample B and sample C is around four times. The relative standard deviation (RSD) of the repeatability of each sample is less than 1%. The polydispersity index (PDI) of all samples is less than 0.05, suggesting that the particle size distributions of all samples are narrow, and they are monodisperse in size.
| Sample | Z - average size (nm) | RDS% | PDI |
| A |
200.47±1.73
|
0.86 | 0.027 |
| B | 99.52±0.41 | 0.42 | 0.028 |
| C | 411.59±4.05 | 0.98 | 0.029 |
Conclusion
In the field of immunodiagnostic assay, the BeNano 90 is able to provide highly accurate and reproducible test results, which is a powerful process-monitoring tool for producing and developing such latex-antibody immunological reagents.
About the Authors
 |
Zhibin Guo Application Manager @ Bettersize Instruments |
 |
Dr. Ning Chief Product Officer @ Bettersize Instruments |
|
Advanced Nanoparticle Size & Zeta Potential Analysis
|
|
LOGIN TO ACCESS EXCLUSIVE CONTENT
More Resources Including
- Application Notes & Collections
- Webinars & Workshops
- Presentations & Videos
- Monthly Newsletters
- Exclusive Events...

Recommended articles
Rate this article