Application of Laser Particle Size Analyzer in Quality Inspection of Silicon Carbide Abrasive Grains
2021-09-07Application Note
Particle size distribution is a key characteristic of abrasive grain products. This application note analyzes four batches of black silicon carbide using a Bettersizer ST laser diffraction analyzer. By comparing particle size distributions between batches, production process stability can be evaluated, and products can be assessed against ISO standards for quality compliance.
| Product | Bettersizer ST |
| Industry | Abrasives |
| Sample | Silicon Carbide |
| Measurement Type | Particle Size |
| Measurement Technology | Laser Diffraction |
Jump to a section:
Abstract: The particle size distribution is one of the most important characteristics of abrasive grain products. In this application note, we will be looking at the particle size distribution of four batches of black silica carbide using a Bettersizer ST laser diffraction particle size analyzer. The stability of the production process can be evaluated by comparing the particle size distribution of abrasive grain products with each other. The particle size distribution of different abrasive grain products can be determined and be compared to ISO standards to determine if they are up to standard or not.
Key words: Particle size distribution, laser diffraction, abrasive grains, silicon carbide, quality control
Introduction
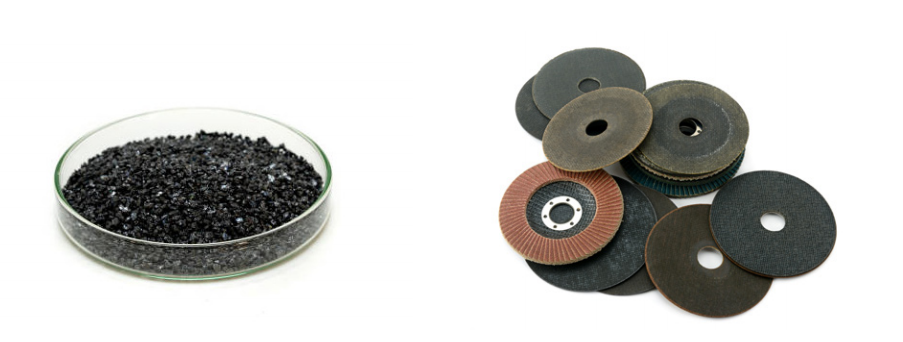
Minerals are naturally present on this planet in many forms including gemstones and abrasives. In this paper, we will be concentrating on abrasives which are materials that reduce a surface by friction and rubbing. Diamond, garnet, and aluminum oxide are mined and thus represent natural abrasives. Silicon carbide, diamond, and alumina are examples of synthetic abrasives. It is advantageous to use the synthetic form, to maintain the supply and consistency of properties for the grains, or grit abrasives. The final abrasives are used in the manufacture of bonded abrasive products used for polishing, grit blasting, and surface grinding. There are certain properties that make these materials applicable to being used as abrasives - hardness and sharpness to reduce another product’s surface and toughness to help withstand the abrading action. The surface to be treated must have a lower hardness than the selected abrasive so a high hardness is needed to grind, polish, or remove the surface from that material. The materials used as abrasives are often synthetic. Their applications include chemical mechanical planarization manufacture of computer and DVR / CD discs, sandpaper, grinding and cutting wheels, human skin blemish removal, anti-slip floors, kitchen and bathroom cleaners, and silicon wafer production. Hardness is ascribed values by three primary scales: Mohs, Vickers, and Knoop. The Mohs scale determines which material will scratch another. Vickers and Knoop use a shaped diamond to produce an indentation. The Vickers is primarily used for metals while the Knoop tests brittleness. The diamond represents the hardest material and has the maximum value for all scales and generally, the Mohs scale is used most often.
Ultimately, the microtopography and smoothness of the abraded surface and efficiency of abrasion are related to the particle size distribution (PSD) of the abrasive grain used. In general, finer abrasive grains scrape off materials much slower, but the abraded surface would be smoother. Different applications require different PSDs of abrasive grains depending on the required production speed and desired smoothness. Thus, measuring the PSD is an extremely vital part of abrasive grain quality inspection.
|
Mineral
|
Mohs hardness
|
Other materials
|
Observations on the minerals |
|
Talc
|
1 |
very easily scratched by the fingernail; has a greasy feel
|
|
|
Gypsum
|
2 | can be scratched by the fingernail | |
|
Calcite
|
3 |
very easily scratched with a knife and just scratched with a copper coin
|
|
|
Fluorite
|
4 |
~5.1 pocketknife
|
very easily scratched with a knife but not as easily as calcite
|
|
Apatite
|
5 |
~5.5 glass plate
|
scratched with a knife with difficulty
|
|
Orthoclase
|
6 |
~6.5 steel needle
|
cannot be scratched with a knife, but scratches glass with difficulty
|
|
Quartz
|
7 |
~7.0 streak plate
|
scratches glass easily
|
|
Topaz
|
8 |
scratches glass very easily
|
|
|
Corundum
|
9 |
cuts glass
|
|
|
Diamond
|
10 |
used as a glass cutter
|
Measuring Particle Size Distribution of Silicon Carbide Abrasive Grains
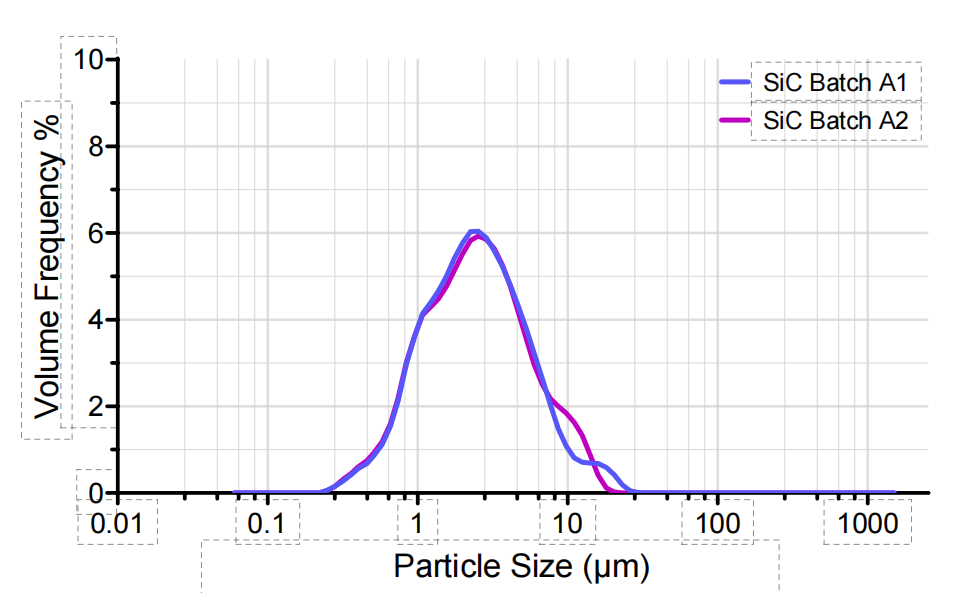
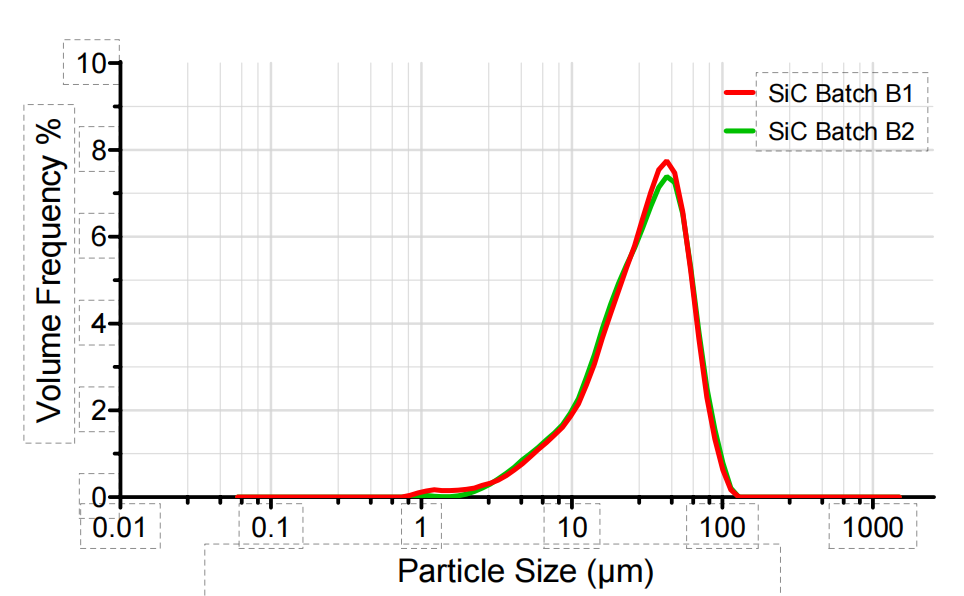
Four different batches of black silica carbide (SiC) abrasive grain products, which are used for producing bonded abrasives, were collected as sample materials for this experiment. Batch A1 and A2 were produced using the same processing parameters, so their grit number should be the same (ISO/FEPA F1500). The same can be said for batch B1 and B2 (ISO/FEPA F320).
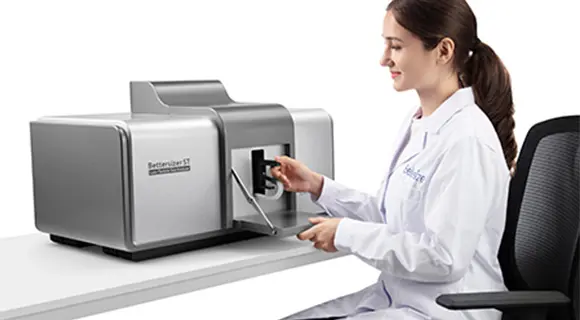
The Bettersizer ST is a laser diffraction particle size analyzer used to measure abrasive grain size distributions. With its patented dual lens optical systems (DLOS), Bettersizer ST efficiently provides measurement results for particles with sizes ranging from 0.1 to 1000 microns (μm). All measurements were repeated 10-16 times to ensure repeatability of sampling, dispersion, and measurement.
Comparing PSD Modes of Different Silicon Carbide Abrasive Grains
The PSD results of the abrasive grain samples obtained from the Bettersizer ST are displayed in Figure 2 and Figure 3 below. It is obvious that they have a very similar particle size distribution; however, there are some differences at the coarser end (>10 microns) for batch A1 and batch A2. Abrasive grains which are larger than expected, have a negative influence on the abrasion process. Both samples in batches A and batches B have similar particle size distributions which endorse a stable and robust production process for these abrasive grains.
PSD Results Help to Inspect Product Quality
According to the International Standards Organization (ISO) standard 8486-2: 2007, the optimal abrasive grain size distribution is determined according to three criteria. These criteria concern 3 percentile size values of the abrasive grains size distributions: criteria (a) stipulated maximum value of ds3 (D97 value from Bettersizer ST), criteria (b) stipulated a permitted range of ds50 (D50 value from Bettersizer ST), and criteria (c) is about the permitted minimum value of ds80 or ds94, which is D20 value and D06 value from Bettersizer ST. To pass and be acceptable in spec product, all three criteria should be met following the ISO recommendations. The ISO standard criteria and typical size values from PSD measurement results for batch A are shown in Table 2.
| Sample Name | Batch A1 | Batch A2 |
ISO criteria (permissible deviations)
|
|
ds3 (μm)
|
11.7 | 10.85 |
Maximum 5 (+ 1.0)
|
|
ds50 (μm)
|
2.256 | 2.294 |
2.0 (± 0.4)
|
|
ds80 (μm)
|
1.122 | 1.108 |
Minimum 0.8 (- 0.3)
|
According to the results, batch A1 and A2 failed to meet the criteria (a) of ds3, which means they fail to meet the ISO standard on the coarser end. In other words, there are too many oversize particles in those samples. However, batch A1 and A2 had met the criteria (b) of ds50 and (c) of ds80, which implies particles in batch A1 and A2 meet the ISO standard on the finer end.
As for batches B1 and B2 (ISO/FEPA F320), the ISO criteria and typical size values from Bettersizer ST are displayed in Table 3. The particle size distribution result shows they failed to meet both criteria (a) and (c), which indicates batch B1 and B2 have failed on both the coarse and the fine ends.
| Sample Name | Batch A1 | Batch A2 |
ISO criteria (permissible deviations)
|
|
ds3 (μm)
|
75.34 | 77.13 |
Maximum 49 (+ 1.5)
|
|
ds50 (μm)
|
29.36 | 29.09 |
29.2 (± 1.5)
|
|
ds80 (μm)
|
5.281 | 6.270 |
Minimum 16.5 (- 0.8)
|
Conclusion
Particle size and size distributions of abrasive grains significantly affect the microtopography and smoothness of the abraded surface. Abrasive grains could be used for producing bonded abrasive products. The ISO has published a standard to evaluate abrasive grains by measuring grain size distributions and distinguishing oversize particles. The Bettersizer ST is an efficient and reliable instrument that provides particle sizing solutions that improve the quality control process of abrasive industries, including manufacturing abrasive grains, bonded abrasive products, loose grits used in polishing, as well as many other general industrial applications.
References
[1] ISO 8486-2: 2007 Bonded abrasives - Determination and designation of grain size distribution - Part 2: Microgrits F230 to F2000
About the Authors
 |
Weichen Gan Engineer @ Application Research Lab, Bettersize Instruments Ltd.
|
|
The Bettersizer ST is a fully automated and integrated particle size analyzer with a smart operation system for wet dispersing.
|
|
LOGIN TO ACCESS EXCLUSIVE CONTENT
More Resources Including
- Application Notes & Collections
- Webinars & Workshops
- Presentations & Videos
- Monthly Newsletters
- Exclusive Events...

Recommended articles
Rate this article