Investigating the Particle Size and Shape Influences on Anode Energy Density of Lithium-Ion Batteries
2022-04-15Application Note
Particle size and shape are two main parameters that determine the energy storage capacity for the anode in LIBs, which should be monitored and controlled within an optimal range to improve the efficiency of manufacturing process. According to the Chinese Standard of GB/T 38887-2020, the circularity and particle size of graphite should be measured by the dynamic image method and the laser diffraction method, respectively. The traditional method requires at least two instruments to obtain the particle size and shape results individually. The Bettersizer S3 Plus, with laser diffraction and dynamic image technology in one instrument, is the optimal selection for manufacturers to obtain particle size and shape results in one single measurement.
| Product | Bettersizer S3 Plus |
| Industry | Battery and Energy |
| Sample | Graphite |
| Measurement Type | Particle size, Particle Shape |
| Measurement Technology | Laser Diffraction, Dynamic Image Analysis |
Jump to a section:
Introduction
The lithium-ion batteries (LIBs) have been widely used in variety of applications due to its advantages of long storage life, no memory effect, and low self-discharge rate. With the rapid increasing demands of LIBs in electrical products, the production of higher energy-density batteries has attained manufacturers’ attention because of the needs of storing more energy.
The energy density of the anode can be significantly improved by optimizing the particle size and shape of the graphite. Basically, the appropriate particle size of graphite is around 20 μm, where batteries have better energy-storage capacity. Moreover, the energy storage is directly influenced by the circularity of graphite. The graphite particles with higher circularity will result a higher tapped density. To hold more energy, the optimal tapped density for graphite should be higher than 1 g/mL. The Bettersize laboratory conducted an experiment with the Bettersizer S3 Plus to investigate how particle size and shape significantly affect the energy density of LIBs.
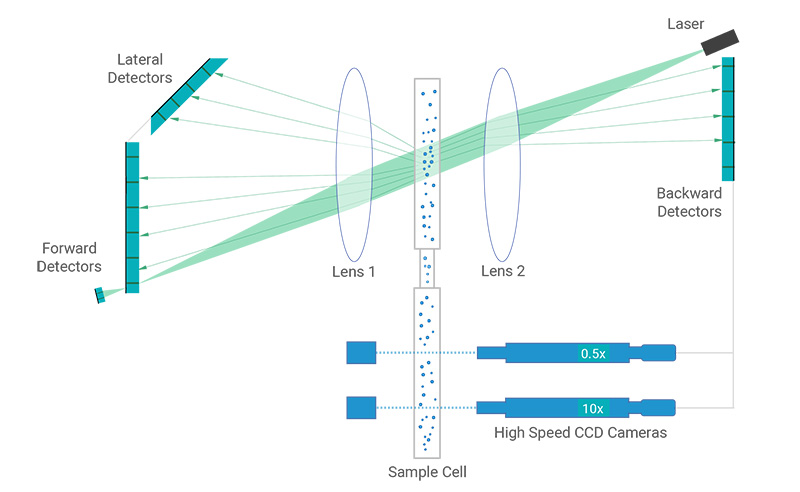
Figure 1. Optical System of the Bettersizer S3 Plus
Result
Particle Size Distribution
The particle size and particle size distribution of graphite samples were measured with laser diffraction alone with the Bettersizer S3 Plus. The three samples’ particle size distribution are shown in Figure 2, and the typical size values are shown in Table 1. From Figure 2, the particle size eventually increases from Sample A to Sample C. The median size value (D50) of the three samples is 6.804 μm, 15.98 μm, and 23.72 μm, respectively.
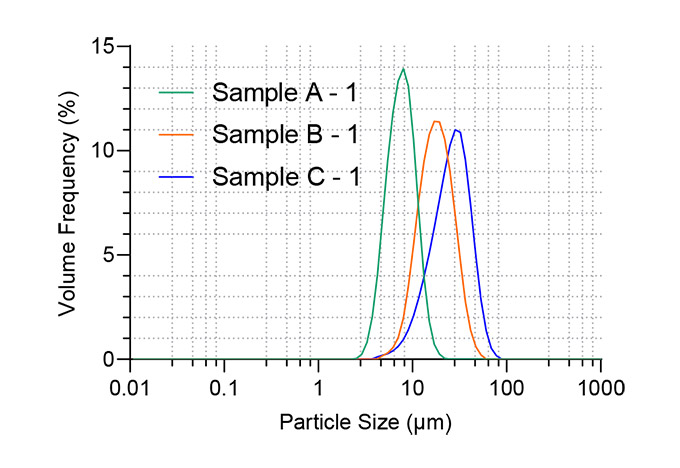
Figure 2. Particle size distribution of three graphite samples
Table 1. Typical particle size values of graphite samples
|
Sample |
D10 (μm) |
D50 (μm) |
D90 (μm) |
|
Sample A |
4.264 |
6.804 |
10.49 |
|
Sample B |
9.220 |
15.98 |
27.18 |
|
Sample C |
11.60 |
23.72 |
39.98 |
The particle size changes lithium-intercalation performance which reflects in initial reversible capacity, irreversible capacity, and cyclic performance of the LIBs. The study indicates that as particle size increases, the initial irreversible capacity decreases. The reversible capacity rises as the particle size increases and peaks at 20 μm. The 20 μm graphite sample has the best energy-accumulation performance among the 13 – 80 μm graphite samples [1]. Sample B and Sample C have D50 values close to 20 μm, which are expected to be better than Sample A in energy storage.
Particle Shape
The Bettersizer S3 Plus can analyze shape parameters by using dynamic image analysis alone. The circularity of threegraphite samples is measured, and the results are shown in Table 2. The medium circularity (C50) of three graphite samples is 0.862, 0.896 and 0.876, respectively. The tapped density of Sample B (1.01 g/mL) is higher than other two graphite samples.
Table 2. Circularity and tapped density of graphite samples
|
Sample |
Circularity |
Tapped Density (g/mL) |
||
|
C10 |
C50 |
C90 |
||
|
Sample A |
0.813 |
0.862 |
0.917 |
0.85 |
|
Sample B |
0.842 |
0.896 |
0.950 |
1.01 |
|
Sample C |
0.774 |
0.876 |
0.924 |
0.95 |
The anode tends to hold more energy when it has a high volumetric energy density, impacted by tapped density. In anode manufacturing, an ideal tapped density for spherical graphite is higher than 1 g/mL [2]. The tapped density increases as particle size increases, so Sample A has the smallest particle size with the smallest tapped density. Not only particle size but also the shape of the raw materials could influence the tapped density. According to the studies, the tapped density has a positive correlation with circularity [3], which interpret that Sample B (1.01 g/mL) has a larger tapped density than Sample C (0.95 g/mL). Based on the tapped density and particle size results, the Sample B sample is anticipated to have the best energy-holding capacity among all three samples.
Repeatability
Repeatability is an important parameter of particle size measurement. According to Figure 3, the three replicates of Sample C have almost close particle size distributions.
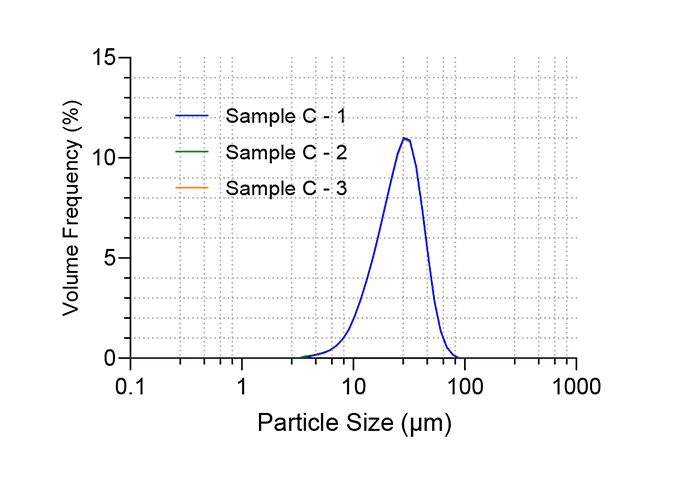
Figure 3. Repeatability of Sample C
|
Samples |
D10 (μm) |
D50 (μm) |
D90 (μm) |
|
Sample C-1 |
11.60 |
23.72 |
39.98 |
|
Sample C-2 |
11.55 |
23.74 |
40.09 |
|
Sample C-3 |
11.54 |
23.76 |
40.24 |
|
Repeatability |
0.28% |
0.08% |
0.33% |
Table 3. Repeatability of typical particle size values
Table 3 shows the repeatability of typical values of Sample C. The repeatability for the D10, D50 and D90 size values are 0.28%, 0.08% and 0.33%, respectively. The Bettersizer S3 Plus is reliable with its high repeatability.
Conclusion
Particle size and shape are two main parameters that determine the energy storage capacity for the anode in LIBs, which should be monitored and controlled within an optimal range to improve the efficiency of manufacturing process. According to the Chinese Standard of GB/T 38887-2020, the circularity and particle size of graphite should be measured by the dynamic image method and the laser diffraction method, respectively [4]. The traditional method requires at least two instruments to obtain the particle size and shape results individually. The Bettersizer S3 Plus, with laser diffraction and dynamic image technology in one instrument, is the optimal selection for manufacturers to obtain particle size and shape results in one single measurement.
Reference
[1] Chen, J., Zhou, H., Chang, W., & Ci, Y. (2003). Effect of Particle Size on Lithium Intercalation Performance of Graphite Anode. Acta Physico-Chimica Sinica, 19(03), 278-282.
[2] Yan, C., Zhang, M., & Lin, Y. (2015). Effect of Graphite Particle Size on Tap Bulk Density. Non-Metallic Mines, 38(3).
[3] Teng, D., Li, P., Yuan, N., Lyu, J., Chen, J., Lin, L., & Chen, H. (2021). Process para meters optimization of natural graphite spheroidization. China Powder Science and Technology, 27(4).
[4] GB/T 38887-2020 - spherical graphite.
About the Author
 |
Xiurong Qiu Application Engineer @ Bettersize Instruments |
|
Unlock the secrets to high-performance Lithium-ion batteries with the collection of SEVEN battery application notes. (pdf) |
 |
LOGIN TO ACCESS EXCLUSIVE CONTENT
More Resources Including
- Application Notes & Collections
- Webinars & Workshops
- Presentations & Videos
- Monthly Newsletters
- Exclusive Events...
