Thickness Analysis of Soybean Meal Using the BeVision D3
2026-05-20Application Note
Abstract: Soybean meal flake thickness critically influences solvent penetration, extraction efficiency, and overall product quality in soybean oil production. This study employs the BeVision D3 dynamic image analyzer to capture high-throughput cross-sectional images of soybean meal flakes during free-fall. The results demonstrate excellent repeatability (CV = 1.90%) and accurate thickness characterization, enabling robust quality control, process optimization, and improved solvent extraction performance.
Keywords: Soybean meal, Flake thickness, Thickness distribution, Dynamic image analysis, BeVision D3, Solvent extraction, Quality control, Process optimization
| Product | BeVision D3 |
| Industry | |
| Sample | Soybean meal |
| Measurement Type | Particle Size, Particle Shape |
| Measurement Technology |
Soybean meal is a high-protein by-product obtained after soybeans undergo crushing, flaking, and subsequent oil extraction through solvent extraction or mechanical pressing. In soybean oil processing, a primary objective is to maximize oil yield while minimizing residual oil content in the meal. Among various process parameters, the thickness of soybean meal flakes is a critical factor influencing solvent penetration efficiency, extraction effectiveness, and overall product quality.
Traditional measurement of flake thickness is typically performed manually using calipers or thickness gauges. While straightforward, these methods suffer from low measurement efficiency, and limited sample representativeness due to small sampling sizes and operator variability.
Dynamic image analysis technology provides a non-contact, automated, and high throughput alternative for thickness measurement. It enables simultaneous characterization of flake thickness and particle morphology across a large number of particles, significantly improving test efficiency and data reliability. This approach offers robust support for precise quality control and process optimization in soybean meal production.
Measurement Methods
A BeVision D3 particle size and shape analyzer equipped with a BV-F10 Free Fall dispersion unit was used to accurately measure the thickness distribution and morphological characteristics of soybean meal samples.
|
Dispersion method |
Free fall |
|
Camera |
5-megapixel CMOS |
|
Feeding rate |
Automatic |
|
Parameter |
Thickness XE |
|
Test duration |
8 mins |
Results and Discussion
Particle Size Analysis
The equivalent thickness parameter XE was selected to characterize the flake thickness of soybean meal. XE is based on the projected area and perimeter of each particle according to the following formulas:
A = XE · XLG
P = 2(XE + XLG)
where A is the projected area of the particle and P is the projected perimeter, and XLG is the corresponding orthogonal dimension of the particle.
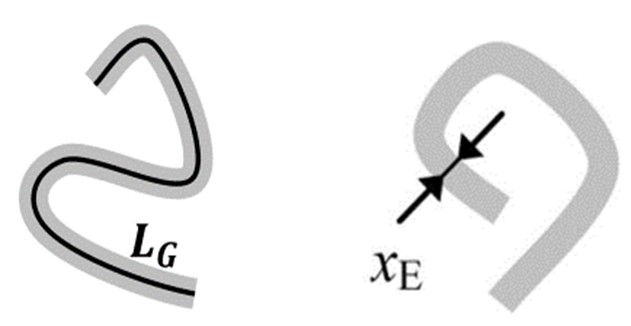
Figure 1. The definition of thickness parameter XE
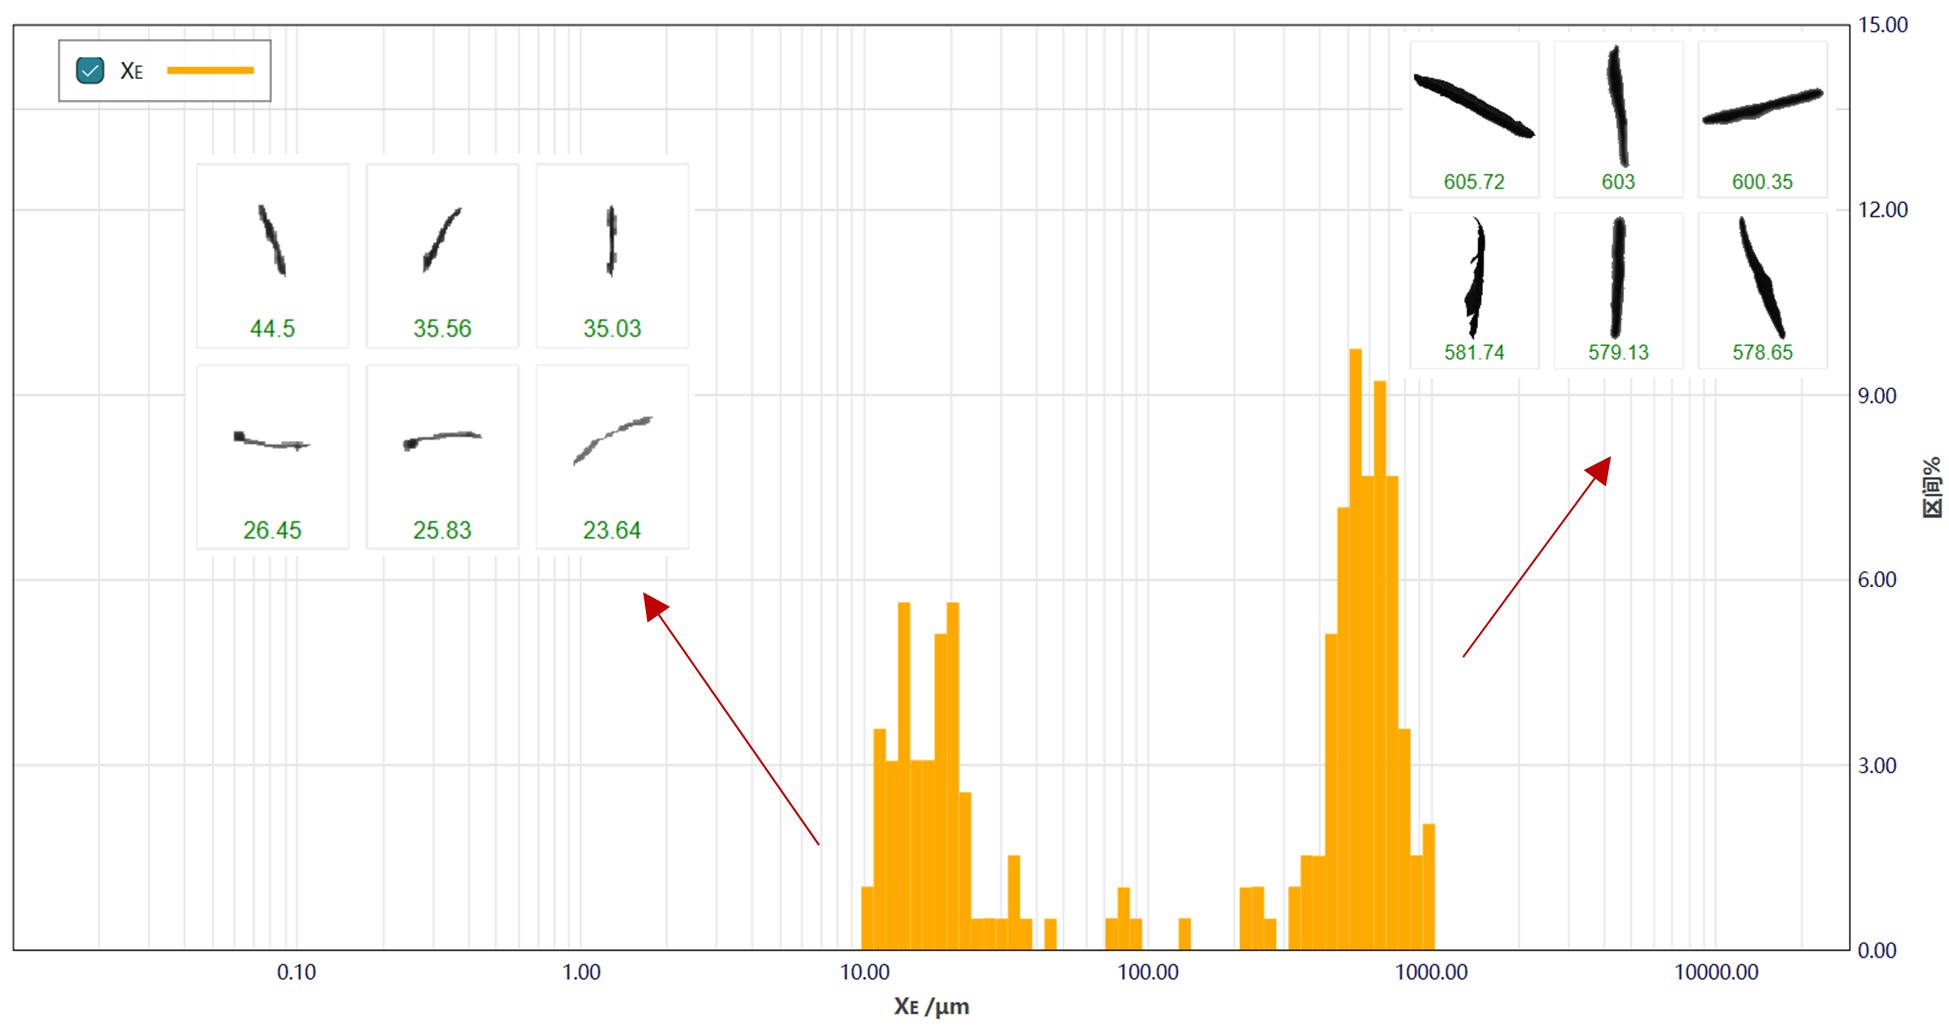
Figure 2. Thickness distribution of soybean meal
Figure 2 presents the thickness distribution of the soybean meal sample. The majority of particles fall within the thickness range of 200-1000 μm, indicating a relatively broad but practical distribution for industrial processing. A small proportion of particles below 200 μm is observed, representing fine fragments that may influence extraction efficiency and downstream handling.
Table 1. Results of three repeatability tests
|
|
Test 1 |
Test 2 |
Test 3 |
Average |
Std. dev. |
Repeatability |
|
μ0(XE) |
365.77μm |
379.01μm |
376.87μm |
373.88 μm |
7.11 μm |
1.90% |
The results demonstrate excellent measurement repeatability. The average flake thickness obtained from three independent tests is 373.88 μm, with a coefficient of variation (CV) of 1.90%. According to commonly accepted industry criteria, a CV ≤ 2% is considered excellent, confirming that the method provides high precision, strong repeatability, and reliable data for routine analysis.
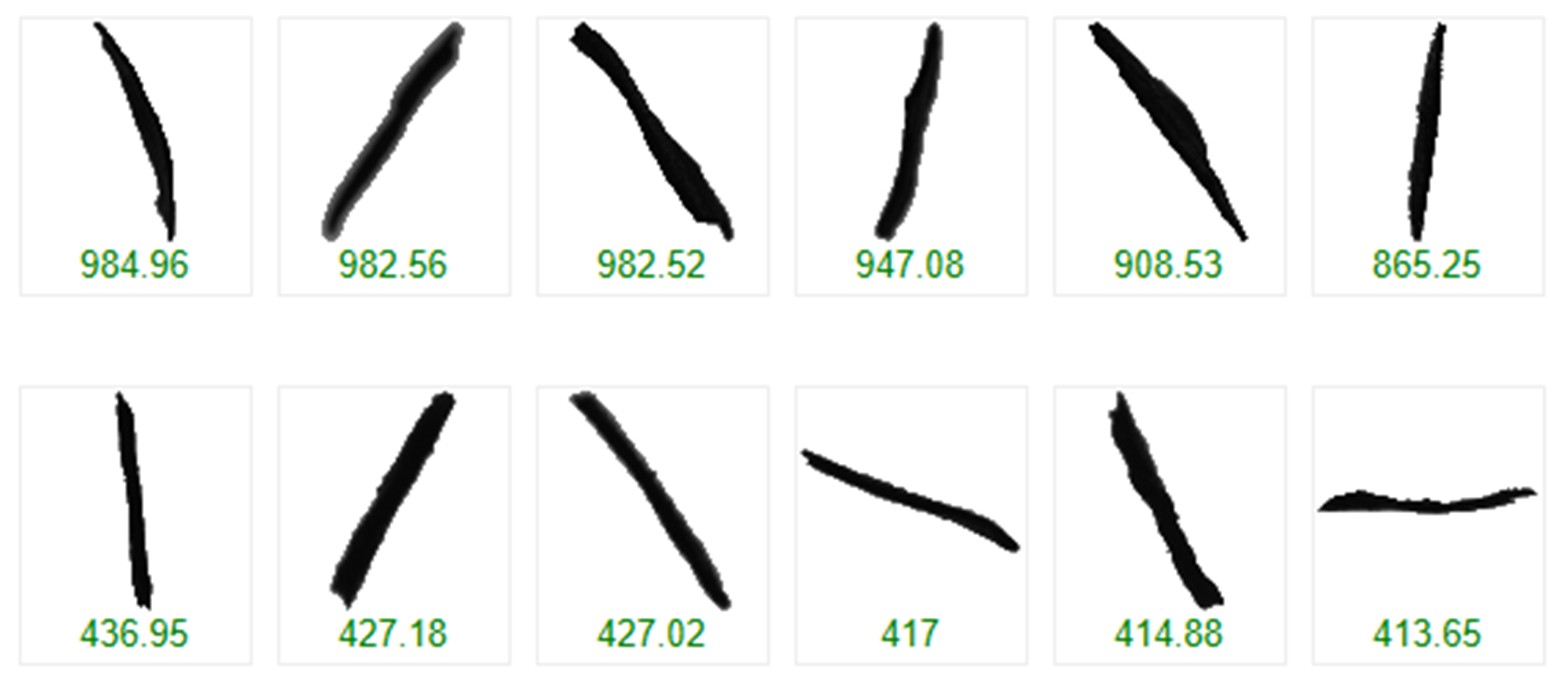
Figure 3. Cross-sectional images of soybean meal flakes (XE>200 μm)
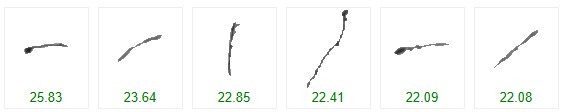
Figure 4. Cross-sectional images of soybean meal flakes (XE<200 μm)
The particle images further illustrate that most flakes exhibit relatively uniform thickness with intact structure, supporting consistent solvent penetration during extraction.
Process Evaluation
The measured results fall within the typical thickness range for soybean meal used in solvent extraction processes:
Typical soybean meal thickness: 250-400 μm
The average thickness of ~374 μm indicates that the sample is well-aligned with standard processing requirements, enabling efficient solvent diffusion while maintaining structural integrity.
Industry guideline for repeatability (CV):
- CV ≤ 2%: Excellent, recommended quality control target
- 2% < CV ≤ 5%: Good, industrially acceptable
- 5% < CV ≤ 10%: Fair, large error, for reference only
- CV > 10%: Poor, re-sampling required
Conclusion
The BeVision D3 particle size and shape analyzer enables rapid and automated characterization of soybean meal flake thickness through non-contact measurement and high-throughput image capture. By analyzing a large number of particles in a single test, the method ensures superior representativeness compared to traditional manual techniques.
The results demonstrated excellent repeatability (CV = 1.90%) and reliable thickness characterization, providing a robust basis for soybean meal quality control. This approach supports optimization of the flaking process, improves solvent extraction efficiency and contributes to reducing residual oil content in soybean meal.
Overall, the method offers an efficient, accurate and data-rich solution for modern soybean processing and quality management.
About the Authors
 |
Lisa Wang |
 |
Echo Cao |
|
|
|
|
|
BeVision D3Advanced Image Analyzer
|
|
LOGIN TO ACCESS EXCLUSIVE CONTENT
More Resources Including
- Application Notes & Collections
- Webinars & Workshops
- Presentations & Videos
- Monthly Newsletters
- Exclusive Events...

Recommended articles
Rate this article