
Particle Size and Shape Characterization of Solder Powders in Advanced Electronics Manufacturing
2026-07-24Application Note
Abstract: The rapid growth of artificial intelligence (AI) computing is driving increased demand for high-density printed circuit boards (PCBs), advanced semiconductor packaging, and fine-pitch surface mount technology (SMT) assembly. As a result, tin-based solder powder quality becomes increasingly critical to printing performance and assembly reliability. In particular, both particle size distribution and particle shape must be carefully controlled to ensure consistent processing behavior. In this study, laser diffraction and static image analysis were combined to characterize tin-based powder samples. The results demonstrate how particle size distribution and particle shape provide complementary information for solder powder evaluation and quality control. This integrated approach enhances the ability to monitor and control powder performance in advanced electronics manufacturing.
Keywords: Solder alloy powder, Tin powder, Solder paste, Particle size distribution (PSD), Particle shape, Circularity, Laser diffraction, Static image analysis, Surface mount technology (SMT)
| Product | Bettersizer 2600 Plus, BeVision M1 |
| Industry | Electronics and Semiconductors |
| Sample | Tin-based solder alloy powder |
| Measurement Type | Particle Size, Particle Shape |
| Measurement Technology | Laser Diffraction, Static Light Scattering |
Introduction
The rapid growth of AI servers, high-performance computing (HPC), and advanced electronic devices is increasing demand for high-density printed circuit boards (PCBs), advanced packaging technologies, and fine-pitch surface mount technology (SMT) assembly. These applications require ever-smaller components, higher interconnect density, and enhanced solder joint reliability, placing stringent requirements on solder paste printing performance.
Tin-based solder powder is a finely ground metal alloy used as the primary component of solder paste. Unlike traditional solder wire, which is melted and fed by hand, solder paste is applied to a joint in advance. When heated, the flux cleans oxidation from the metal surfaces, while the microscopic metal particles melt together to form a strong, conductive joint. The size and shape of the metal particles in solder paste determine how well the paste will “print.” Solder powder particles are typically spherical, which helps reduce surface oxidation and ensures good joint formation with adjoining metal surfaces. Irregularly shaped particles are generally avoided because they tend to clog the stencil and cause printing defects. To produce a high-quality solder joint, the metal spheres must have a highly uniform size and a low level of oxidation.
In particular, particle size distribution (PSD) plays a key role in stencil printing performance, transfer efficiency, and solder joint formation. To standardize powder selection, IPC J-STD-005A defines solder powder classifications based on particle size ranges, ensuring compatibility with specific SMT processes [1]. However, particle size alone is insufficient to fully characterize solder powder quality.
Since solder powders are ultimately formulated into solder paste, particle morphology is another important factor affecting paste performance. Characteristics such as particle shape and surface texture influence rheological behavior, including viscosity, thixotropy, stencil release, and printing consistency. Variations in particle shape can therefore affect both process stability and final assembly quality.
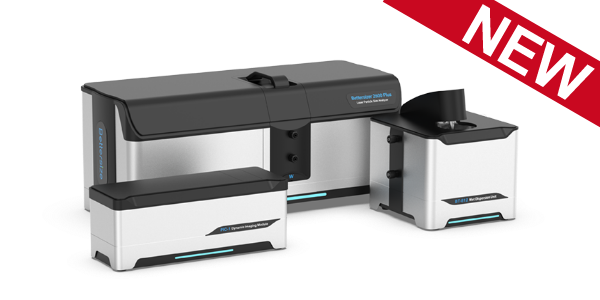
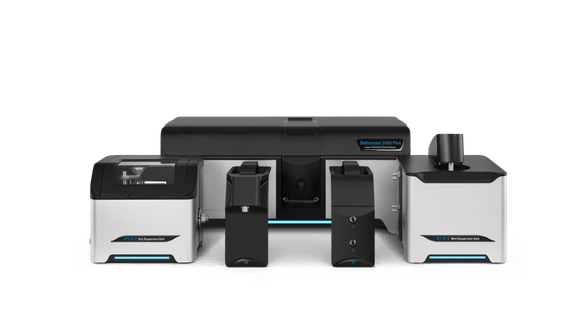
For this reason, a comprehensive evaluation of solder powder should include both particle size and particle shape analysis. In this study, the Bettersizer 2600 Plus laser diffraction analyzer and the BeVision M1 static image analyzer were used to evaluate tin-based solder powder samples, demonstrating the advantages of integrating size and shape measurements for improved quality control in advanced SMT applications。
 |
 |
| Bettersizer 2600 Plus | BeVision M1 |
Particle Size and Shape Requirements for Solder Powders
Particle Size Classification
Solder powders are commonly classified according to PSD based on weight percentages within defined particle size ranges, as specified by IPC J-STD-005A. This standard ensures that solder powders are appropriately matched to specific stencil printing and assembly requirements. Typical classifications for Type 3 through Type 6 powder are summarized in Table 1.
Table 1. Typical IPC solder powder classifications based on particle size distribution.
| Type | <0.5% larger than |
≤10% between |
≥80% between |
≤10% smaller than |
| Type 3 | 60 μm | 45-60 μm | 25-45 μm | 25 μm |
| Type 4 | 50 μm | 38-50 μm | 20-38 μm | 20 μm |
| Type 5 | 40 μm | 24-40 μm | 15-25 μm | 15 μm |
| Type 6 | 25 μm | 15-25 μm | 5-15 μm | 5 μm |
As electronic devices continue to miniaturize, the industry has progressively shifted from Type 3 powders toward finer Type 4, Type 5, and Type 6 powders to support fine-pitch stencil printing and advanced packaging technologies [2,3].
A commonly used guideline for stencil printing is the 5-Ball Rule, which recommends that the smallest stencil aperture should be at least five times larger than the largest solder powder particle. This requirement ensures consistent paste transfer and reduces the risk of clogging or incomplete deposition. As stencil apertures become smaller, finer solder powders are therefore required to maintain reliable printing
performance. [2]
Particle Shape Evaluation
Particle shape is commonly quantified using circularity, a dimensionless parameter that describes how closely a particle resembles a perfect circle.
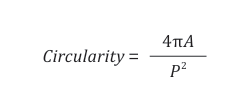
where:
A = projected particle area
P = particle perimeter
A perfect sphere, projected as a circle in two dimensions, has a circularity value of 1. As particle shape becomes more irregular or elongated, the circularity decreases. High circularity values are generally preferred for solder powders, as more spherical particles improve flowability, reduce viscosity variability, and enhance stencil release during printing.
Measurement Method
Two tin powder samples were characterized using complementary particle size and shape analysis techniques. Particle size distributions were measured by wet laser diffraction using the Bettersizer 2600 Plus, with ethanol selected as the dispersion medium to ensure effective particle dispersion and minimize agglomeration.
Particle shape was evaluated by using the BeVision M1 static image analyzer. Prior to measurement, the dry powder samples were dispersed using the BT-910 dry powder disperser to achieve proper particles separation before image acquisition.
Particle size parameters, including PSD and percentile values, were obtained from laser diffraction measurements. Particle shape descriptors, including circularity, and representative particle images were obtained from static image analysis. This combined approach enables a comprehensive assessment of both particle size and morphology.
Results and Discussion
 |
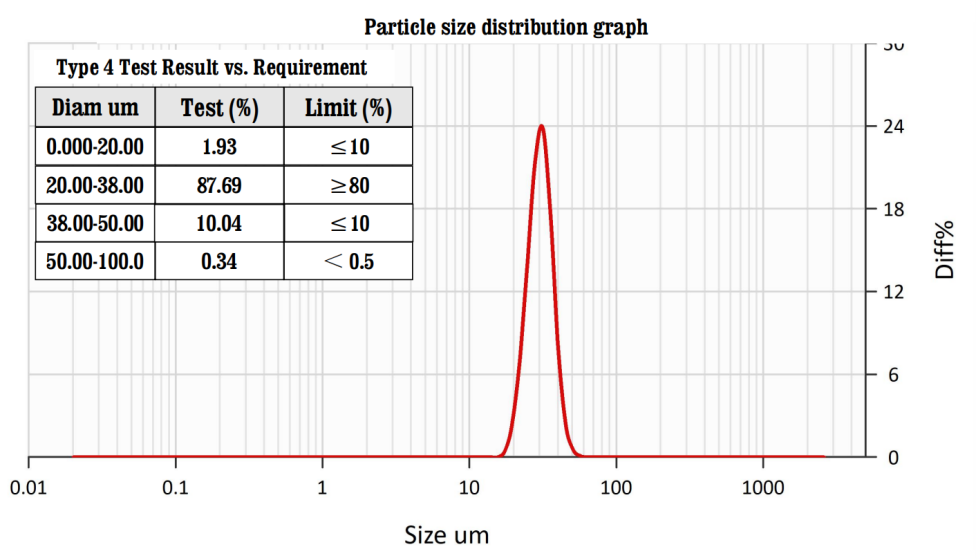 |
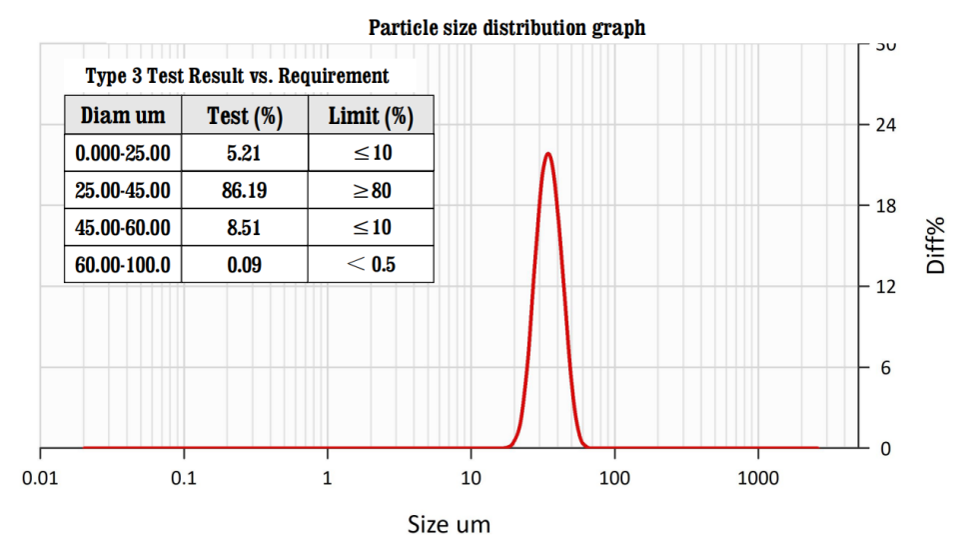
| Figure 1. PSD curves and customized IPC “Test Result vs. Requirement” reports for T3 and T4 tin powders generated by the software report editor. | |
Particle Size Distribution and IPC Type Evaluation
The particle size distributions of nominal Type 3 and Type 4 samples, designated as T3 and T4, respectively, were measured using the Bettersizer 2600 Plus. In addition to conventional PSD curves and particle size parameters, a customized report template was created using the software report editor to directly compare the measured interval percentages with IPC J-STD-005A classification requirements, as shown in Figure 1 [4, 5].
For the T3 sample, all measured interval percentages complied with the corresponding IPC limits, confirming compliance with the Type 3 classification. The results indicate effective control of both fine and coarse particle fractions.
For the T4 sample, the primary particle fraction within the 20–38 μm range reached 87.69%, exceeding the IPC minimum requirement of 80%. The proportions of particle fractions below 20 μm and above 50 μm also satisfy the specified limits. However, the fraction within the 38–50 μm range was measured at 10.04%, slightly exceeding the IPC limit of 10%. Therefore, the T4 sample slightly failed to meet the Type 4 requirement for the 38–50 μm fraction.
By transforming conventional PSD data into interval-based comparisons aligned with IPC criteria, customized reporting allows users to directly assess compliance with industry or customer specifications and quickly identify specific particle size fractions requiring process optimization.
Particle Shape Characterization
Particle shape was automatically analyzed using the BeVision M1 static image analyzer. The circularity results of the T3 and T4 tin powder samples are summarized in Table 2.
Table 2. Circularity results of T3 and T4 tin powder samples
| Sample | T3 | T4 |
| Particle Number | 4742 | 5111 |
| Average Circularity | 0.929 | 0.905 |
| C10 | 0.877 | 0.850 |
| C50 | 0.934 | 0.912 |
| C90 | 0.952 | 0.934 |
| Cmax | 0.957 | 0.955 |
| Cmin | 0.710 | 0.793 |
The T3 sample exhibits a higher average circularity of 0.929, indicating a more spherical particle shape. In contrast, the T4 sample shows a lower average circularity of 0.905 and a slightly broader circularity span, suggesting a greater degree of particle irregularity.
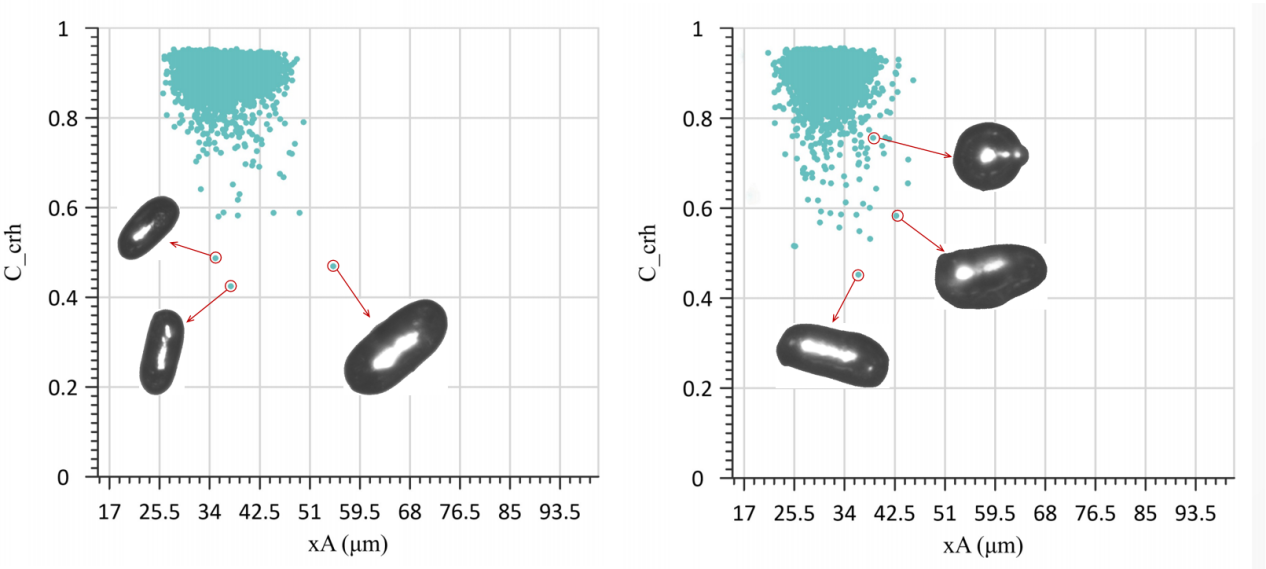
Figure 2. Circularity versus particle size of T3 and T4 tin powders measured by BeVision M1.
Representative irregular particles and satellite particles are highlighted.
While particle size distribution provides the basis for IPC classification, static image analysis reveals shape differences that are not reflected in PSD data alone. In particular, the presence of irregular particles and satellite particles, especially in the T4 sample, highlights the importance of particle shape characterization. These shape variations can significantly influence powder flowability, paste rheology, and printing consistency, underscoring the value of combining size and shape analysis for comprehensive solder powder quality evaluation.
Conclusion
The combination of laser diffraction and static image analysis provides a robust and practical workflow for comprehensive characterization of solder powders. The Bettersizer 2600 Plus rapidly determines particle size distribution, while supporting direct evaluation against IPC standards through customized interval-based analysis.
The BeVision M1 complements this by directly measuring individual particle shape and quantifying particle shape characteristics such as circularity.
By integrating particle size and shape measurements, these techniques provide complementary information. This combined approach enhances process understanding and supports more effective solder powder development, quality control, and optimization for advanced SMT applications.
References
- [1] IPC J-STD-005A, Requirements for Soldering Pastes, IPC, 2012.
- [2] T. Lentz, “Size Matters: The Effects of Solder Powder Size on Solder Paste Performance,” SMTA Proceedings, 2019.
- [3] T. O’Neill and G. Towell, “Solder Paste Powder: When to Downsize,” Circuits Assembly, 2024.
- [4] Bettersize Particle Analysis Report, Solder powder (Tibased alloy), 01PSD074: https://www.bettersizeinstruments.com/learn/particle-analysis-report/01psd074/
- [5] Bettersize Particle Analysis Report, Solder powder (Tibased alloy), 01PSD075: https://www.bettersizeinstruments.com/learn/particle-analysis-report/01psd075/
About the Author
 |
Perfil Liu Senior Application Engineer @ Bettersize Instruments |
Bettersizer 2600 PlusAdvanced Particle Size and Shape Analyzer
|
 |
LOGIN TO ACCESS EXCLUSIVE CONTENT
More Resources Including
- Application Notes & Collections
- Webinars & Workshops
- Presentations & Videos
- Monthly Newsletters
- Exclusive Events...

Recommended articles
Rate this article