
Particle Size and Shape Analysis of Alloy Powders Using the BeVision D3 Pro
2026-09-14Application Note
Metal and alloy powders are critical feedstocks for advanced manufacturing technologies including additive manufacturing (3D printing), powder metallurgy, metal injection molding (MIM) and thermal spraying. Driven by the explosive expansion of artificial intelligence computing infrastructure, increasing demand for high-density printed circuit boards (PCBs), advanced semiconductor packaging and fine-pitch surface-mount technology (SMT) assembly, as a result, quality requirements for tin-based solder powders have become increasingly stringent, as powder characteristics directly influence printing consistency, assembly yield, and long-term product reliability.
Key particle attributes such as particle size, circularity and aspect ratio (length-to-width, L/W ratio) have a significant impact on powder flowability, tap density, sintering behavior, and the quality of finished components. Metal powders produced by gas atomization or water atomization often contain shape defects, including elongated particles, irregular fragments, satellites, and agglomerates. When present in excessive amounts, these particles can adversely affect powder spreading uniformity, packing efficiency, and process stability.
Dynamic image analysis (DIA) enables rapid and statistically robust characterization of powder shape by capturing images of large particle populations and simultaneously measuring particle size and shape parameters, including circularity and aspect ratio. The technique automatically eliminates out-of-focus particles and other invalid measurements, ensuring reliable and representative results. By providing comprehensive particle size and morphology data, DIA supports powder production optimization, incoming material quality control, process validation and the consistent manufacture of high-performance metal components.
Measurement Methods
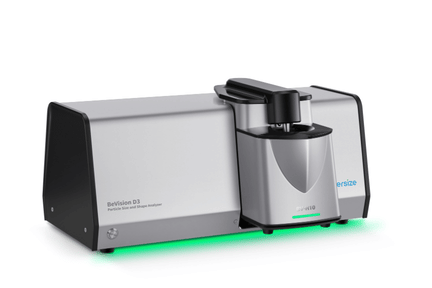
A BeVision D3 Pro dynamic image particle size and shape analyzer equipped with a BV-H10 Hydro dispersion unit was used to simultaneously characterize the particle size and shape of a tin-silver-copper (SAC) alloy powder sample.
Table 1. Measurement conditions
|
Dispersion method |
Wet circulation |
|
Medium |
Water |
|
Dispersant |
None |
|
Number of particles analyzed |
100,000 pcs |
|
Measurement time |
2.5 mins |
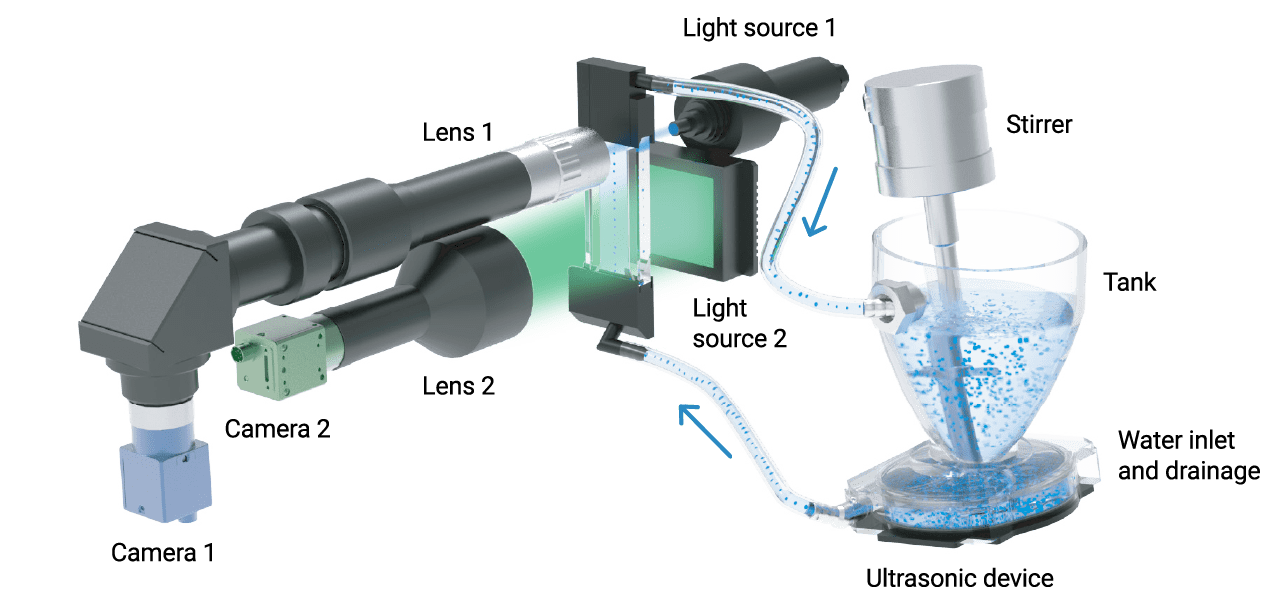
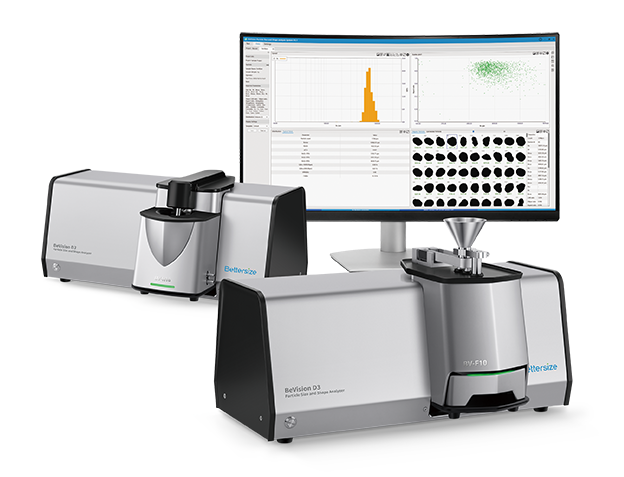
BeVision D3 Pro system configuration for DIA of alloy powders
Results and Discussion
Particle Size Analysis
The area-equivalent diameter X_A was employed to characterize the particle size of the alloy powder. The area-equivalent diameter is defined as the diameter of a circle with the same area as the particle projection. Because most atomized metal powder particles exhibit near-spherical shapes, the area-equivalent diameter provides an effective and intuitive measure of particle size.
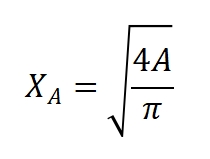
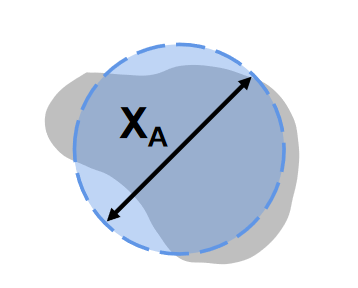
Figure 1. Definition of Area-Equivalent Diameter XA
As shown in Figure 2, the SAC alloy powder exhibits a narrow particle size distribution, with the majority of particles concentrated in the 20–38 μm range. This size range corresponds to Type 4 solder powder, which is widely used in fine-pitch SMT printing applications. The absence of a significant coarse particle tail and the low percentage of ultrafine particles indicate good particle size control, reducing the risk of printing defects such as stencil clogging, inconsistent paste deposition, and solder bridging.
The six replicate measurements demonstrated excellent repeatability, with standard deviations of only 0.05–0.06 μm for D10, D50 and D90. All repeatability values were below 0.5%, confirming the effectiveness of the wet circulation dispersion system and the stability of the high-speed imaging process.
A single measurement can analyze hundreds of thousands to millions of particles, providing highly representative particle statistics. For this narrow-distribution SAC powder sample, analysis of 100,000 particles required only 2.5 minutes, significantly improving measurement efficiency compared with conventional static image techniques, which typically evaluated only a few thousand particles per measurement. The large particle population reduces statistical uncertainty and improves confidence in the reported particle size distribution.
In addition, BeVision D3 Pro incorporates an advanced image clarity detection algorithm that automatically identifies and excludes out-of-focus particle images from the analysis. By eliminating invalid particle measurements, the system delivers accurate and reliable D10/D50/D90 results, making it well suited for incoming material inspection, process monitoring, and batch-to-batch consistency verification of SAC solder powders.
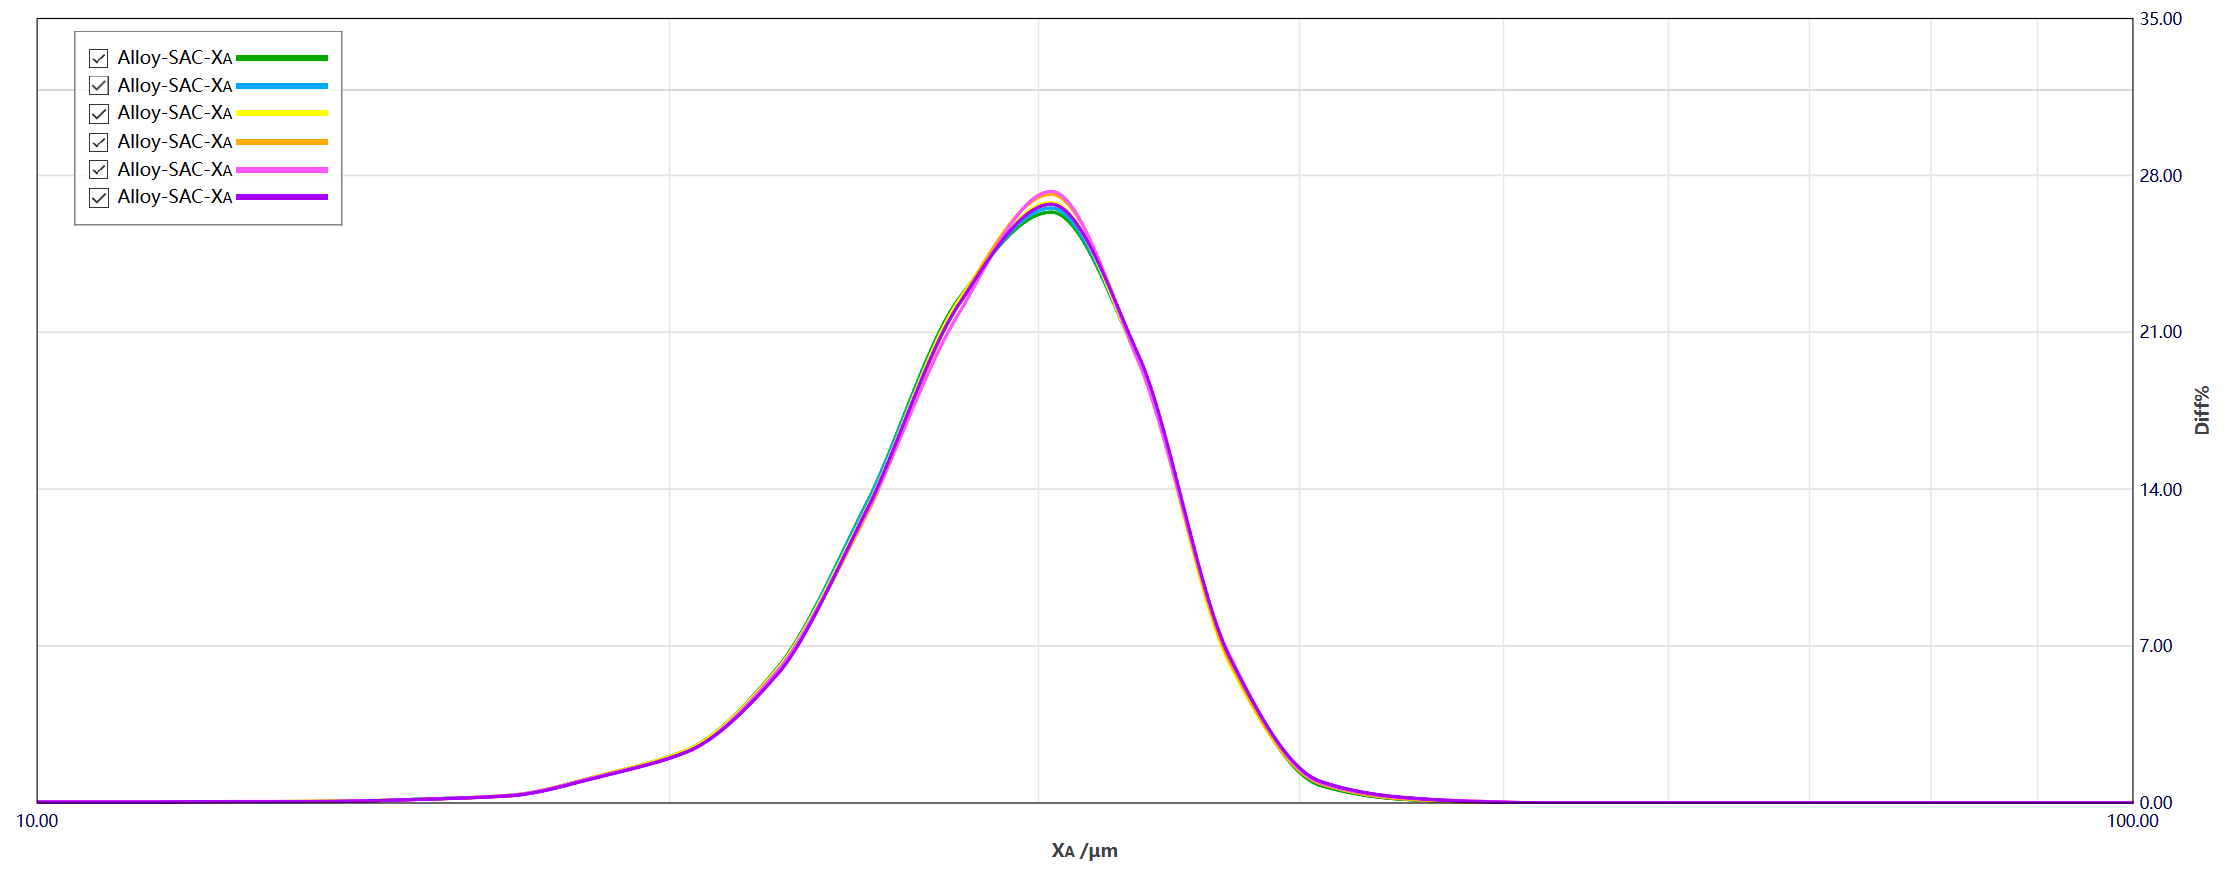
Figure 2. Particle size distribution of the SAC alloy powder
Table 2. Volume-based particle size distribution
|
Size range |
Volume fraction |
|---|---|
|
> 50 μm |
0.00% |
|
38-50 μm |
1.63% |
|
20-38 μm |
96.02% |
|
≤ 20 μm |
2.35% |
Table 3. Repeatability results from six consecutive measurements
|
|
Mean value |
Std. dev |
Repeatability |
|---|---|---|---|
|
D10 |
23.63 μm |
0.05 μm |
0.21% |
|
D50 |
29.37 μm |
0.05 μm |
0.17% |
|
D90 |
34.67 μm |
0.06 μm |
0.17% |
Length-to-Width Ratio Analysis
The length-to-width ratio (L/W ratio) is defined as the ratio of the length to the width of a particle’s minimum bounding rectangle. As a dimensionless shape parameter, the L/W ratio provides a quantitative measure of particle elongation and shape irregularity.
L/W ratio = XLength / XWidth
Figure 3. Definition of Length-to-Width (L/W) Ratio
For SAC solder powders, the L/W ratio is a critical indicator of elongated and irregular particles. A high proportion of particles with elevated L/W ratios can adversely affect solder paste thixotropy, causing defects such as poor paste release, slumping, and tailing during stencil printing. In addition, elongated particles may contribute to process-related issues during reflow soldering, including void formation and inconsistent solder joint quality. In general, high-quality electronic-grade solder powders are expected to exhibit an average L/W ratio of 1.2 or below, with the volume fraction of particles having L/W ratio greater than 1.5 maintained below 3%. Particles with L/W ratios greater than 2.0 are considered highly undesirable and should be minimized.
The BeVision D3 Pro calculates the L/W ratio of each individual particle and automatically generates size-versus shape scatter plots to visualize the relationship between particle size and shape. By combining particle images with quantitative shape data, the system enables rapid identification of elongated particles, fragments, and other shape outliers. As shown in Figure 4, only a small fraction of strip-shaped irregular particles is present in the analyzed sample.
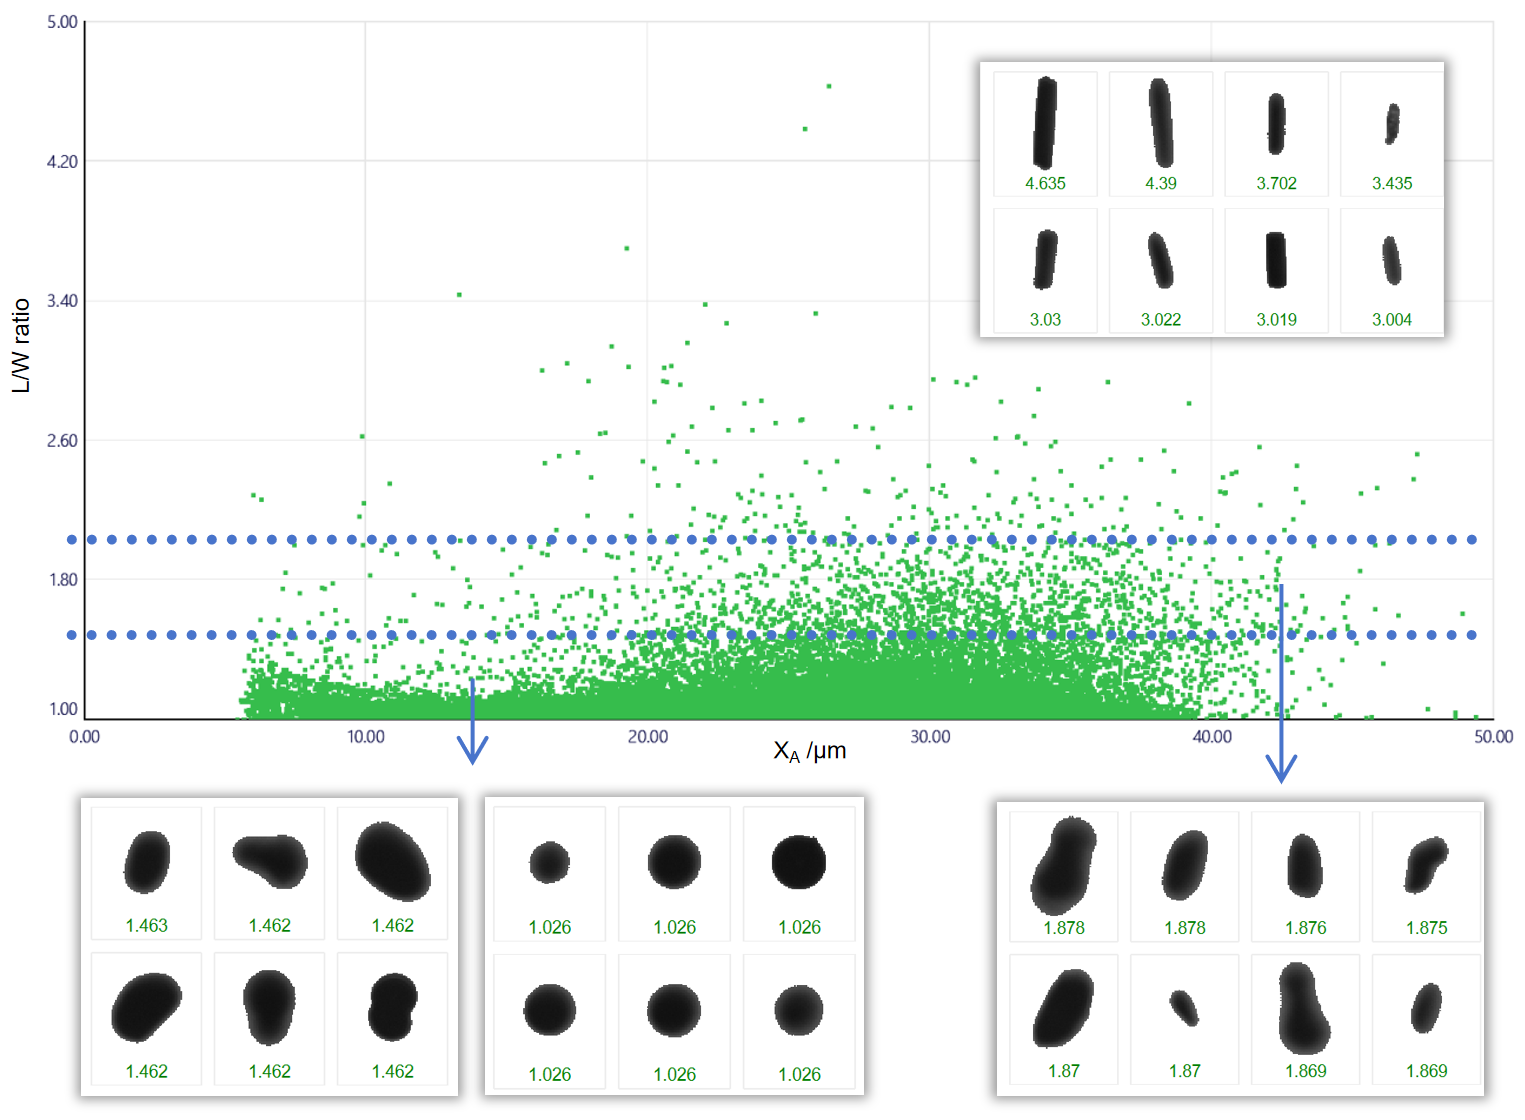
Figure 4. Area-Equivalent Diameter (X_A) vs. L/W Ratio scatter plot of SAC powder (Representative particle images and corresponding L/W Ratios)
Table 4. Volume-based distribution of particles by L/W Ratio
|
L/W ratio range |
Volume fraction |
|---|---|
|
L/W ratio ≤ 1.2 |
94.43% |
|
L/W ratio > 1.5 |
1.56% |
|
L/W ratio > 2 |
0.26% |
The results show that 94.43% of the particles exhibit a L/W ratio of 1.2 or less, satisfying requirements associated with high-quality electronic solder powders. Particles with L/W ratios greater than 1.5 account for only 1.56% of the total volume, while needle-like particles with L/W ratio greater than 2.0 represent only 0.26%. These findings indicate that the sample contains a very low proportion of irregular particles and exhibits excellent overall particle shape.
Unlike laser diffraction which only provides particle size information, but cannot directly characterize particle shape, the BeVision D3 Pro simultaneously measures both particle size and shape. This capability enables quantitative assessment of elongated particles and other shape-related defects that may impact printing and soldering performance. The resulting data can be used for incoming material inspection, supplier qualification, process monitoring, and optimization of atomization and powder conditioning processes to ensure consistent powder quality and manufacturing performance.
Circularity Analysis
Circularity C_crh is defined as the ratio of the maximum inscribed circle diameter to the minimum circumscribed circle diameter of a particle’s projected image. Circularity values range from 0 to 1, with values closer to 1 indicating a more spherical particle shape.
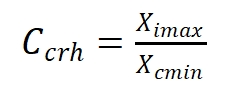
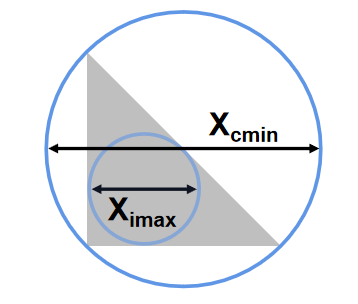
Figure 5. Definition of Circularity Ccrh
Circularity is an important parameter for evaluating particle shape quality in SAC solder powders, because it directly reflects the smoothness and regularity of particle contours. High-circularity powders generally exhibit superior flowability, packing efficiency and printing performance. For demanding applications such as automotive electronics and advanced semiconductor packaging, a minimum volume fraction of 65% of particles with circularity greater than 0.92, is typically required. Lower circularity values indicate the presence of angular particles, satellite particles or elongated fragments that can adversely affect solder paste rheology, printing consistency and assembly reliability.
The BeVision D3 Pro generated both a circularity distribution histogram and a size-circularity scatter plot, enabling simultaneous evaluation of particle size and shape characteristics. This approach allows users to determine whether shape irregularities are concentrated within specific particle size ranges and to rapidly identify problematic particle populations.
The system’s high-resolution CMOS imaging technology accurately captures particle boundaries and detects subtle shape features such as sharp edges, surface irregularities, indentations and satellite particles. The Hydro dispersion unit effectively disperses agglomerates and promotes single-particle measurement, minimizing the stacking and particle overlap commonly encountered with static imaging techniques. As a result, the instrument provides reliable and representative circularity measurements for quantitative quality assessment of solder powders.
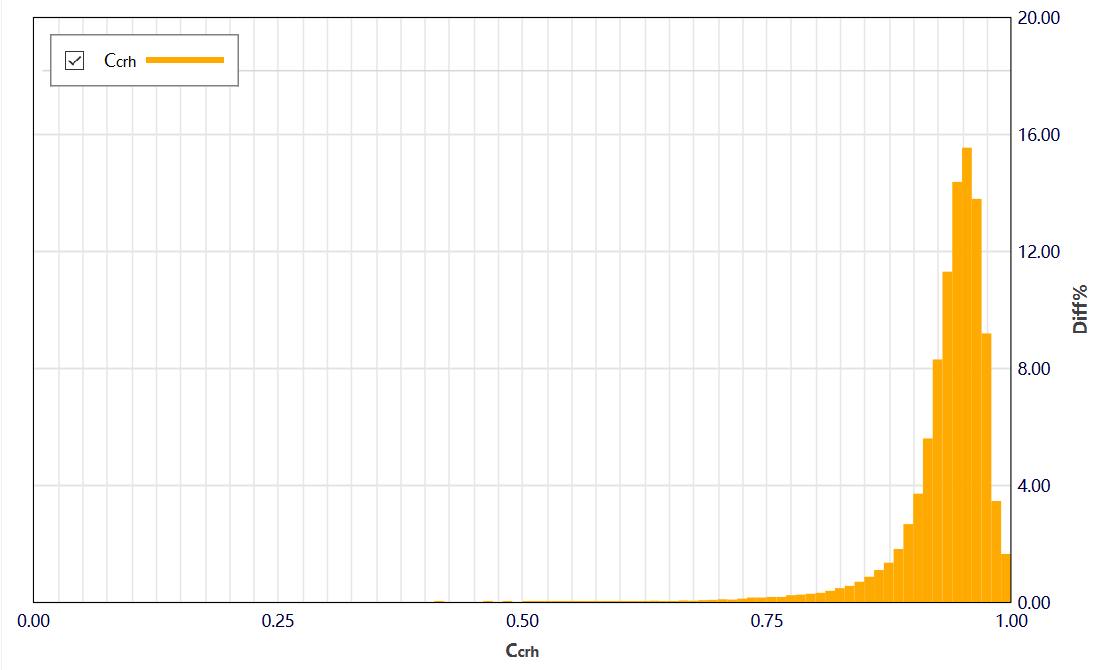
Figure 6. Circularity distribution histogram of SAC powder
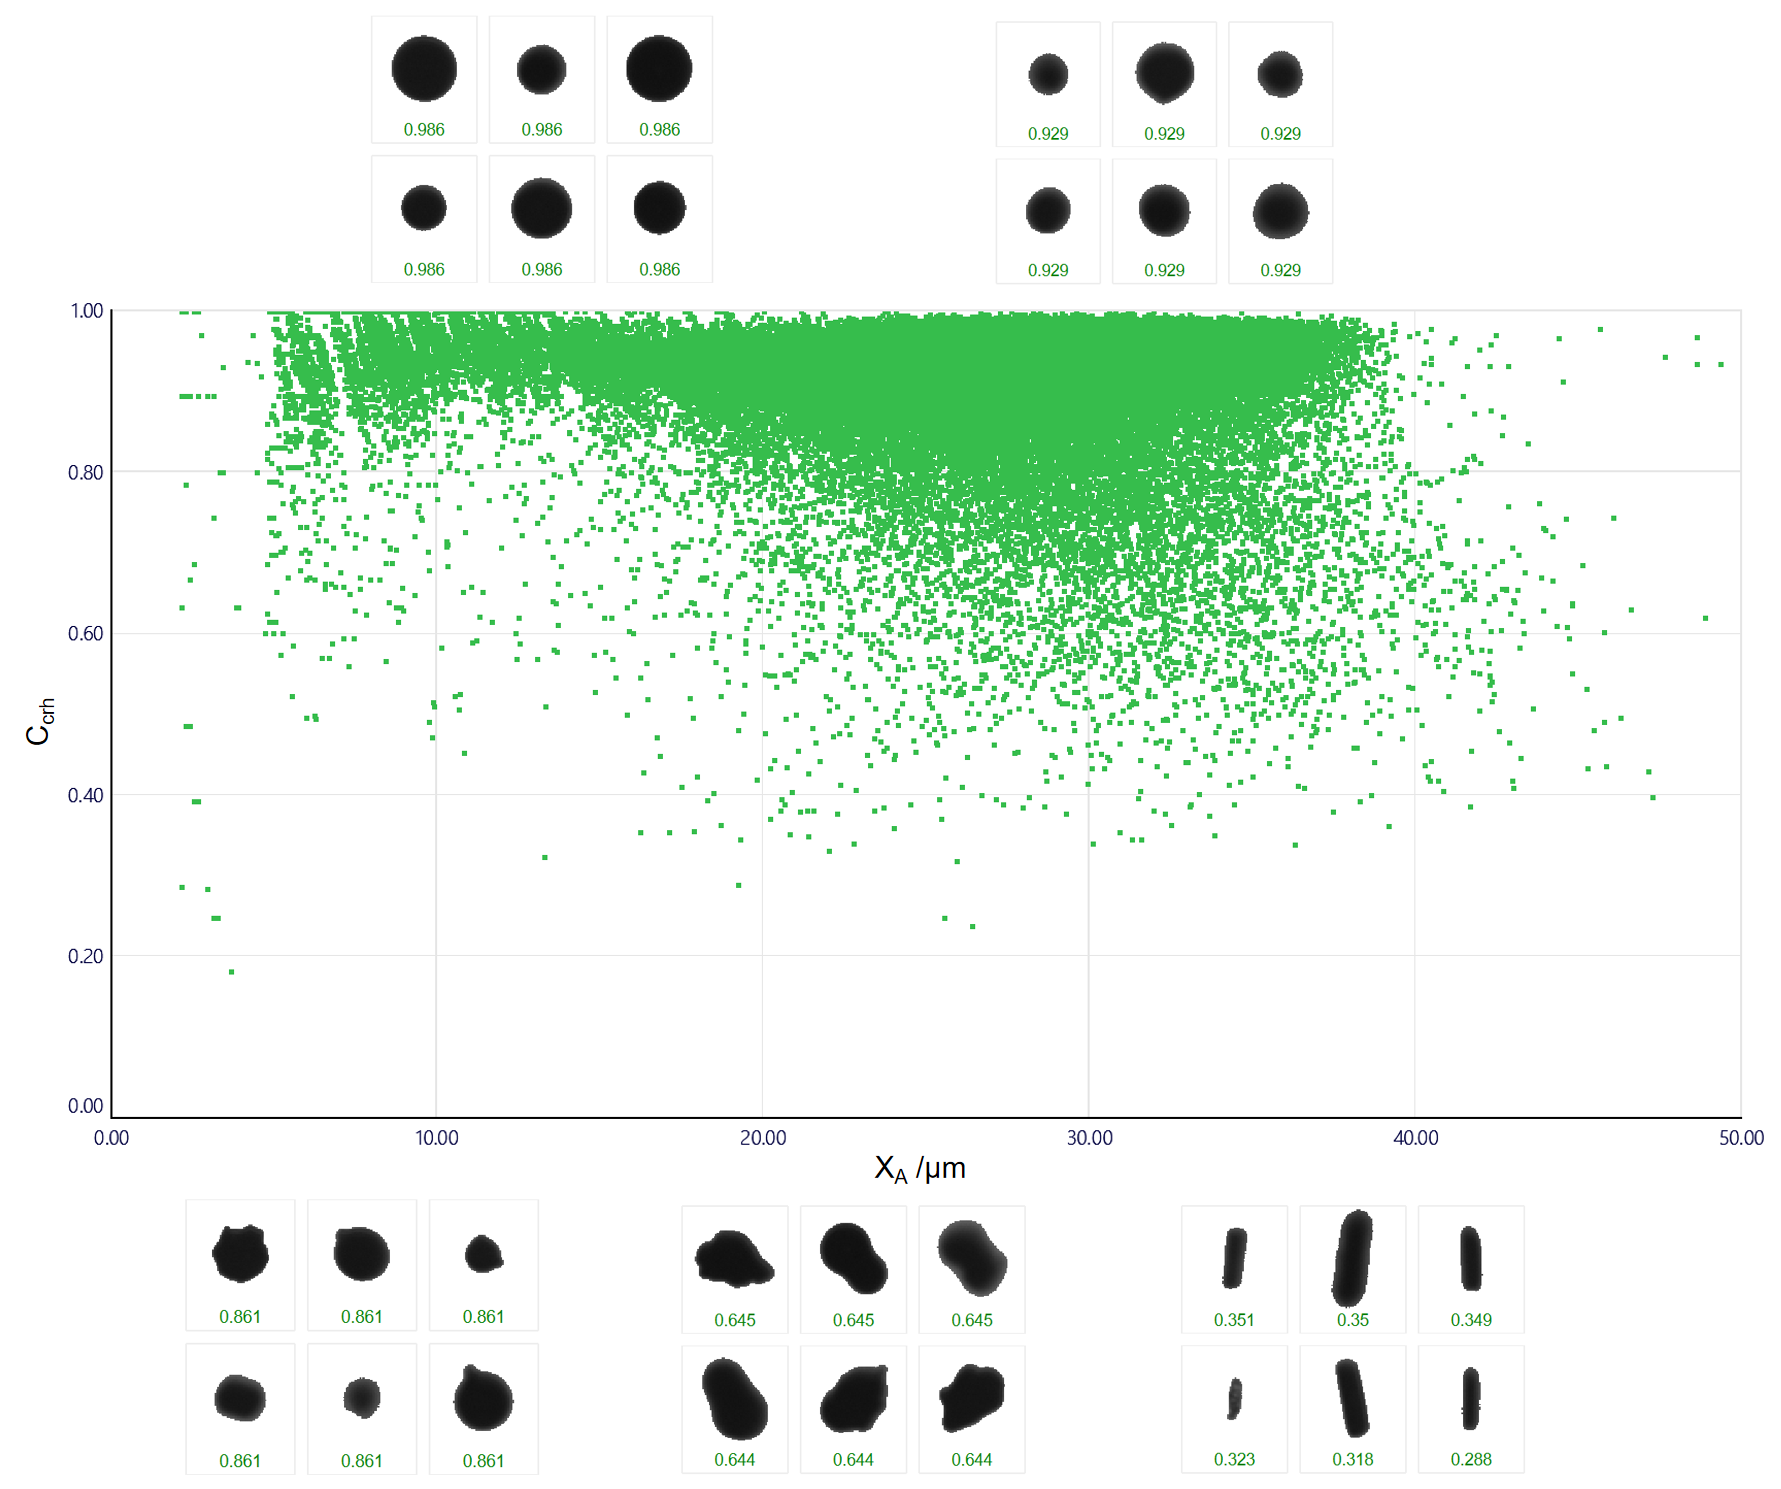
Figure 7. Area-Equivalent Diameter (XA) vs. Circularity (Ccrh) scatter plot of SAC powder (Representative particle images and corresponding circularity values)
Table 5. Volume-based distribution of particles by Circularity C_crh
|
Circularity range |
Volume fraction |
|---|---|
|
Circularity C_crh > 0.92 |
78.5% |
|
Circularity C_crh > 0.95 |
44.54% |
The results indicate that 78.50% of the particles exhibit a circularity greater than 0.92, exceeding the typical requirement for high performance SAC solder powders. Furthermore, 44.54% of the particles possess a circularity greater than 0.95, demonstrating a high degree of sphericity. Only a small fraction of particles exhibit lower circularity values, indicating minimal levels of irregular fragments, satellites, or other shape-related defects.
The size-circularity scatter plot further confirms that the majority of particles maintain high circularity across the entire particle size distribution. These results demonstrate excellent particle morphology and suggest favorable powder flowability, packing behavior, and solder paste rheology. Consequently, the analyzed SAC powder is well suited for demanding SMT applications requiring consistent printing performance and reliable solder joint formation.
Conclusion
The BeVision D3 Pro is fully compatible with wet dispersion workflows for the characterization of SAC alloy powders and provides comprehensive analysis of both particle size and shape in a single measurement.
The system delivers excellent measurement stability and repeatability, achieving repeatability values below 0.3% across six consecutive measurements. By analyzing large particle populations in a short time, it provides statistically robust data that meets the requirement of routine incoming material inspection, process monitoring, and quality control in production environments.
A key advantage of the BeVision D3 Pro is the ability to simultaneously quantify multiple particle characteristics, including area-equivalent diameter (XA), particle size distribution parameters (D10/D50/D90), length-to-width (L/W) ratio, and circularity. In addition two-dimensional scatter plots enable direct correlation of particle size and shape, providing deeper insight into powder shape and facilitating the identification of abnormal particle populations.
BeVision D3 Pro also incorporates an advanced image-quality assessment algorithm that automatically excludes out-of-focus particles from analysis, ensuring accurate and representative characterization of particle shape. When combined with the Hydro dispersion unit, the system enables efficient and reliable measurement of metal powders while accurately detecting elongated particles, fragments, satellites, and low-circularity defects.
About the Author
 |
Echo Cao Application Engineer @ Bettersize Instruments |
|
|
BeVision D3 Series
|
LOGIN TO ACCESS EXCLUSIVE CONTENT
More Resources Including
- Application Notes & Collections
- Webinars & Workshops
- Presentations & Videos
- Monthly Newsletters
- Exclusive Events...

Recommended articles
Rate this article