
Particle Size Distribution and Packing Characterization of Graded Spherical Alumina Fillers for Thermal Interface Materials
2026-09-10Application Note
Abstract
Spherical alumina is widely used as an electrically insulating and thermally conductive filler in thermal interface materials (TIMs). This study presents a characterization workflow for three commercial alumina grades and five blends. The particle size distributions of A50, A15, and A0.5 were measured by laser diffraction and used as inputs for theoretical gradation calculations based on the Dinger-Funk model, which guided blend formulation. The true densities of the component powders were determined by gas pycnometry, and the true densities of the blends were calculated from their volume fractions. Tapped densities were measured using mechanical tapping and combined with true density data to calculate dry-powder packing fractions. The resulting data were used to evaluate the relationship between particle size gradation and packing efficiency. This workflow provides a practical approach for preliminary blend screening prior to formulation-level evaluation of viscosity, filler loading, thermal performance, and reliability.
Keywords: spherical alumina; thermal interface materials; laser diffraction; tapped density; true density; packing fraction
1. Introduction
The increasing power density of AI accelerators, GPUs, high-bandwidth memory and advanced electronic packages is driving demand for more effective thermal management solutions. Thermal interface materials (TIMs) are designed to fill microscopic gaps between heat-generating components and heat sinks. In addition to high thermal conductivity and electrical insulation, practical formulations must exhibit suitable processing characteristics, including good mixing, dispensing and long-term stability.
Spherical alumina is widely used as a TIM filler because it combines electrical insulation, chemical stability, relatively high thermal conductivity, and compatability with high filler loadings. To maximize packing efficiency and minimize interparticle voids, commercial spherical alumina systems commonly combine coarse, intermediate, and fine particle populations [1], as illustrated in Figure 1. The development of multimodal filler systems typically involves three key steps.
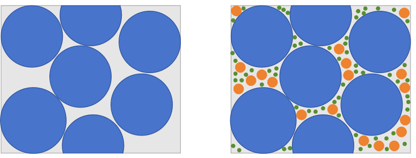
Figure 1. Schematic comparison of monodisperse and trimodal particle packing.
Particle size characterization. The particle size distributions of the available alumina grades must first be established, including their size ranges and distribution widths. This information supports the selection of complementary particle populations and provides the experimental inputs required for subsequent gradation design.
Gradation design. A particle-packing model can be used to translate particle size distribution data into a manageable set of candidate compositions. Model-guided formulation reduces empirical trial-and-error and improves screening efficiency although predicted gradations do not necessarily correspond to maximum packing in practice.
Packing characterization. The packing behavior of the individual powders and their blends must be measured experimentally to compare candidate compositions on a consistent basis.
This study addresses these three tasks sequentially. The particle size distributions of three spherical alumina powder grades were characterized by wet laser diffraction and used as inputs for Dinger-Funk-based gradation calculations[2]. True density and tapped density measurements were then used to calculate the dry-powder packing fraction of each individual powder and blend. Finally, the relationship between particle-size gradation and measured packing behavior was evaluated.
2. Materials and Methods
2.1 Materials
Three commercial spherical alumina powders with supplier-specified reported sphericities greater than 99% were used in this study. Based on their nominal D50 values of 50, 15, and 0.5 µm, the powders were designated A50, A15, and A0.5, respectively. Five blends were designed using the Dinger-Funk particle-packing model. The resulting target volume fractions were converted into mass fractions using the measured true densities of the individual powders used for sample blend preparation.
2.2 Particle Size Measurement
The particle size distributions of the three spherical alumina powders were measured by wet laser diffraction using a Bettersizer 2600 Plus equipped with a wet dispersion unit. Measurement conditions are summarized in Table 1 [3,4].
Table 1. Wet laser-diffraction measurement conditions.
|
Parameter |
Setting |
|---|---|
|
Dispersion medium |
Water |
|
Dispersant |
Sodium pyrophosphate, 0.05 wt.% |
|
Optical model |
Mie |
|
Particle refractive index |
1.76 |
|
Particle absorption index |
0.01 |
|
Medium refractive index |
1.333 |
|
Ultrasonic dispersion |
2 min at 30 W |
|
Replicate measurements |
6 |
2.3 True density, tapped density and packing fraction
The true densities of A50, A15, and A0.5 were measured by gas displacement using a BetterPyc 380 gas pycnometer [5]. Because the candidate blends were designed on a volume basis, the true density of each blend was calculated from the normalized volume fractions and measured true densities of the three component powders:
where φi is the normalized volume fraction of component i and ρi is its measured true density.
True density provides the solid-density reference for evaluating powder-bed packing. By combining it with tapped density, the influence of the solid material density can be separated from the interparticle voids within the powder bed, allowing the packing efficiencies of different alumina grades and blends to be compared on a consistent basis.
The tapped densities of the samples were measured using a powder characteristics tester PPX1 at a tapping height of 10 mm and a tapping rate of 180 taps/min for 2000 taps [6].
The dry-powder packing fraction was calculated as:
where is the measured tapped density. For an individual powder, corresponds to the measured true density.; For blended samples, is the blend true density calculated from the component volume fractions.
3. Results and Discussion
3.1 Filler Particle Size Characterization
Table 2. Particle-size distribution parameters of the three component powders.
|
Sample |
D10 |
D50 |
D90 |
|---|---|---|---|
|
A50 |
29.497 |
51.402 |
83.714 |
|
A15 |
5.642 |
14.571 |
30.472 |
|
A0.5 |
0.262 |
0.483 |
1.042 |
The particle size distributions of A50, A15, and A0.5 measured by wet laser diffraction formed distinct coarse, intermediate, and fine populations, respectively (Figure 2,Table 2). Partial overlap was observed between the A50 and A15 distributions, whereas A0.5 remained well separated from both larger grades. This separation is advantageous for multimodal packing design because it allows finer particles to occupy interstitial spaces between larger particles.
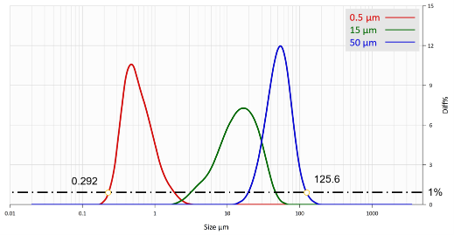
Figure 2. Particle-size distributions of A50, A15 and A0.5 measured by wet laser diffraction with the Bettersizer 2600 Plus. The horizontal line indicates the 1 vol.% cutoff used to determine the operational values of and .
3.2 Formulation Design
The Dinger-Funk particle-packing model was used to generate five candidate blends from the measured particle size distributions [2]:
where U(DP) is the cumulative volume percent finer than particle size DP, n is the distribution modulus, and Dmin and Dmax are the effective lower and upper size limits, respectively.
To define these limits, a 1 vol.% cutoff was applied to the measured differential particle size distributions, as illustrated in Figure 2 [7]. Dmin was determined to be 0.292 µm, and Dmax was determined to be 125.6 µm. These operational limits were selected instead of the absolute minimum and maximum particle sizes to minimize the influence of trace particle populations, occasional agglomerates and measurement noise.
Five distribution modulus values (n = 0.05, 0.20, 0.37, 0.55, and 0.75) were selected to generate formulations spanning a range from fine-rich to coarse-rich compositions. For each target distribution, the component volume fractions were determined by constrained least-squares fitting of the reconstructed blend distribution to the corresponding Dinger-Funk curve. The resulting blend compositions are summarized in Table 3.
For experimental preparation, the volume fractions were converted to mass fractions using the measured true densities of the three component powders.
Table 3. Volume fractions of the five designed blends.
|
Blend |
n |
A50 |
A15 |
A0.5 |
|---|---|---|---|---|
|
DF05 |
0.05 |
20.5 |
48.4 |
31.2 |
|
DF20 |
0.20 |
32.3 |
45.3 |
22.3 |
|
DF37 |
0.37 |
46.8 |
38.7 |
14.5 |
|
DF55 |
0.55 |
61.6 |
29.6 |
8.8 |
|
DF75 |
0.75 |
76.0 |
19.0 |
5.1 |
As the distribution modulus increased, the formulations shifted progressively toward higher coarse-particle content and lower fine-particle content. This systematic variation enabled evaluation of the relationship between gradation design and experimentally measured packing behavior.
3.3 Dry-Powder Packing Results
The measured true densities, tapped densities, and calculated packing fractions of the individual powders and blends are summarized in Table 4.
Table 4. True density, tapped density and calculated packing fraction of the component powders and designed blends.
|
Sample |
n |
Tapped |
True |
Packing |
|---|---|---|---|---|
|
A50 |
N/A |
2.24 |
3.788 |
59.13 |
|
A15 |
N/A |
2.27 |
3.719 |
61.04 |
|
A0.5 |
N/A |
1.07 |
3.984 |
26.86 |
|
DF05 |
0.05 |
1.77 |
3.816 |
46.39 |
|
DF20 |
0.20 |
2.10 |
3.800 |
55.26 |
|
DF37 |
0.37 |
2.42 |
3.790 |
63.86 |
|
DF55 |
0.55 |
2.46 |
3.785 |
65.00 |
|
DF75 |
0.75 |
2.43 |
3.785 |
64.20 |
Among the individual powders, A50 and A15 showed similar packing fractions of 59.13% and 61.04%, respectively, whereas A0.5 showed a substantially lower packing fraction of 26.86%, despite having a comparable true density. This result suggests that factors other than particle density strongly influence the packing behavior of the finest powder, particularly interparticle interactions.
For the blends, the packing fraction increased from 46.39% for DF05 to 63.86% for DF37. The highest packing fraction was observed for DF55 (65.00%), followed by a slight decrease to 64.20% for DF75. Overall, packing efficiency improved as the proportion of ultrafine particles decreased, reaching a maximum at intermediate distribution modulus values.
The results indicate that excessive fine-particle loading can reduce packing efficiency, despite theoretical benefits associated with void filling. Fine particles exhibit higher specific surface area and stronger cohesive forces, which can promote agglomeration and hinder efficient packing during dry blending and tapping. Consequently, the fine rich formulas DF05 and DF20 exhibited lower packing fractions than the more balanced formulations DF37, DF55, and DF75.
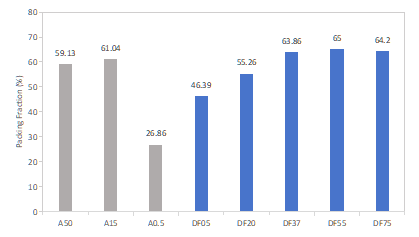
Figure 3. packing fractions of the three component powders and five designed blends.
Wet laser diffraction provides the dispersed particle size distribution (PSD) data required for model-guided formulation design, but does not fully represent the powder behavior during dry blending and tapping. The markedly lower packing fraction of A0.5 compared with A50 and A15 is consistent with the increasing influence of cohesion and agglomeration at smaller, submicron particle sizes [8]. As a result, Dinger-Funk calculations should be regarded as a formulation screening tool, rather than a predictor of final packing performance. Experimental validation remains essential for identifying compositions that achieve high packing efficiency under practical processing conditions.
4. Conclusion
The characterization workflow presented in the study provides a practical method for evaluating spherical alumina fillers and screening blend formulations for thermal interface materials (TIMs).
|
1
|
Particle size characterization. The Bettersizer 2600 Plus measurements provide the complete particle size distributions required for blend formulation design and quantitative gradation analysis. |
|
2
|
Generate candidate formulations. Dinger-Funk fitting uses the measured particle size distributions to generate a range of volume-based blend compositions spanning fine-rich to coarse-rich gradations. |
|
3
|
Convert the formulation basis. True-density measurements from the BetterPyc 380 gas pycnometer enable accurate conversion of volume fractions into mass ratios for sample blend preparation. |
|
4
|
Verify dry-powder packing. Tapped-density measurements from the PPX1, combined with true density data, provide experimental packing fractions for individual powders and each candidate blend formulation. |
In this study, the measured particle size distributions were used to generate five blend formulations with varying distribution moduli. Experimental packing measurements showed that packing efficiency increased as the formulations shifted from the fine-rich blends to coarse-rich composition with the highest packing fraction observed for DF55. These results highlight the importance of validating model-generated formulations experimentally, particularly when fine particles are present and cohesion effects become significant.
Overall, this workflow integrates particle size characterization, model-guided gradation design, and experimental packing verification into a single screening methodology. It can support raw-material selection and formulation optimization before advancing promising candidates to resin-level rheological, thermal performance, and reliability testing.
References
[1] Li, H.; Zheng, W. Enhanced thermal conductivity of epoxy/alumina composite through multiscale-disperse packing. Journal of Composite Materials 55(1), 17–25 (2021).
[2] Funk, J. E.; Dinger, D. R. Predictive Process Control of Crowded Particulate Suspensions: Applied to Ceramic Manufacturing. Springer, 1994.
[3] ISO 24235:2007. Fine ceramics - Determination of particle size distribution of ceramic powders by laser diffraction method.
[4] ASTM C1070-26. Standard Test Method for Determining Particle Size Distribution of Alumina or Quartz by Laser Light Scattering.
[5] ISO 12154:2014. Determination of density by volumetric displacement — Skeleton density by gas pycnometry.
[6] ISO 23145-1:2007. Fine ceramics - Determination of bulk density of ceramic powders - Part 1: Tap density.
[7] Mao, L.; Han, J.; Zhao, D.; Song, N.; Shi, L.; Wang, J. Particle packing theory guided thermal conductive polymer preparation and related properties. ACS Applied Materials & Interfaces 10(39), 33556–33563 (2018).
[8] Parteli, E. J. R.; Schmidt, J.; Bluemel, C.; Wirth, K.-E.; Peukert, W.; Poeschel, T. Attractive particle interaction forces and packing density of fine glass powders. Scientific Reports 4, 6227 (2014).
LOGIN TO ACCESS EXCLUSIVE CONTENT
More Resources Including
- Application Notes & Collections
- Webinars & Workshops
- Presentations & Videos
- Monthly Newsletters
- Exclusive Events...

Recommended articles
Rate this article