Particle Size and Shape Analysis of Fertilizers Using the BeVision D3
2026-05-19Application Note
Abstract: Slow- and controlled-release fertilizers are essential to modern agriculture, relying on uniform particle size distribution and morphology to ensure stable nutrient release. This study utilizes the BeVision D3 dynamic image analyzer to measure the particle size (XCmin) and shape of fertilizer granules, comparing the results directly with conventional vibratory sieving. The analysis demonstrates that while the dynamic image method matches the particle size results of traditional sieving , it uniquely provides valuable shape analysis alongside critical uniformity assessments and non-destructive testing. This offers an enhanced, comprehensive quality control solution for process optimization and consistent nutrient delivery in fertilizer production.
Keywords: Fertilizer, Slow-release fertilizer (SRF), Controlled-release fertilizer (CRF), Particle size distribution (PSD), Particle shape, BeVision D3, Sieving method, Granule uniformity
| Product | BeVision D3 |
| Industry | |
| Sample | Fertilizers |
| Measurement Type | Particle Size, Particle Shape |
| Measurement Technology |
Slow- and controlled-release fertilizers are essential to modern green agriculture and horticulture, offering efficient and sustainable nutrient management. These products generally feature a spherical composite structure consisting of a nutrient core encapsulated by a functional coating. This design enables a "single application with continuous release" of nutrients. These controlled release fertilizers (CRFs) and slow-release fertilizers (SRFs) are designed to feed plants continuously, at maximum uptake efficiency, while saving labor and applications costs, enabling application independent of the irrigation system, and with a simple application process, minimizing loss from leaching, volatilization or fixation, preventing environmental contamination.
Particle size distribution and particle shape uniformity are critical quality attributes that directly influence coating integrity, nutrient release behavior, and overall product stability. A broad particle size distribution may result in inconsistent or uncontrolled nutrient release, whereas irregular or non-spherical particles are more susceptible to coating defects, leading to premature or burst release of nutrients.
Traditional vibratory sieving methods are limited to particle size measurement and cannot provide detailed shape characterization, such as sphericity or circularity. Moreover, the mechanical vibration involved in sieving can damage the coating layer, potentially compromising sample integrity and leading to inaccurate test results.
In this report, dynamic image analysis technology is employed to simultaneously measure particle size and morphology of fertilizer samples. This method is compared to conventional sieving techniques, highlighting key differences and advantages. This approach offers a comprehensive and reliable solution for quality control and process optimization in the fertilizer industry.
Measurement Methods
A BeVision D3 dynamic image particle size and shape analyzer equipped with a BV-F10 Free Fall dispersion unit was used to simultaneously characterize the particle size and shape of two representative slow/controlled-release fertilizer samples. For comparison, conventional sieving analysis was performed using a vibratory sieve shaker with Tyler standard sieves.
|
Dispersion method |
Free fall |
|
Camera |
5-megapixel CMOS |
|
Feeding rate |
Automatic |
|
Number of particles |
>90,000 pcs |
|
Test duration |
3 mins |
Results and Discussion
The minimum chord length XCmin was selected as the representative particle size parameter for the fertilizer samples and compared with the results obtained from the sieving method.
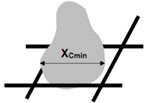
Figure 1. Definition of minimum chord length XCmin
1. Results for the Slow-Release Fertilizer
1.1 Particle Size Analysis
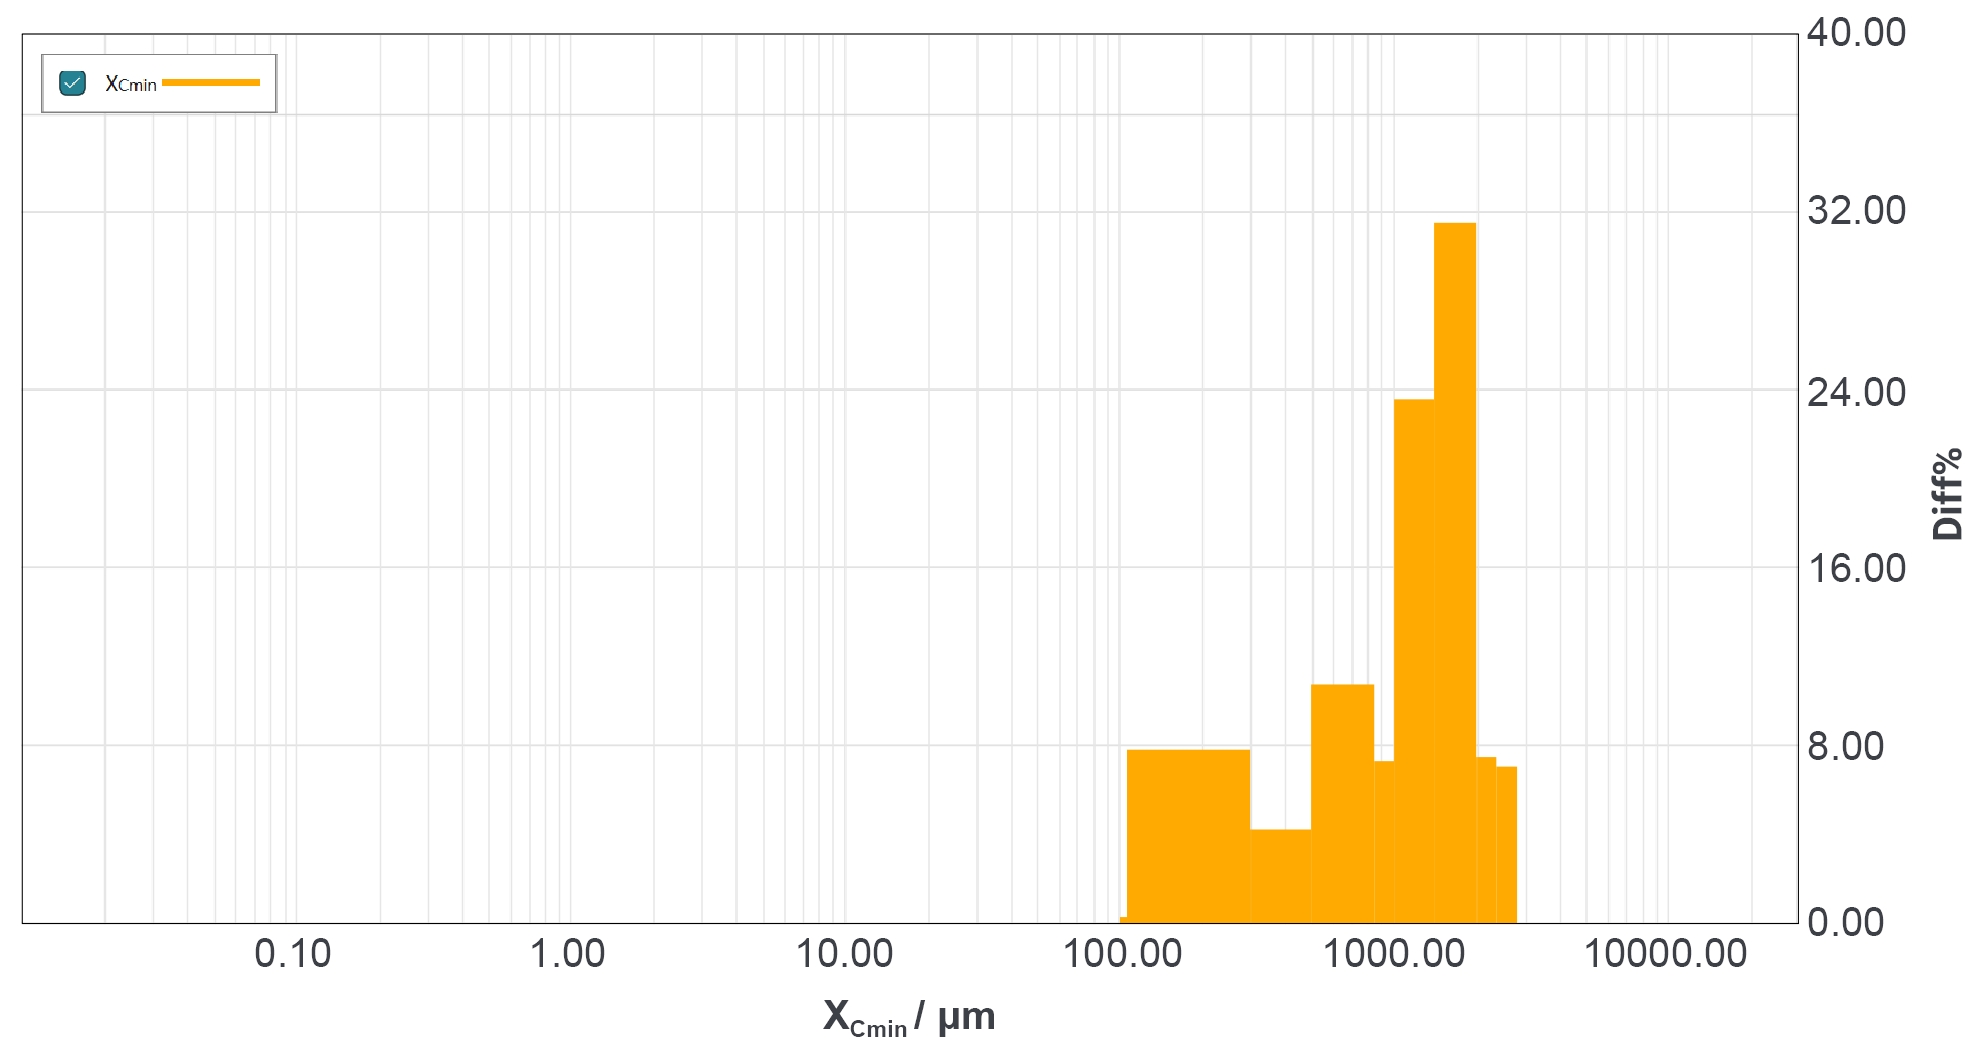
Figure 2 Particle size distribution of the slow-release fertilizer
Table 1. Characteristic values of the slow-release fertilizer
|
XCmin(Q=10%) |
XCmin(Q=50%) |
XCmin(Q=90%) |
Span |
|
289.40 μm |
1296.00 μm |
2096.18 μm |
1.39 |
Based on the particle size distribution and statistical results, the following observations can be made:
- Median particle size: XCmin(Q=50%) = 1296 μm indicates that the sample falls within the small-to-medium particle size range, slightly smaller than conventional field fertilizers. This characteristic may contribute to a relatively faster initial nutrient release rate while still maintaining controlled release performance.
- Fine particle content: XCmin(Q=10%) = 289.40 μm suggests a low proportion of fine particles in the sample, which is favorable for reducing dust and minimizing rapid nutrient dissolution.
- Coarse particle limit: XCmin(Q=90%) = 2096.18 μm indicates that the majority of particles are smaller than 2.1 mm, with no significant presence of oversized particles.
- Distribution uniformity: The Span value of 1.39 (Span< 1.5) demonstrates a relatively narrow particle size distribution, meeting the uniformity requirement for slow-release fertilizers.
The Span is defined as:
Span = (D90-D10)/D50
A smaller Span value indicates a narrower and more uniform particle size distribution.
Typical industry benchmarks:
Compound and /slow-release fertilizers: Span ≤ 1.5
High-quality controlled-release fertilizers: Span ≤ 1.2
1.2 Comparison with Sieving Method
Table 2. Comparison of particle size distribution between the sieving method and the BeVision D3
|
Particle size µm |
Sieving result % |
BeVision D3 % |
|
2800 |
1.81 |
1.82 |
|
2000 |
11.24 |
10.53 |
|
1400 |
30.58 |
31.52 |
|
1000 |
23.69 |
23.73 |
|
850 |
7.13 |
7.08 |
|
500 |
10.92 |
10.82 |
|
300 |
4.27 |
4.19 |
|
106 |
7.57 |
7.77 |
|
0 |
2.78 |
2.55 |
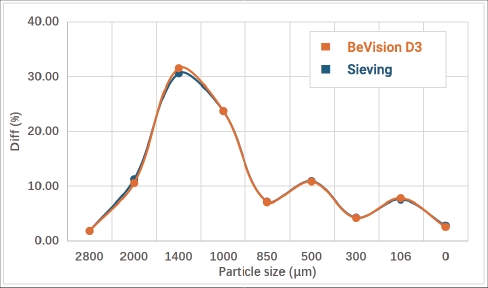
Figure 3. Particle size distributions measured by the BeVision D3 and the sieve shaker of the slow-release fertilizer
The comparative results demonstrate that the particle size distribution obtained by the BeVision D3 is in excellent agreement with that measured by the traditional sieving method. The proportion of each particle fraction shows only minor deviations, and both methods exhibit a consistent overall distribution trend.
The results confirm that the BeVision D3 provides accurate and reliable particle size measurements, matching the performance of conventional sieving
1.3 Particle Shape Analysis
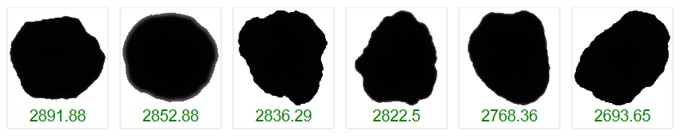
Figure 4. Large fertilizer granules (XCmin> 2100 μm)
Large granules (XCmin > 2100 μm): These particles exhibit a sub-spherical to quasi-spherical morphology with smooth, rounded contours. No obvious edges or sharp corners are observed. The difference between the long and short axes is small, indicating low aspect ratio variation and high circularity, which is beneficial for uniform coating and controlled nutrient release.
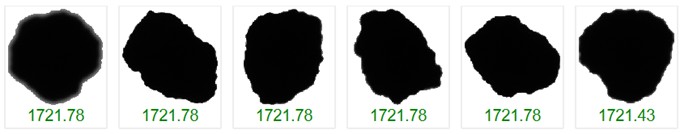
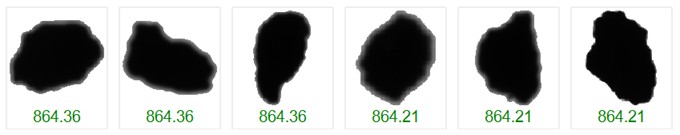
Figure 5. Medium fertilizer granules (290 μm< XCmin<2100 μm)
Medium granules (290 μm < XCmin < 2100 μm): The particles show generally rounded shapes with slightly irregular contours. Minor surface undulations or small protrusions are present, but no sharp edges are observed. Overall, the particles maintain a near-spherical form, supporting acceptable coating performance and release uniformity.
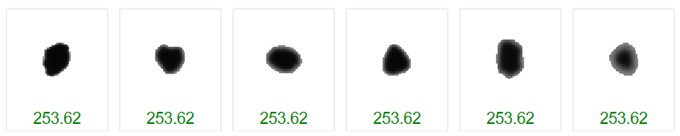
Figure 6. Small granules (XCmin<290 μm)
Small granules (XCmin < 290 μm): They are primarily composed of incompletely formed granules generated during the granulation process or fragments produced by the breakage of larger particles. Such particles may contribute to non-uniform or rapid nutrient release.
2. Results for the Controlled-Release Fertilizer
2.1 Particle Size Analysis
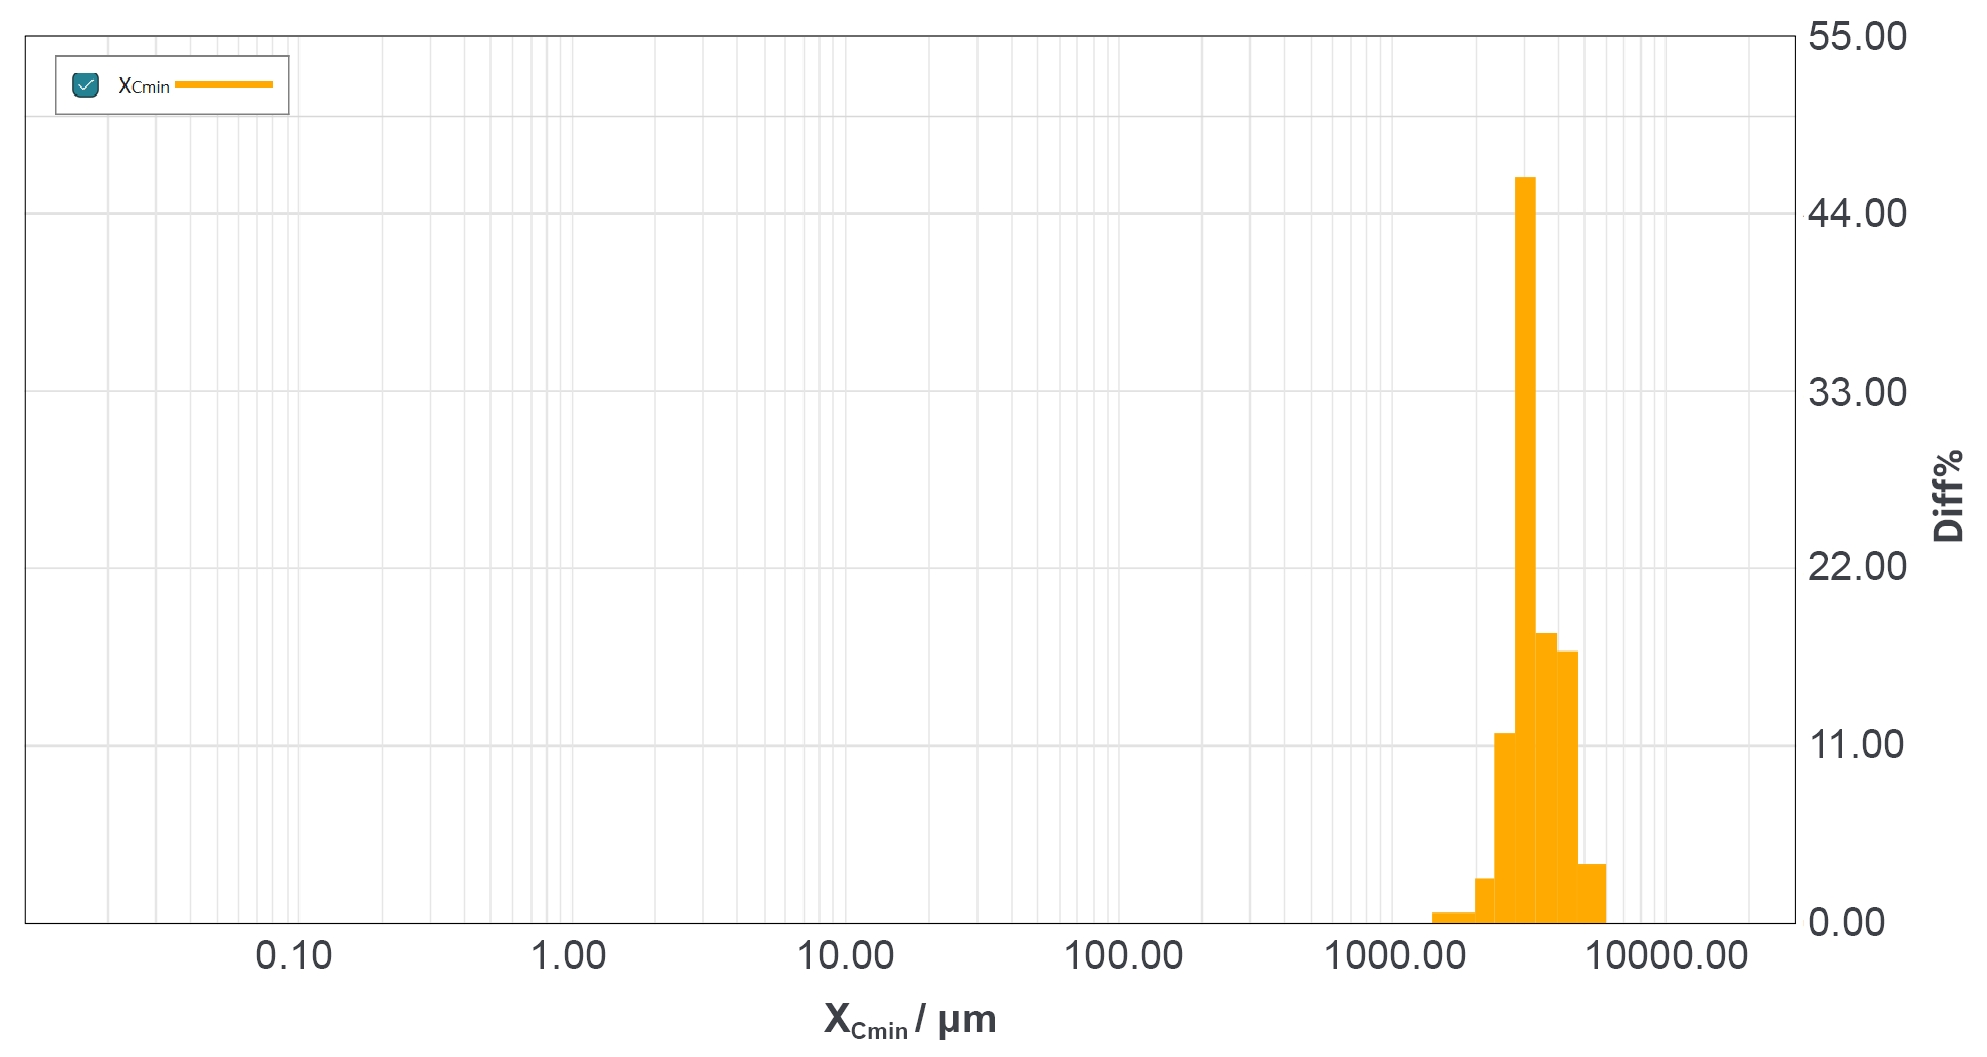
Figure 7. The particle size distribution of the controlled-release fertilizer
Table 3. Characteristic values of controlled-release fertilizer
|
XCmin(Q=10%) |
XCmin(Q=50%) |
XCmin(Q=90%) |
Span |
|
2680.55 μm |
3204.66 μm |
4319.28 μm |
0.51 |
From the particle size distribution and characteristic values of this controlled-release fertilizer, we can know that:
- Median particle size: XCmin(Q=50%) ≈ 3.2 mm indicates that the sample belongs to the large particle size range. This fully meets the design requirements for coated fertilizers, where a particle size of 3-4 mm is considered optimal for achieving stable and controlled release.
- Fine particle content: XCmin(Q=10%) ≈ 2.7 mm suggests that the sample contains almost no fine particles. This is beneficial for minimizing dust formation, preventing caking, and avoiding premature or burst nutrient release.
- Coarse particle limit: XCmin(Q=90%) ≈ 4.3 mm indicates that most particles are below 4.3 mm with no significant presence of excessively large particles that could negatively affect coating uniformity or field application performance.
- Distribution uniformity: The Span value of 0.51 (Span < 1.2) demonstrated an extremely narrow particles size distribution, indicating excellent particle uniformity and meeting the requirements for high-quality controlled-release fertilizers.
A smaller Span value indicates a more concentrated particle size distribution and higher uniformity.
2.2 Comparison with Sieving Method
Table 4. Comparison of particle size distribution between the sieving method and the BeVision D3
|
Particle size µm |
Sieving result % |
BeVision D3 % |
|
4750 |
4.03 |
3.11 |
|
4000 |
18.91 |
17.49 |
|
3350 |
19.92 |
17.71 |
|
2800 |
42.58 |
47.51 |
|
2360 |
10.36 |
10.1 |
|
2000 |
2.82 |
2.72 |
|
1400 |
0.69 |
0.65 |
|
1000 |
0 |
0 |
|
0 |
0.69 |
0.71 |
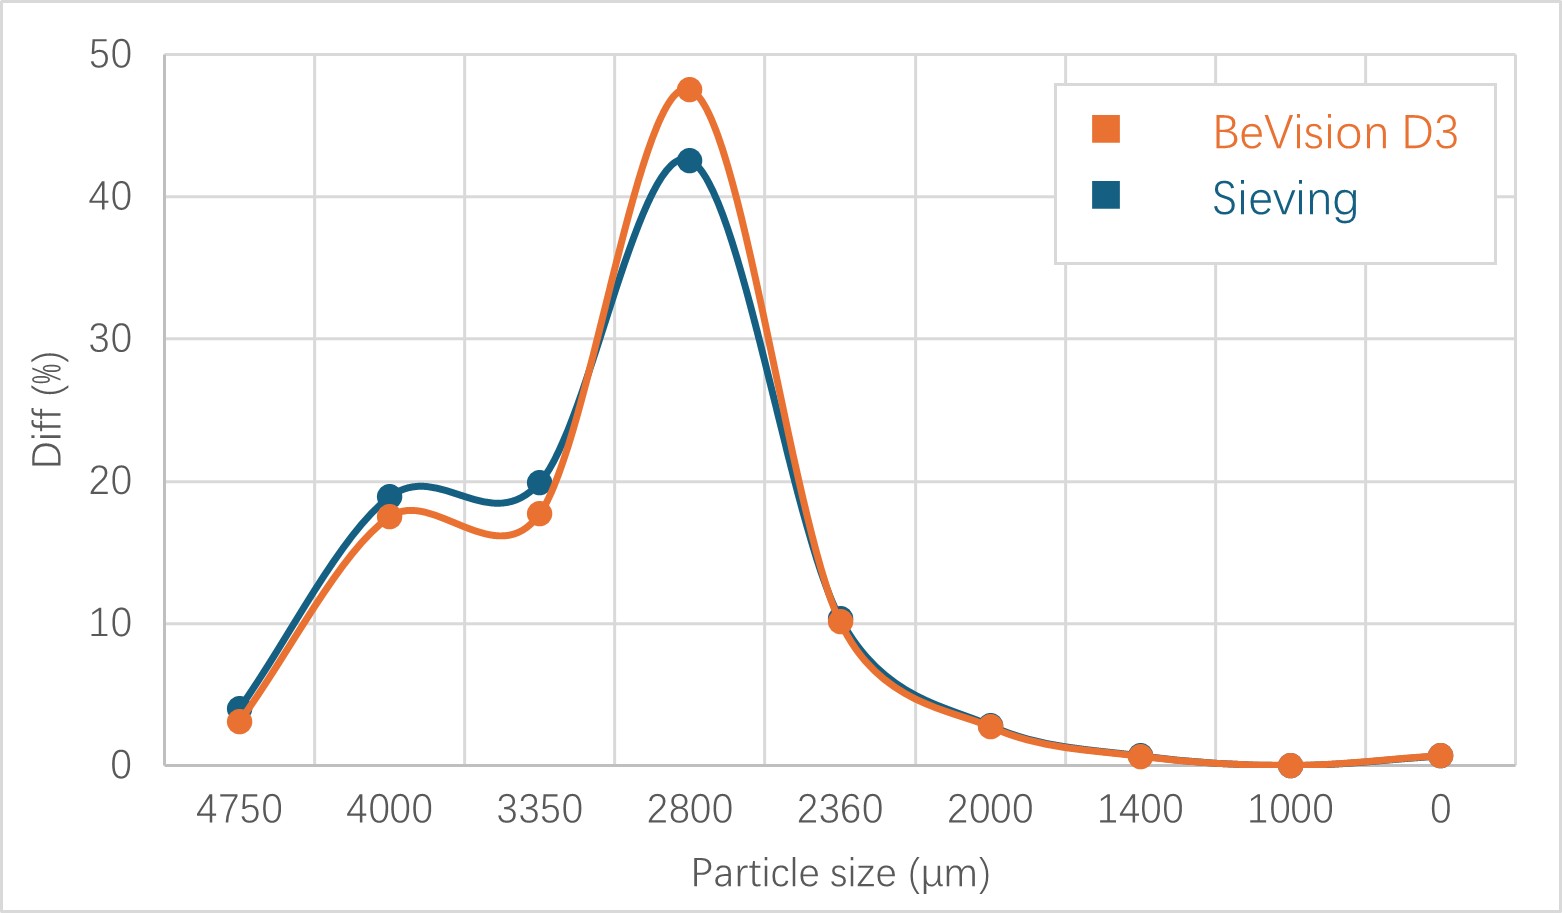
Figure 8. Particle size distributions measured by the BeVision D3 and the sieve shaker of the controlled-release fertilizer
The comparison results indicate that the particle size distribution measured by BeVision D3 is highly consistent with that obtained using the conventional sieving method. The proportion of each size fraction shows only minor deviations, while the overall distribution trend remains consistent between the two methods.
The results demonstrated that the BeVision D3 provides accurate and reliable particle size measurements. In addition to matching the performance of traditional sieving, it offers advantages such as faster analysis and non-destructive measurement.
2.3 Particle Shape Analysis
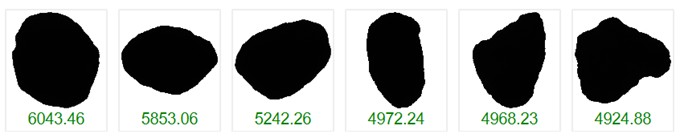
Figure 9. Coarse granules (XCmin>4300 μm)
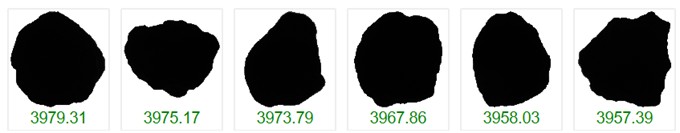
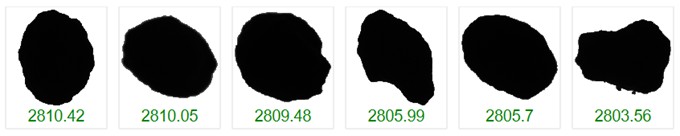
Figure 10. Medium granules fertilizer granules (2700 μm<XCmin<4300 μm)
Coarse granules (XCmin > 4300 μm): The particles are predominantly quasi-spherical to ellipsoidal in shape and represent 10% fraction of the sample. Most granules exhibit smooth and rounded contours, although a small number show slight irregularities with minor edges. Overall, their morphology remains well-formed and suitable for uniform coating and controlled nutrient release.
Medium granules (2700 μm < XCmin < 4300 μm): Particles in this size range exhibit morphology similar to the coarse fraction with regular, rounded shapes and good sphericity. The consistent particle morphology supports uniform coating thickness and stable release performance.
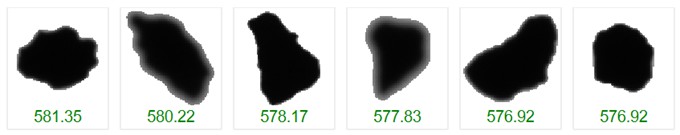
Figure 11. Small fertilizer granules(XCmin< 1000μm)
Small granules (XCmin < 1000 μm): The particles are relatively few in number and exhibit greater morphological variability. They tend to have irregular shapes and low circularity compared to larger granules. However, the particles remain structurally intact with no significant signs of breakage or powdering. Their low proportion minimizes their impact on the overall product performance.
3. Comprehensive Sample Evaluation
Based on the particle size and shape analysis results obtained using the BeVision D3, the following conclusions can be drawn:
Slow-release fertilizer:
This sample consists of primarily small-to-medium size granules with a relatively uniform size distribution. A minor proportion of small, irregular granules are present. Overall, the morphology is suitable for controlled nutrient release, although attention should be paid to coating quality to ensure uniformity and maintain stable release performance. The sample is well suited for use as a base fertilizer in applications such as fruit trees, seedlings, and high-value crops.
Controlled-release fertilizer:
This sample represents a high-specification product characterized by large, uniformly sized granules, an ultra-narrow particle size distribution, and negligible fine particle content. These particles exhibit regular, near spherical morphology, making them highly compatible with advanced coating processes. These properties support precise, long-term nutrient release and make the product suitable for high-end agricultural and horticultural applications.
Conclusion
The BeVision D3 enables simultaneous and comprehensive characterization of both particle size distribution and particle shape, overcoming the limitations of traditional sieving methods, which cannot provide morphological information and may cause coating damage during testing.
This measurement results show excellent agreement with conventional sieving data, while offering direct correlation with sieve-based metrics. This allows for seamless integration into existing quality control systems without the need for changes to established standards.
By delivering both routine quality control parameters and advanced morphological insights in a single measurement, the BeVision D3 provides a powerful and efficient solution for fertilizer production. It supports improved quality control, process optimization, and product development, ultimately enabling higher performance and more consistent fertilizer products.
About the Authors
 |
Lisa Wang |
 |
Echo Cao |
|
|
|
|
|
BeVision D3Advanced Image Analyzer
|
|
LOGIN TO ACCESS EXCLUSIVE CONTENT
More Resources Including
- Application Notes & Collections
- Webinars & Workshops
- Presentations & Videos
- Monthly Newsletters
- Exclusive Events...

Recommended articles
Rate this article