Measuring the Sizes and Zeta Potentials of Copolymer Latex Samples
2022-01-12Application Note
With the BeNano 90 Zeta, the size and zeta potential of the two polystyrene-butadiene copolymer latexes were successfully characterized. The results show that both copolymers are monodisperse in terms of size and are less likely to form aggregates due to high zeta potentials.
| Product | BeNano Series |
| Industry | Chemicals |
| Sample | Copolymer Latex |
| Measurement Type | Zeta Potential |
| Measurement Technology |
Jump to a section:

Through emulsion polymerization, polystyrene and butadiene can form nano copolymer latex spheres, which are widely used in paper, cement, and other industry areas. Depending on the composition, the latex surface may take positive or negative charges that maintain the stability of the latex system. Therefore, it is important to measure the zeta potential to evaluate charges and, eventually, the stability of the sample.
In this application note, the BeNano 90 Zeta (Bettersize Instruments Ltd.) was utilized to measure the sizes and zeta potentials of polystyrene-butadiene copolymers dispersed in aqueous environments that are from the same source but vary in manufacturing processes.
Instrumentation
In the BeNano 90 Zeta nanoparticle size analyzer, a solid state laser beam with a wavelength of 671 nm and a power of 50 mW illuminates the sample. An avalanche photodiode (APD) detector coupled with iber is used to collect scattered light signals from 12° for zeta potential measurement and from 90° for size measurement.
Experiment
Two copolymer latexes were diluted in pure water by 1000 times for size and zeta potential measurements.
Each sample was measured at least three times to investigate the repeatability of the results and obtain the standard deviation of the results.
Results and Discussion
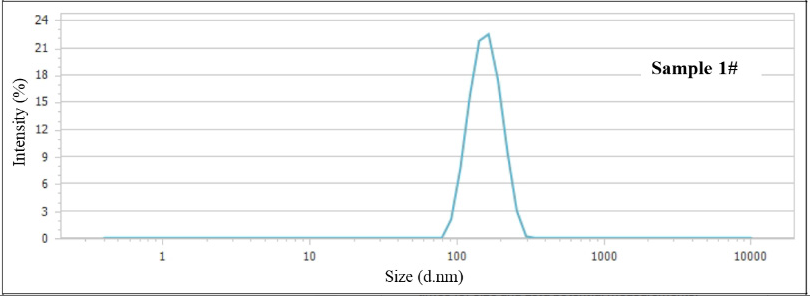
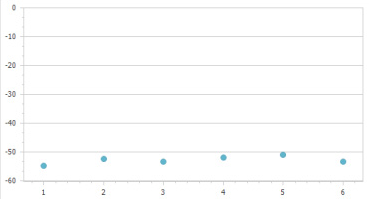
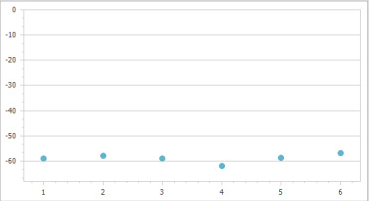
The sizes and zeta potentials of two latex samples were obtained. Figure 1 shows the size distribution curves of both samples. It turns out that both samples are nano-scaled, without large aggregates, but only narrow peaks. Figure 2 and Figure 3 display the phase plots and zeta potential trend plots of the ELS measurement. The slopes of phase plots represent the frequency shifts of scattered light due to electrophoresis. As can be seen in the figures, the very clear slopes of the phase plots demonstrate good signal-to-noise ratios of measurements.

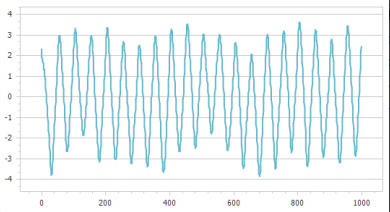
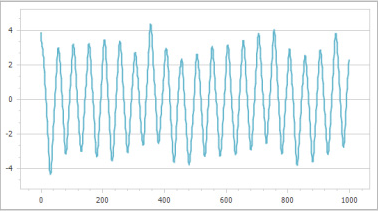
The sizes and zeta potentials of two latex samples were obtained. Figure 1 shows the size distribution curves of both samples. It turns out that both samples are nano-scaled, without large aggregates, but only narrow peaks. Figures 2 and 3 display the phase plots and zeta potential trend plots of the ELS measurement. The slopes of phase plots represent the frequency shifts of scattered light due to electrophoresis. As can be seen in the figures, the very clear slopes of the phase plots demonstrate good signal-to-noise ratios of measurements.
The multiple measurement results of the two samples are shown in Table 1, indicating that the size difference is small. PD.I of both samples are far less than 0.05, which means that the samples are narrowly distributed in size. With respect to zeta potentials, the signs are negative and absolute values are larger than 30 mV, suggesting that a large number of negative charges are carried by the particle surfaces to generate strong electrostatic repulsion to keep the latex system stable.
| Sample | Z - average (nm) | PD.I | Zeta potential (mW) |
| 1# | 155.76 | 0.010 |
-52.76±1.31
|
| 2# | 170.31 | 0.002 |
-58.90±1.68
|
Conclusions
With the BeNano 90 Zeta, the size and zeta potential of the two polystyrene-butadiene copolymer latexes were successfully characterized. The results show that both copolymers are monodisperse in terms of size and are less likely to form aggregates due to high zeta potentials.
About the Authors
 |
Zhibin Guo Application Manager @ Bettersize Instruments |
 |
Dr. Ning Chief Product Officer @ Bettersize Instruments |
|
Advanced Nanoparticle Size & Zeta Potential Analysis
|
|
LOGIN TO ACCESS EXCLUSIVE CONTENT
More Resources Including
- Application Notes & Collections
- Webinars & Workshops
- Presentations & Videos
- Monthly Newsletters
- Exclusive Events...

Recommended articles
Rate this article