
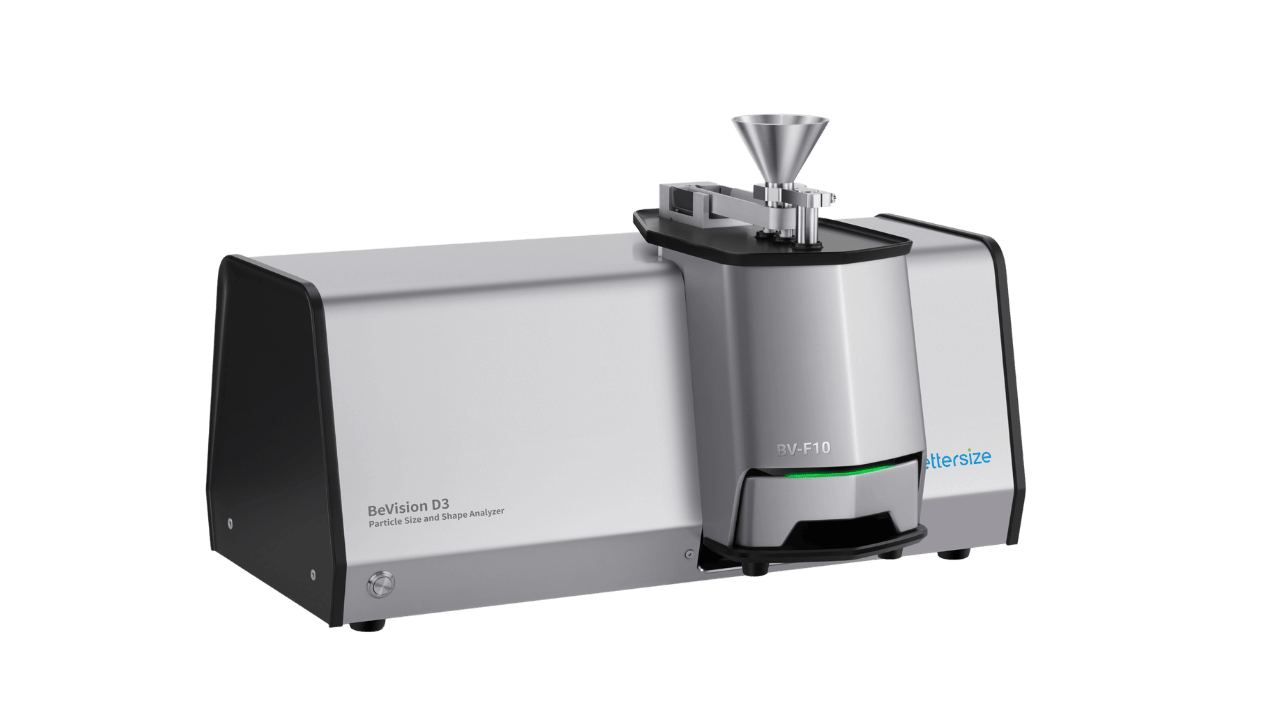
Particle Size Analysis of Crushed Soybeans Using the BeVision D3
2026-05-22Application Note
Abstract: Crushed soybean particle size and morphology significantly influence downstream processes such as oil extraction, flaking, and material handling. This study employs the BeVision D3 dynamic image analyzer with a BV-F10 Free Fall dispersion unit to rapidly and accurately measure particle size distribution (XCmin) and particle morphology. Results demonstrate excellent agreement with traditional sieving, superior automation, high throughput, and enhanced quality control for soybean processing.
Keywords: Crushed soybeans, Particle size distribution (PSD), Particle morphology, BeVision D3, Dynamic image analysis, Free-fall dispersion, Sieving method, Oil extraction efficiency, Flaking performance
| Product | BeVision D3 |
| Industry | |
| Sample | Crushed Soybean |
| Measurement Type | Particle Size, Particle Shape |
| Measurement Technology |
Soybeans are one of the most important oilseed crops and sources of vegetable protein worldwide, playing a critical role in the edible oil, food processing, and feed industry. In industrial processing, whole soybeans are typically crushed into multiple fragments through mechanical extrusion to enhance the efficiency of downstream processes such as oil extraction, cooking, fermentation, and grinding.
The particle size distribution and particle morphology of crushed soybeans are key parameters that directly influence process efficiency and final product quality. A well-controlled and uniform particle size can significantly increase the specific surface area of the material, improving flaking performance and solvent extraction efficiency, reducing residual oil in soybean meal, and ultimate enhancing oil yield. In addition, particles with regular shape and low fine powder content contribute to better flowability, helping to prevent issues such as bad compaction, poor solvent circulation, and equipment blockage, thereby ensuring continuous and stable operation.
Conventional sieving methods are limited to particle size measurement and cannot provide information on particle shape characteristics. Furthermore, sieving is time-consuming and labor-intensive. Dynamic image analysis offers a modern alternative, enabling simultaneous characterization of particle size morphology with resolution, automation, and rapid measurement speed. This approach provides more comprehensive and reliable data for evaluating crushed soybean quality and optimizing pretreatment processes.
Measurement Methods
A BeVision D3 Dynamic Image Particle Size and Shape Analyzer equipped with a BV-F10 Free Fall Dispersion Unit was used to characterize the particle size distribution and morphology of crushed soybean samples. For comparison, conventional sieving analysis was performed using a sieve shaker and Tyler standard sieves were also used for sieving analysis of the samples.
BeVision D3 test conditions:
|
Dispersion method |
|
|
Free fall |
|
Camera |
|
|
5-megapixel CMOS |
|
Feeding rate |
|
|
Automatic |
|
Number of particles |
|
|
68,609 pcs |
|
Test duration |
|
|
5 mins |
Results and Discussion
Particle Size Analysis
The minimum chord length XCmin was selected as the representative particle size parameters for crushed soybeans and used for comparison with sieving data.
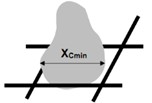
Figure 1. Definition of minimum chord length XCmin
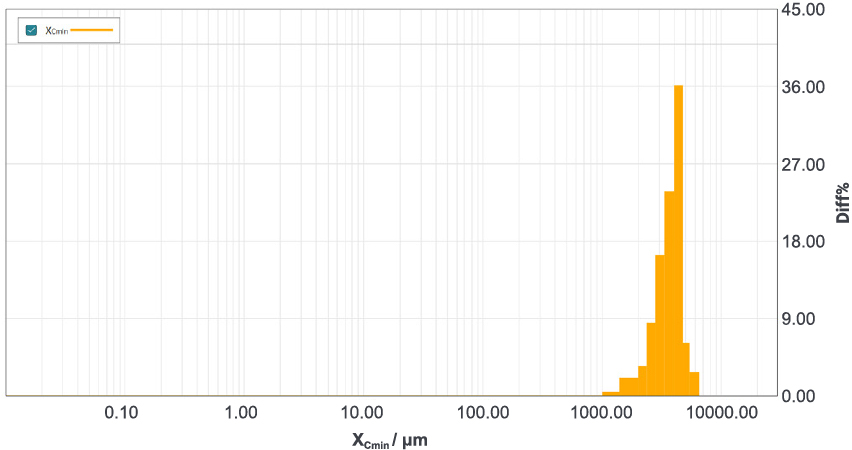
Figure 2. Particle size distribution of crushed soybean
Table 1. Characteristic values of crushed soybeans
|
XCmin(Q=10%) |
XCmin(Q=50%) |
XCmin(Q=90%) |
Span |
|
2610.79 μm |
3880.80 μm |
4731.42 μm |
0.55 |
Based on the particle size distribution and statistical results, the following observations can be made. we can know that:
- Fine particle fraction: XCmin(Q=10%) = 2610.79 μm indicates that only a small portion of particles falls below this size, suggesting a low content of fine particles.
- Median particle size: XCmin(Q=50%) = 3880.80 μm represents the median particle size, indicating that the crushed soybeans are predominantly in the medium-to-coarse size range, suitable for downstream processing.
- Coarse particle limit: XCmin(Q=90%) = 4731.42 μm shows that most particles are below approximately 4.7 mm.
Distribution uniformity. The Span value of 0.55 indicates a relatively narrow particles size distribution and good uniformity.
The Span is defined as:
Span = (D90 - D10)/D50
A smaller Span value indicates a more concentrated particle size distribution.
Overall, the crushed soybean particles are primarily medium-to-coarse, with a moderate difference between D90 and D10. Combined with the low Span value, this suggests that the crushing process is stable and produces a well-graded particle distribution. Such characteristics are favorable for subsequent processing steps, including flaking, extraction, and material handling.
Comparison with Sieving Method
Table 2. Comparison of particle size distribution between sieving method and BeVision D3 results for crushed soybeans
|
Particle size µm |
Sieving result % |
BeVision D3 % |
|
4750 |
12.92 |
9.55 |
|
4000 |
33.44 |
36.95 |
|
3350 |
20.91 |
23.01 |
|
2800 |
17.39 |
16.55 |
|
2360 |
9.21 |
7.84 |
|
2000 |
3.42 |
3.44 |
|
1400 |
2.17 |
2.10 |
|
1000 |
0.48 |
0.49 |
|
0 |
0.06 |
0.06 |
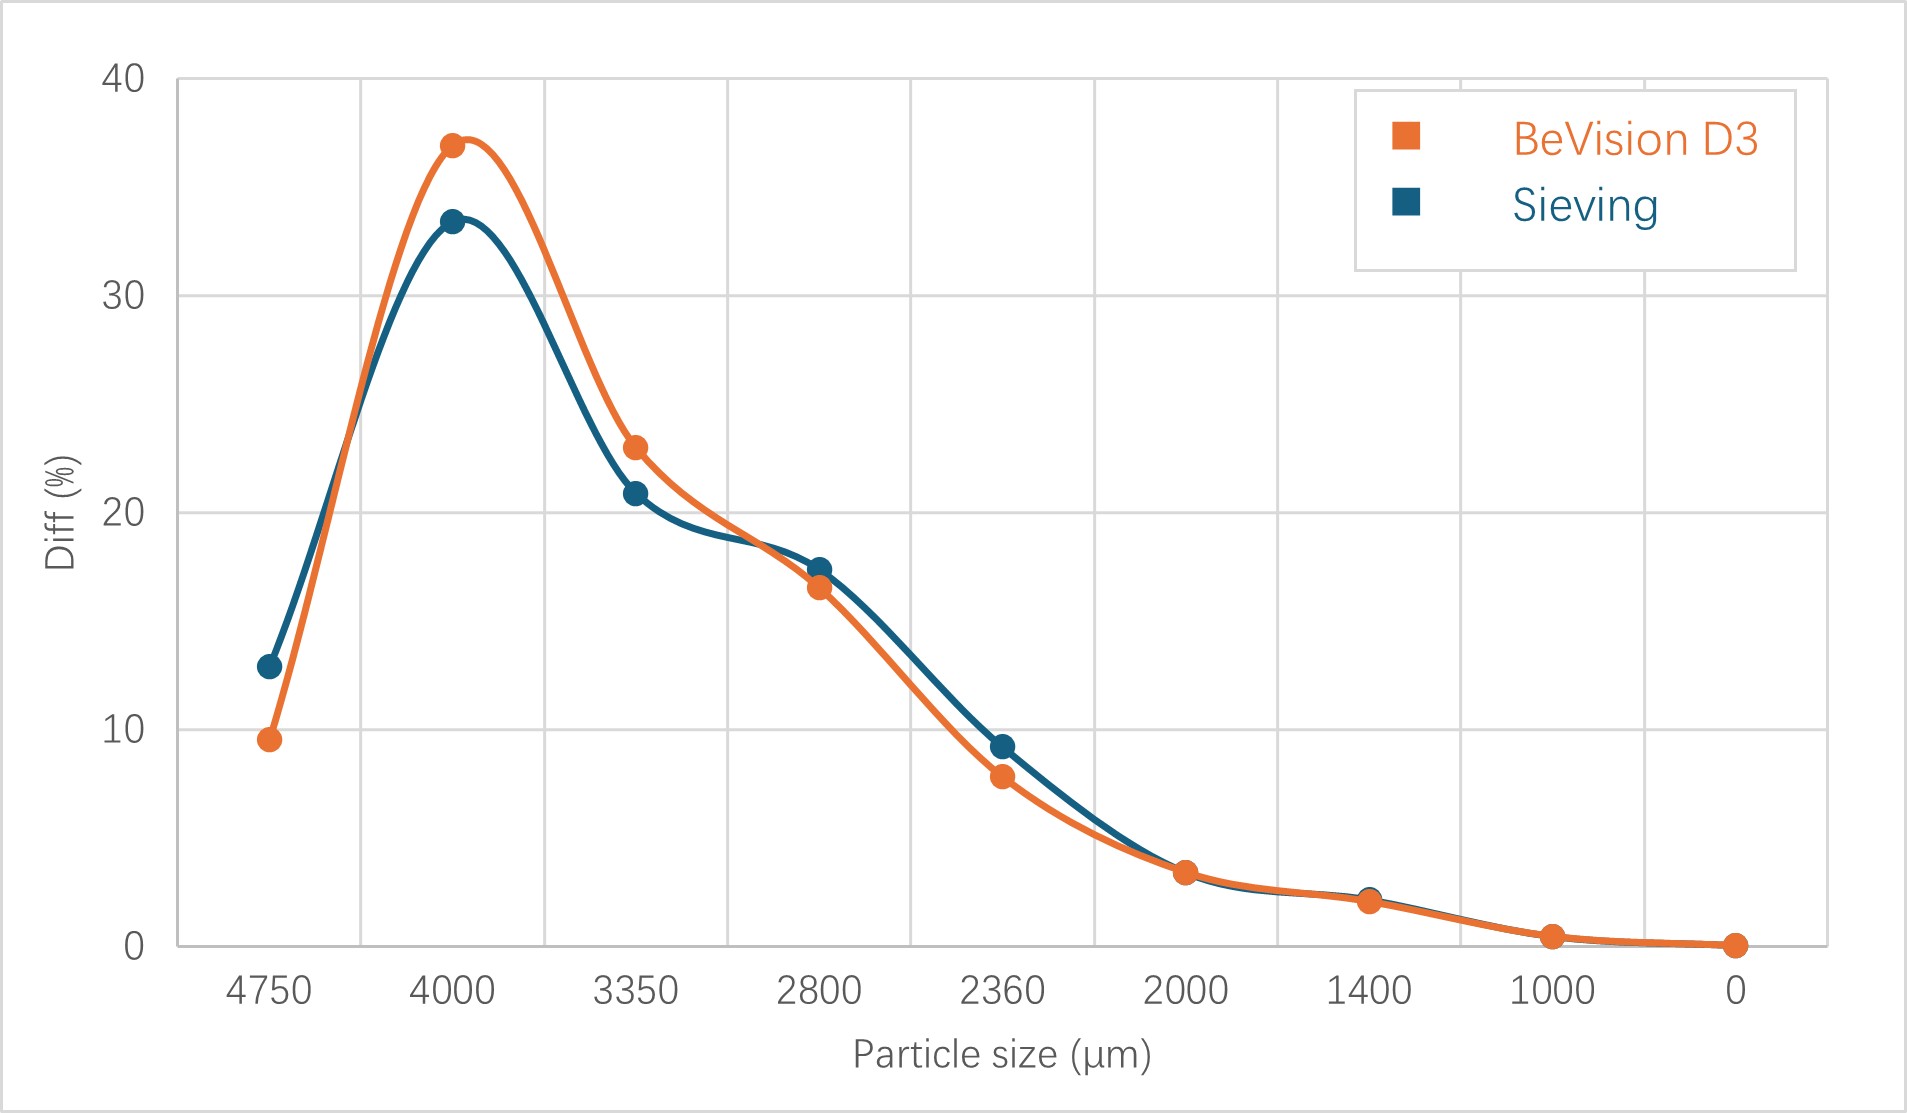
Figure 3. Particle size distributions measured by the BeVision D3 and the sieve shaker
The comparison results show that the particle size distribution obtained using the dynamic image analysis instrument is in good agreement with that measured by the traditional sieving method. Although minor differences are observed in individual size fractions, the overall distribution trends are highly consistent between the two methods.
These results demonstrate that the dynamic image method provides accurate and reliable particle size measurements. In addition to matching the performance of sieving, it offers significant advantages such as faster analysis, automation, and the ability to simultaneously characterize particle morphology. Therefore, it can effectively replace the conventional sieving method for particle size analysis and quality control of crushed soybeans.
Particle Shape Analysis

Figure 4. Large granules (XCmin>5000 μm)
Large granules (XCmin > 5000 μm): These particles correspond to nearly intact soybean kernels with slight edge damage. Their presence indicates incomplete crushing during the pretreatment process.


Figure 5. Medium granules (2000μm< XCmin<5000 μm)
Medium granules (2000 μm < XCmin < 5000 μm): These particles represent poorly crushed soybean, typically divided into two or three fragments. This size range reflects the primary target product of the crushing process and is suitable for subsequent processing steps.
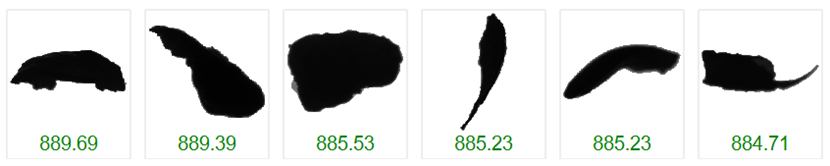
Figure 6. Small fragments (XCmin<1000 μm)
Small fragments (XCmin < 1000 μm): These particles are mainly composed of soybean seed coat debris and fine fragments. Their proportion is relatively low and has limited impact on overall processing but should be controlled to avoid dust generation and handling issues.
Conclusion
The BeVision D3 enables rapid and accurate characterization of both particle size and shape of crushed soybeans, with a fully automated measurement completed in approximately 5 minutes.
The measurement results of BeVision D3 show excellent agreement with those obtained using traditional sieving methods, allowing existing users to seamlessly transition to this advanced technique without altering established evaluation criteria. This significantly improves measurement efficiency while reducing labor costs and operational costs.
In addition to particle size distribution, the BeVision D3 provides particle morphology information, more comprehensively reflecting crushing quality, and helping to optimize the crushing process and improve processing efficiency.
About the Authors
 |
Lisa Wang |
 |
Echo Cao |
|
|
|
|
|
BeVision D3Advanced Image Analyzer
|
|
LOGIN TO ACCESS EXCLUSIVE CONTENT
More Resources Including
- Application Notes & Collections
- Webinars & Workshops
- Presentations & Videos
- Monthly Newsletters
- Exclusive Events...

Recommended articles
Rate this article