Measuring Particle Size and Shape of PET Masterbatches Using the BeVision D3
2026-04-30Application Note
Abstract: PET masterbatches, essential in the plastics industry, require strict control over particle size distribution (PSD) and morphology for consistent performance in downstream processing. This study employs the BeVision D3 dynamic image analyzer to measure the PSD and morphology of PET masterbatch samples. By using area-equivalent diameter and analyzing shape characteristics, the BeVision D3 delivers accurate and rapid results, showing excellent repeatability and correlation with traditional sieve analysis. The study emphasizes the importance of particle size and shape for optimizing product quality and production efficiency.
Keywords: PET masterbatches, Particle size distribution (PSD), Particle morphology, BeVision D3, Dynamic image analysis, Area-equivalent diameter, Sieve analysis, Plastics industry
| Product | BeVision D3 |
| Industry | |
| Sample | PET Masterbatches |
| Measurement Type | Particle Size, Particle Shape |
| Measurement Technology |
Plastic masterbatches are highly concentrated additive formulations used throughout the plastics industry and serve as essential raw materials for coloring or functionalizing polymer products, such as anti-aging performance, flame retardancy, or other specialized properties. They are produced by mixing, melting, and pelletizing high-concentration pigments or filler additives with a polymer carrier. Depending upon their intended purpose, masterbatches are typically categorized into color masterbatches, additive masterbatches, and filler masterbatches.
Particle size and morphology are two of the most critical quality indicators for masterbatches. The particle size must be compatible with the base resin to ensure uniform melting and dispersion during processing; otherwise, defects such as crystal points, streaking, and color inconsistency may occur. Stable morphology and good flowability are equally important, as irregular or poorly formed particles can result in feeding issues, blockages and inaccurate dosing in automatic processing equipment.
Instruments and Methods
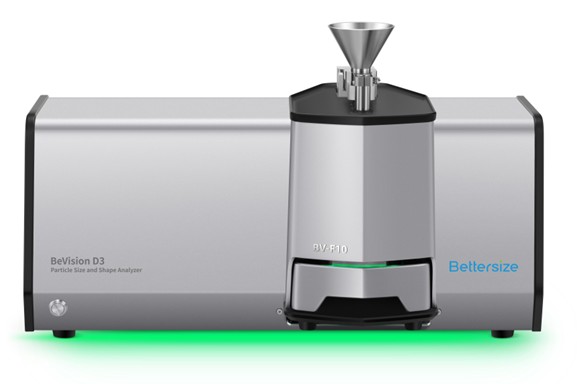
The BeVision D3 dynamic image particle size and shape analyzer equipped with the BV-F10 free fall dispersion unit was used to evaluate the particle size distribution (PSD) and morphological characteristics PET masterbatch samples.
Table 1. BeVision D3 test configuration
| Dispersion method | Free fall |
| Imaging | 5-megapixel CMOS |
| Feeding control | Automatic |
| Number of particles measured | 7,000 pcs |
| Test duration | 4 mins |
Results and Discussion
Particle Size Analysis
The area-equivalent diameter XA was selected as the primary parameter for characterizing PET masterbatch particle size. The area-equivalent diameter XA is defined as the diameter of a circle having the same projected area A as the particle, as illustrated in Figure 1.
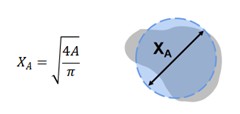
Figure 1. Definition of Area-Equivalent Diameter XA
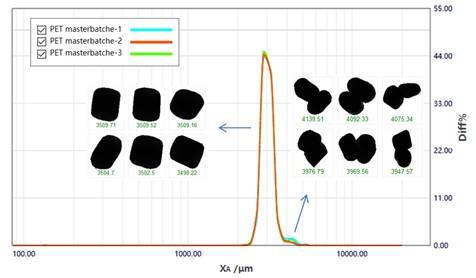
Figure 2. Particle size distribution curve of PET masterbatch samples.
Figure 2 presents the particle size distribution (PSD) curve of the PET masterbatches. The distribution exhibits a bimodal distribution, with a small secondary agglomeration peak appearing at the coarse end. Image inspection confirms that particles larger than 4000 μm are predominantly adhered particles. During measurement, the BeVision D3’s automatic feeding-speed control effectively minimized particle crowding and overlap, avoiding the collection of false agglomerates. Therefore, the coarse peak corresponds to real adhered particles present in the sample.
The three repeated measurements demonstrate excellent stability, with repeatability values all below 0.3%.
Table 2. Repeatability of Three Measurements
| Parameter | PET-1 | PET-2 | PET-3 | Average | St. dev. | Repeatability |
| D10 | 2811.18 μm | 2797.10 μm | 2798.71 μm | 2802.33 μm | 7.70 μm | 0.27 % |
| D50 | 3072.43 μm | 3063.62 μm | 3063.34 μm | 3066.46 μm | 5.17 μm | 0.17 % |
| D90 | 3371.30 μm | 3355.33 μm | 3352.54 μm | 3359.72 μm | 10.12 μm | 0.30 % |
Analysis of Adhered Particles and Impurities
Figures 3-5 provide representative images of: adhered particles (XA > 3700 μm), normal particles (2000 μm < XA < 3700 μm), and impurity particles (XA <700 μm), respectively.
Thanks to BeVision D3’s ability to save images and analyze 100% of the particles, adheres and impurity particles can be easily identified and quantified. Particles exceeding 3700 μm as confirmed as adhered pairs or clusters, while particles smaller than 700 μm are classified as impurities. As shown in Table 3, adhered particles (XA > 3700 μm), account for 2.14% of the total particle volume, and impurities (XA ≤ 700 μm), account for 0.01%.
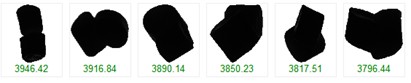
Figure 3. Adhered particles(XA>3700 μm)
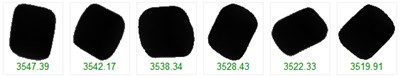
Figure 4. Normal particles(2000 μm<XA<3700 μm)
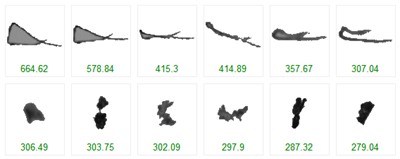
Figure 5. Impurity particles(XA<700 μm)
Table 3. Volume-weighted proportion of adhered and impurity particles
| Q(xA > 3700.00 μm) | 2.14 % |
| Q(xA ≤ 700 μm) | 0.01 % |
These results provide clear evidence of the presence of oversized adhered particles and a very low level of small impurities, supporting more effective QC monitoring and process optimization.
Conclusion
Using dynamic image analysis technology, the BeVision D3 successfully measured 7,000 PET masterbatch particles in just four minutes. Delivering rapid and highly efficient characterization. The particle size distribution demonstrated excellent consistency, with three consecutive measurements achieving repeatability better than 0.5%. The BeVision D3’s automatic feeding-speed control effectively minimized particle crowding and overlap, ensuring that no false adhered particles were generated during the test.
With 100% particle image capture and classification, adhered particles and small impurity particles can be easily distinguished and accurately quantified. This capability provides clear image-supported evidence for quality control and enables manufacturers to monitor production stability, identify processing issues early and optimize product quality with confidence.
About the Authors
 |
Echo Cao |
 |
Weichen Gan |
|
|
|
BeVision D3Advanced Image Analyzer
|
|
LOGIN TO ACCESS EXCLUSIVE CONTENT
More Resources Including
- Application Notes & Collections
- Webinars & Workshops
- Presentations & Videos
- Monthly Newsletters
- Exclusive Events...

Recommended articles
Rate this article