Measuring Particle Size and Shape of Sand Using the BeVision D3
2026-04-30Application Note
Abstract: The performance of manufactured sand (M-Sand) is primarily governed by two key quality indicators: particle size distribution (PSD) and particle morphology. This study demonstrates the importance of optimizing both PSD and particle shape to enhance concrete performance. Using the BeVision D3 dynamic image analyzer, we provide a comprehensive evaluation of the PSD and morphology of M-Sand, showing significant improvements in packing density, flowability, and concrete strength when particle size and shape are controlled. The results were also compared with traditional sieve methods, demonstrating the superior efficiency and accuracy of dynamic imaging analysis.
Keywords: Manufactured sand (M-Sand), Particle size distribution (PSD), Particle shape, Concrete performance, Dynamic image analysis, BeVision D3, Sieve analysis, Packing density, Flowability
| Product | BeVision D3 |
| Industry | |
| Sample | Manufactured Sand |
| Measurement Type | Particle Size, Particle Shape |
| Measurement Technology |
The performance of manufactured sand (M-Sand) is primarily governed by two key quality indicators: particle size distribution (PSD) and particle morphology. A well-designed PSD improves particle packing, resulting in higher compressive strength, lower permeability, and reduced shrinkage cracking in concrete structure. The rough texture and angular shape of M-Sand particles enhance bonding with cement, resulting in higher flexural and compressive strength. In contrast, excessive amounts of needle-like or flaky particles can seriously compromise the strength and long-term durability of concrete.
Traditional sieving provides only one-dimensional PSD information and cannot characterize particle morphology. As a result, manufactured sand samples with similar PSDs may still exhibit very different concrete performance if their shape characteristics vary, specifically in the proportion of elongated, needle-like or flaky particles. Dynamic image analysis technology overcomes this limitation by using non-contact high-speed imaging to provide both high-resolution PSD data and comprehensive morphological analysis, including accurate quantification of needle-like particle content.
Moreover, sieve-based PSD measurement is labor-intensive, time-consuming, and requires ongoing maintenance of test sieves. Automated dynamic image analysis from BeVision D3 offers a much faster, more efficient alternative, with minimal maintenance requirements and fully automatic measurement workflows.
This study presents a full characterization of the PSD and morphological features manufactured sand (M-Sand) using the BeVision D3 and compares the results with those obtained via the traditional sieving method.
Instruments and Methods
The BeVision D3 dynamic image particle size and shape analyzer equipped with the BV-F10 free fall dispersion unit was used to evaluate the PSD and morphology of manufactured sand (M-sand). For comparison, sieve analysis was conducted with a vibrating sieve analyzer equipped with Tyler standard sieves.
Table 1. BeVision D3 Test configuration
| Dispersion method | Free fall |
| Imaging | 5-megapixel CMOS |
| Feeding control | Automatic |
| Number of particles measured | 100,000 pcs |
| Test duration | 9 mins |
 BeVision D3
Results and Discussion
Particle Size Analysis
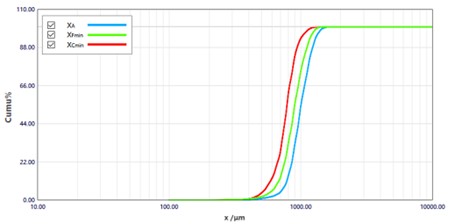
Figure 1. PSD curves of three different particle size parameters
Figure 1 shows the PSD curves derived from three particle size parameters: area-equivalent diameter (XA); minimum Feret diameter (XFmin); and minimum chord length (XCmin). These curves highlight a consistent pattern: XA > XFmin > XCmin. This ranking occurs because anisotropic materials such as sand yield different apparent particle sizes depending upon how the measurement is defined.
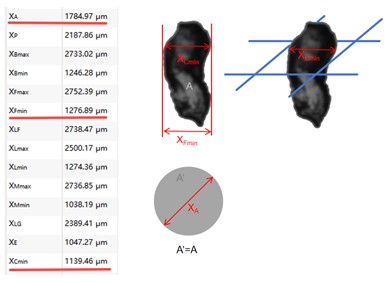
Figure 2. Comparison of particle size parameters
Figure 2 illustrates the conceptual difference amount the three parameters:
- Area-equivalent diameter (XA): Represents the diameter of a circle with the same projected area as the particle projection
- Minimum Feret diameter (XFmin): Corresponds to the narrowest distance between two parallel tangents, similar to measuring a particle’s smallest dimension with a caliper.
- Minimum chord length (XCmin): calculate using a method that simulates how particles orient and pass through sieve apertures during mechanical vibration. For this reason, XCmin most closely approximates sieve behavior.
For spherical particles or smooth particles, XFmin may closely match sieve results. However, for irregular or angular particles, XCmin aligns better with actual sieve performance because it accounts for surface curvature and depressions.
Relationship between particle size parameters: XA > XFmin > XCmin ≈ Sieve
This relationship is especially important for irregular materials like manufactured sand, where shape significantly influences apparent PSD.
Sieve Correlation
In addition to using XCmin as a particle size parameter, the BeVision software includes a built-in sieve correlation function that allows PSD results to be directly converted into sieve-equivalent outputs. This enables seamless comparison, and even replacement, of image-based PSD results for traditional sieve data..
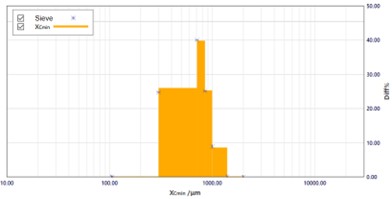
Figure 3. The PSD histogram (※: Sieve) from BeVision D3
| Mesh | Size (μm) | Percentage (%) | Xcmin /μm | Diff /% |
The comparison clearly shows excellent agreement between the two methods across all size classes. Therefore, users who currently rely on traditional sieving can switch to the BeVision D3 without modifying existing QC thresholds or acceptance criteria, while benefiting from significantly higher testing efficiency.
Particle Shape Analysis
The aspect ratio is a key morphological parameter for assessing particle shape. As shown in Figure 4, it is defined as the ratio of the minimum Feret diameter to the maximum Feret diameter of a particle's projection. An aspect ratio closer to 0 indicates a more needle-like particle, while values approaching 1 indicate a more equiaxed shape.
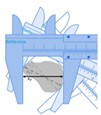
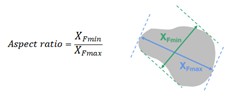
Figure 4. Definition of aspect ratio
High-quality particles (Aspect Ratio > 0.45): Particles with an aspect ratio above 0.45 have relatively blocky shapes and provide a stable granular skeleton withing concrete. They bond effectively with cement paste and are ideal for producing high-strength concrete. Figure 5 shows examples of these high-quality particles.
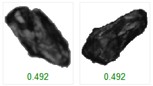
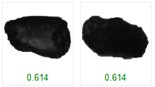
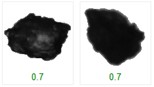
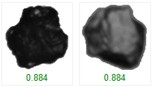
Figure 5. High-quality particles
Needle-like particles (Aspect Ratio ≤ 0.45): Particles falling below this threshold are considered needle-like or flaky. Their elongated shapes increase water demand, decrease concrete flowability, and negatively affect long-term mechanical performance. Such particles must be strictly controlled in manufacturing sand (M-sand). Examples are shown in Figure 6.
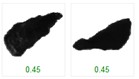
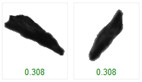
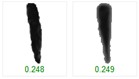
Figure 6. Needle-like particles
Stone Powder (Size < 75 μm): Particles smaller than 75 μm are classified as stone powder. While small amounts may fill voids, excessive content adds little to the long-term strength of the final concrete, and increases the water requirement, reducing concrete workability. Examples are shown in Figure 7.

Figure 7. Stone Powder
Distribution of Needle-like Particles. To visualize shape distribution, Figure 8 plots aspect ratio versus every particle measured. Each point represents a single grain of sand. The results reveal a clear size-shape relationship. Particles larger than 1000 μm generally have aspect ratios > 0.45, indicating high-quality shapes. Particles smaller than 1000 μm exhibit a higher proportion of needle-like particles, with many falling below the 0.45 aspect-ratio threshold. This trend reflects the natural breakage behavior of sand during crushing and processing.
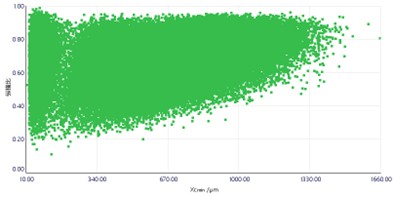
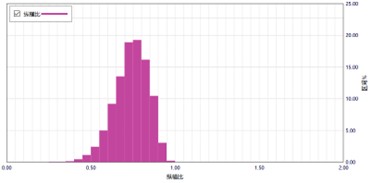
Figure 8. Aspect ratio distribution (Top: aspect ratio vs. particle size; Bottom: aspect ratio distribution)
Table 3. Volume-Weighted Proportion of needle-like particles and stone powder
| Q(Aspect ratio ≤ 0.450) | 0.65 % |
| Q(Xcmin ≤ 75.00μm) | 0.02 % |
The data show that the sample contains only 0.65% needle-like particles and 0.02% stone powder, indicating excellent overall sand quality with minimal undesirable particle types.
Conclusion
The BeVision D3 automatically measured 100,000 manufactured sand (M-sand) particles within 8 minutes, delivering exceptionally high throughput compared with traditional sieving analysis, which typically requires around 30 minutes for sample preparation, testing, and sieve cleaning. In addition to its superior efficiency, the BeVision D3 requires virtually no maintenance, further reducing operational burden.
The PSD results obtained from BeVision D3’s dynamic image analysis showed excellent agreement with those produced by vibrating sieves. This strong correlation allows users who currently rely on sieve-based PSD evaluation to transition seamlessly to BeVision D3 without modifying existing QC specification, while greatly improving measurement speed and reducing labor costs.
Beyond PSD, the BeVision D3 provides simultaneous high-resolutions particle size and shape analysis, along with complete particle image capture. This capability enables detailed evaluation of manufactured sand quality, including needly-like particle content and stone powder fraction, from both size and morphology perspectives. Such comprehensive insight supports more reliable quality control, better prediction of concrete performance, and more effective optimization of aggregate production processes.
About the Authors
 |
Echo Cao |
 |
Weichen Gan |
|
|
|
BeVision D3Advanced Image Analyzer
|
|
LOGIN TO ACCESS EXCLUSIVE CONTENT
More Resources Including
- Application Notes & Collections
- Webinars & Workshops
- Presentations & Videos
- Monthly Newsletters
- Exclusive Events...

Recommended articles
Rate this article