Measuring Particle Size and Shape of Fruit-Flavored Burst Beads by the BeVision D3
2026-04-28Application Note
Abstract: Fruit-flavored burst beads, commonly used in food, beverages, and daily chemical products, rely heavily on particle size and shape for performance and reliability. This study investigates the particle size distribution (PSD) and morphology of burst beads using the BeVision D3 dynamic image analyzer. The findings highlight the importance of controlling particle size and shape to ensure consistent production and optimal flavor release. The results are compared with traditional sieve methods, showing a significant improvement in measurement accuracy and process efficiency.
Keywords: Fruit-flavored burst beads, Particle size distribution (PSD), Particle morphology, Dynamic image analysis, BeVision D3, Food and beverage industry, Quality control, Flavor release
| Product | BeVision D3 |
| Industry | |
| Sample | Fruit-Flavored Burst Beads |
| Measurement Type | Particle Size, Particle Shape |
| Measurement Technology |
Fruit-flavored burst beads are specialized microcapsules designed to encapsulate a liquid flavor within a fragile outer shell. When subjected to mechanical force (such as squeezing, extrusion or crushing), the shell breaks and rapidly releases the encapsulated liquid, delivering an immediate and intensified flavor sensation. These beads are widely incorporated in products across several industries, including cigarettes, foods and beverages, and daily chemical goods.
The performance and reliability of burst beads depend heavily on their particle size and morphological uniformity. Particle size must be strictly controlled within a narrow distribution range to ensure smooth operation on automated production lines, preventing issues such as clogging or inconsistent filling. Likewise, optimal bead morphology is ideally spherical, supporting good flow behavior and uniform mechanical stress distribution. Any deviations from this ideal shape can compromise capsule integrity, increasing the risk of premature rupture, flavor leakage, and manufacturing loss, all of which directly impact product quality and overall yield.
Instruments and Methods
BeVision D3
The BeVision D3 dynamic image particle size and shape analyzer combined with the BV-F10 free fall dispersion unit was used to analyze the particle size distribution (PSD) and shape characteristics of fruit-flavored burst beads.
This setup ensures efficient, dispersion‑based delivery of individual beads into the imaging zone, minimizing particle overlap and enabling high‑accuracy measurement.
Table 1. Specification for BeVision D3 DIA equipped with BV-F10 free fall dispersion unit
|
Dispersion method |
Free fal |
|
Imaging |
5 megapixel CMOS |
|
Feeding control |
Automatic |
|
Measured particle number |
7,000 pcs |
|
Test duration |
3 mins |
Results and Discussion
Particle Size Analysis
The area-equivalent diameter, XA, was selected as the primary particle size metric for characterizing the burst bead masterbatches. The area-equivalent diameter (XA) is defined as the diameter of a circle with the same projected area (A) as the particle, as shown in Figure 1.
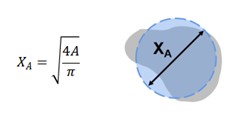
Figure 1. Definition of Area-Equivalent Diameter XA
Table 2. Particle size parameters for 3 flavor type samples
|
Name |
D10 (μm) |
D50 (μm) |
D90 (μm) |
C.V. (%) |
Span |
|
Peppermint |
3433.54 |
3476.69 |
3525.05 |
3.34 |
0.03 |
|
Peach |
3426.80 |
3455.12 |
3493.71 |
3.91 |
0.02 |
|
Watermelon |
3394.72 |
3436.43 |
3473.60 |
3.83 |
0.02 |
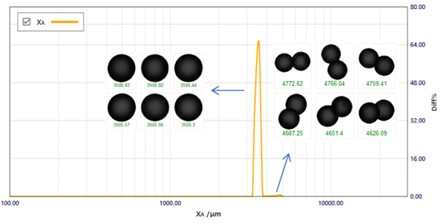
Figure 2. The PSD of peach-flavored burst beads
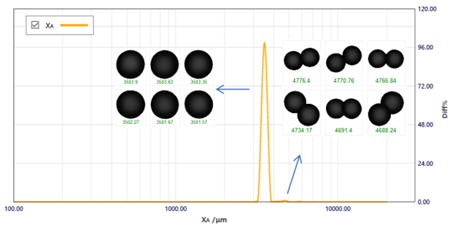
Figure 3. The PSD of watermelon-flavored burst beads
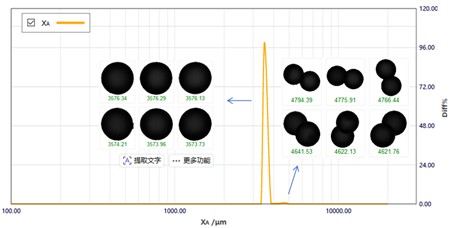
Figure 4. The PSD of peppermint-flavored burst beads
As shown in Figures 2-4, all three burst bead types exhibit very narrow PSDs. However, a secondary peak appears at the coarse end of each distribution. Image analysis confirms that these peaks originate from small numbers of physically adhered bead pairs or clusters. During measurement, the system’s automatic feed-rate control effectively prevents particle overcrowding or overlapping, ensuring that only authentic adhered beads, not image artifacts, are captured. Therefore, the observed coarse peaks represent true adhered beads present from production.
As shown in Table 3, the number-weighted proportion of adhered beads is 0.42% in peppermint-flavored beads, 0.51% in peach-flavored beads, and 0.38% in watermelon-flavored beads.
Table 3. Number-weighted proportion of adhered beads
| Name | Q(XA > 3700μm) |
| Peppermint | 0.42 % |
| Peach | 0.51 % |
| Watermelon | 0.38 % |
Circularity Analysis
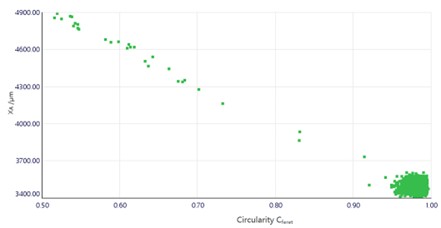
Figure 5. Circularity vs. Size scatter plot of peppermint-flavored burst beads
Figure 5 shows the circularity-particle size scatter plot for peppermint-flavored beads. Most beads exhibit circularity values greater than 0.9, indicating excellent overall circularity. A small population falls below 0.9 and these low-circularity particles correlate strongly with larger particles size, specifically those above 3700 μm. Image inspection (Figures 6-8) confirm that these lower-circularity particles are predominately adhered bead pairs or clusters.
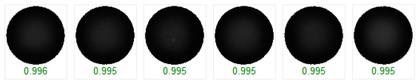
Figure 6. Beads images with circularity of 1-0.99

Figure 7. Beads images with circularity of 0.99~0.9
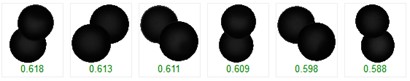
Figure 8. Beads images with circularity lower than 0.9
Table 4. Number-weighted distribution of circularity for peppermint-flavored beads
| Circularity Range | Percentage |
| 1 ~ 0.990 | 14.67 % |
| 0.99 ~ 0.900 | 84.92 % |
| < 0.900 | 0.41 % |
Overall, the peppermint-flavored burst beads exhibit excellent circularity, with 14.67% of particles exhibiting near-perfect circularity (> 0.99) and 84.92% falling within the high-quality range of 0.99-0.9. Only 0.41% of beads display circularity below 0.9, corresponding primarily to adhered particles.
Conclusion
Using a dynamic image-based measurement approach, the BeVision D3 rapidly analyzed approximately 7,000 burst beads within three minutes, simultaneously providing high-accuracy particle size and shape characterization. The system’s automatic sample-feeding control effectively minimized particle crowding and overlap, ensuring that adhered beads were not mistakenly generated during measurement and that the reported PSD and shape data reflected true sample conditions.
Visual inspection combined with quantitative image analysis enabled clear identification and reliable quantification of adhered beads and low-circularity beads. These results provide strong image-backed evidence and robust numerical data to support production monitoring and quality control efforts. By offering precise, real-time insight into particle size uniformity and morphological integrity, the BeVision D3 contributed directly to process optimization and improved manufacturing yield.
About the Authors
 |
Echo Cao |
 |
Weichen Gan |
|
|
|
BeVision D3Advanced Image Analyzer
|
|
LOGIN TO ACCESS EXCLUSIVE CONTENT
More Resources Including
- Application Notes & Collections
- Webinars & Workshops
- Presentations & Videos
- Monthly Newsletters
- Exclusive Events...

Recommended articles
Rate this article