Inspect the Quality of Pesticides with Laser Diffraction Particle Size Analyzer
2021-09-16Application Note
Particle size affects pesticide quality. Laser diffraction measures distribution for QC, optimizing milling, and ensuring product suitability.
| Product | Bettersizer ST |
| Industry | Agrochemical Analysis |
| Sample | Suspension Concentrate Pesticides |
| Measurement Type | Particle Size |
| Measurement Technology | Laser Diffraction |
Jump to a section:
Abstract: From the key active ingredients to the final pesticide product, particle size is known to have an important role in the residual period, the biological activity, and the stability properties of pesticides. For this reason, measuring the particle size distribution plays a vital role in determining the quality of pesticides during QC inspection. In this application note, particle size distributions of suspension concentrate samples were measured by the laser diffraction method. Typical size values and size distribution curves were compared to evaluate the quality of pesticide samples and to help to optimize the milling process and produce a pesticide that is fit for the specific application.
Keywords: Particle size distribution, laser diffraction, pesticide, suspension concentrate, quality control
Introduction
Pesticides are widely used in the agricultural industry. According to the Food and Agriculture Organization (FAO), a pesticide is defined as any substance or mixture of substances intended for preventing, destroying, or controlling any pest.[1] The pesticide can be in form of a suspension concentrate (SC), emulsion in water (EW), suspo-emulsion (SE), wettable powder (WP), or micro-emulsion (ME). [2]
Measuring the particle size distribution (PSD) is considered a vital part of the quality inspection process for the pesticide industry. The PSD of the pesticide’s active ingredient is related to its photodegradation speed, volatility, and specific surface area. Thus, the residual period and the biological activity of the pesticide are influenced by the PSD of the active ingredients. As for the final products of the pesticide, the PSD of particles, which includes powders but especially droplets, affects the coverage area. In the case of crop spraying, it is important to note that if a spray’s droplets are too large, they will fall onto the leaves and then drop onto the ground. Pesticides
on the ground cannot help to control pests living on crops. If the spray is too fine, winds can carry the spray droplets away from the target area and onto barren land or another farmer’s field. A PSD of droplets in between is what is desired. In addition, the PSD of the dispersed active ingredient particles influences the dispersity and stability of the pesticide product. Accordingly, both the PSD of the active ingredients and the PSD of the final product are indispensable control factors in the pesticide preparation and production process.
The Bettersizer ST, a laser diffraction particle size analyzer, was used for measuring the PSD of pesticide products and their active ingredients in this application note. The patented dual lens optical system (DLOS) in the Bettersizer ST provides a 0.1-1000 μm measuring range, which is suitable to use for most quality inspection processes in the pesticide industry. Besides providing a wide measuring range, the DLOS technique also helps Bettersizer ST provide the user with highly repeatable PSD measurement results efficiently.
Evaluate Pesticide Products with PSD Results
The suspension concentrate (SC) is formed by dispersing insoluble solid active ingredient particles in the aqueous continuous phase. In general, the smaller the active ingredient particles, the shorter the residual period and the better the biological activity of the SC product.
In this experiment, the PSD of three SC samples were measured to evaluate the quality of these samples. These SC samples consist of different formulations containing different wetting agents and dispersants but are made up of the same active ingredient particles. The typical size values of three SC products are shown in table 1. The D50 of formula 2 is significantly smaller than formula 1 and 3, which means that it has a better suspension, and the stability of the SC product is better. Formula 1 has the largest particle size, more than 5 μm, accordingly it is susceptible to sedimentation which thus decreases its storage stability and ultimately shelf life.
|
D10 (μm)
|
D50 (μm)
|
D90 (μm)
|
|
| Formula 1 | 0.810 | 2.766 | 5.921 |
| Formula 2 | 0.353 | 0.887 | 3.106 |
| Formula 3 | 0.672 | 1.739 | 4.730 |
PSD Results help the User to Optimize and Control the Milling Time of SC Product
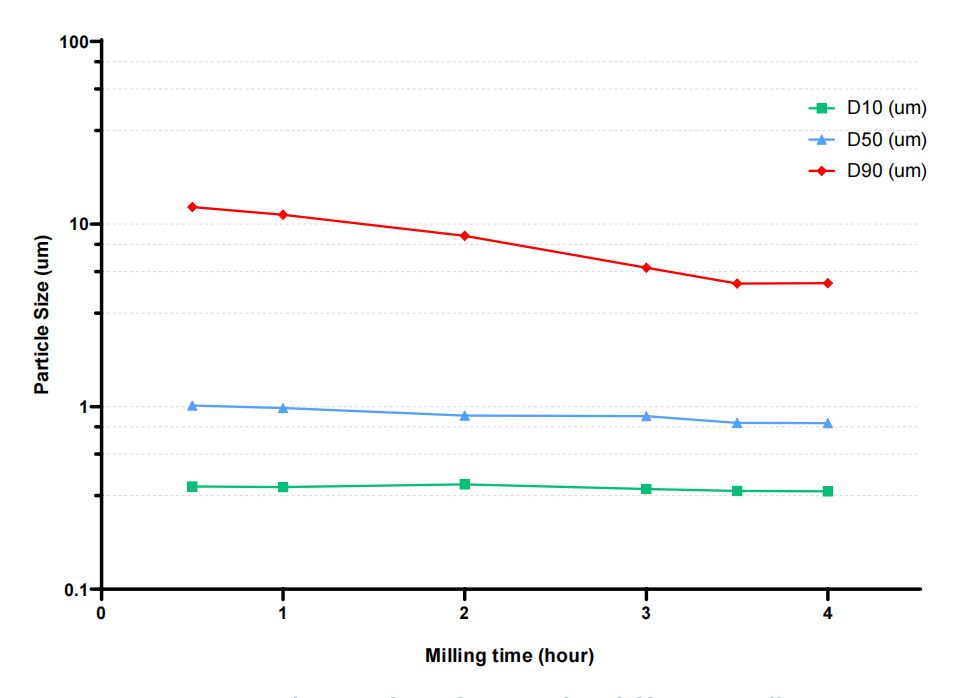
Pre-milling is a widely used method for producing SC products. In this experiment, the effects of different milling time on the particle size distribution of SC were investigated. The typical size values and trend plot are shown in table 2 and figure 1.
It can be seen from table 2 and figure 1 that with the increase of milling time, D50 decreases from 1.015 μm to 0.812 μm, and D90 gradually decreases from 12.39 μm to 4.749 μm. When the milling time is extended from 3.5 hours to 4 hours, the typical size values did not significantly change. As the particles become smaller, the surface area becomes larger, and agglomeration is more likely to occur whenever the Iso Electric Point (IEP) is approached for the formulation. In the absence of an effective dispersant, a finer particle size distribution cannot be obtained by extending milling time, so the typical size values hardly change.
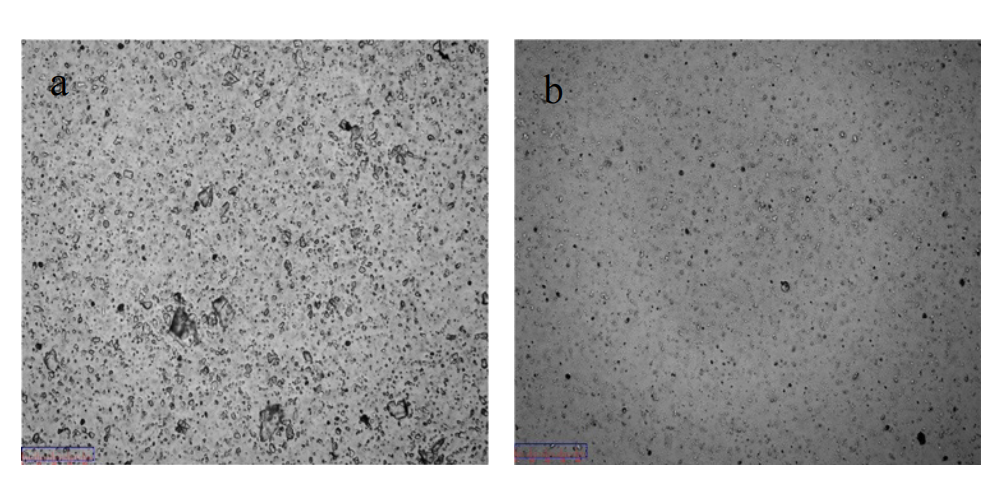
The BeVision S1 image particle size analyzer was used to observe the milled SC particles. As shown in Figure 2, it can be found that the coarse particles above 10 μm existed at 0.5 hours, and the size of particles is much finer after the milling time reached 4 hours. From the above, the distribution of SC under different milling time can be effectively monitored by the laser diffraction particle size analyzer, thereby ensuring the stability of the product performance.
'
| Milling time (hour) | D10 (μm) | D50 (μm) | D90 (μm) |
| 0.5 | 0.365 | 1.015 | 12.39 |
| 1 | 0.363 | 0.982 | 11.25 |
| 2 | 0.375 | 0.893 | 8.623 |
| 3 | 0.354 | 0.886 | 5.772 |
| 3.5 | 0.345 | 0.814 | 4.721 |
| 4 | 0.344 | 0.812 | 4.749 |
Conclusions
Firstly, measuring the PSD of active ingredient particles is vital for evaluating the quality of SC pesticides. With PSD curves, producers could effectively optimize the formula of the components to ensure the best performance of SC pesticide products. Secondly, when processing pesticides, the Bettersizer ST can effectively inspect the product particle size distribution and ensure the stability of the product performance. In summary, for anyone who needs to diagnose problems that are related to the PSD, the Bettersizer ST is a handy tool to quickly provide consistent and reliable PSD results which can reliably be used to optimize the production process.
References
[1] Food and Agriculture Organization of the United Nations. (2002) International Code of Conduct on the Distribution and Use of Pesticides. FAO, Rome, Italy.
[2] CropLife International. (2017) Catalogue of pesticide formulation types and international coding system (7th edition). CropLife International A.I.S.B.L., Brussels, Belgium.
About the Authors
 |
Weichen Gan Senior Engineer @ Application Research Lab, Bettersize Instruments Ltd.
|
|
The Bettersizer ST is a fully automated and integrated particle size analyzer with a smart operation system for wet dispersing.
|
|
LOGIN TO ACCESS EXCLUSIVE CONTENT
More Resources Including
- Application Notes & Collections
- Webinars & Workshops
- Presentations & Videos
- Monthly Newsletters
- Exclusive Events...

Recommended articles
Rate this article