
Particle Size Analysis of Graphite and Detection of Fibrous Impurities Using the BeVision D3 Pro
2026-09-14Application Note
The rapid expansion of artificial intelligence (AI) computing infrastructure has driven unprecedented demand for lithium-ion batteries used in data centers, energy storage systems and electric vehicles. As a result, increasingly stringent requirements are being imposed on the particle size distribution and shape consistency of graphite anode materials.
Fibrous contaminants found in graphite anode powder generally originate from two sources: native graphite fragments generated during processing and external insulating fibers introduced through raw materials or manufacturing operations. The fibrous impurities can disrupt slurry homogeneity and coating uniformity, leading to surface defects such as bumps, streaks and pinholes on electrode sheets.
More importantly, fibrous contaminants can promote localized lithium plating and lithium dendrite growth during charging, creating significant safety risks. They may also increase internal cell resistance, accelerate irreversible capacity loss, and reduce both rate capability and cycle life.
Conventional particle sizing techniques, such as laser diffraction, are unable to distinguish fibrous contaminants from normal graphite particles because they provide only equivalent particle size information. In contrast, dynamic image analysis enables direct visualization and classification of spherical graphite particles, fibrous agglomerates, and individual fibers. By combining particle size and shape measurements, the technique delivers precise quantitative data on each particle population, enabling proactive quality control of graphite raw materials before battery production.
Measurement Method
A BeVision D3 Pro dynamic image particle size and shape analyzer equipped with a BV-H10 Hydro dispersion unit was used to characterize both the particle size distribution and particle shape of a graphite anode material sample.
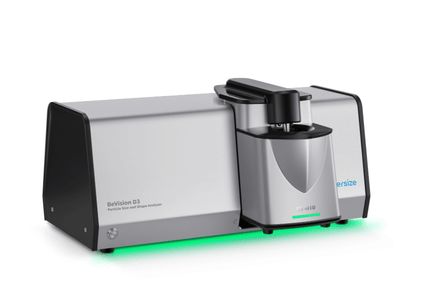
Table 1. Measurement conditions
| Dispersion method | Wet circulation |
| Medium | Water |
| Dispersant | None |
| Number of particles analyzed | 100,000 pcs |
| Measurement time | 2 minutes |
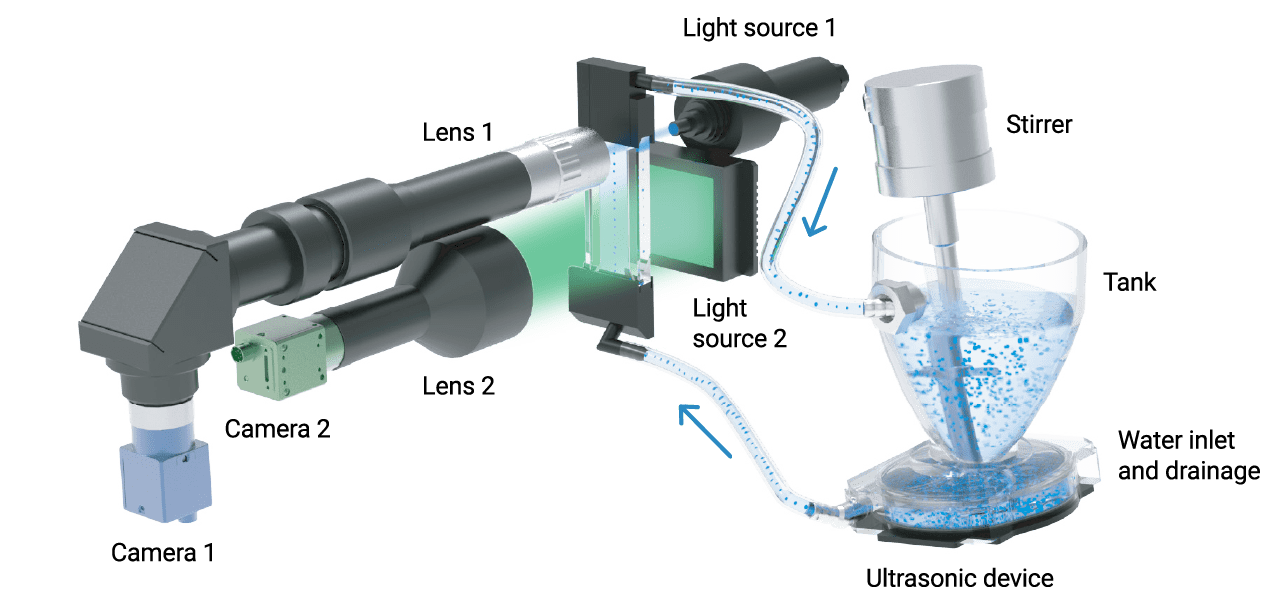
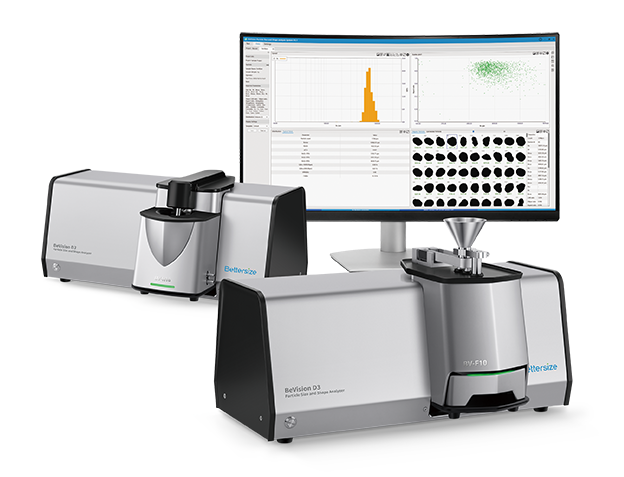
BeVision D3 Pro system configuration for DIA of graphite powders
Results and Discussion
The area-equivalent diameter (XA) was used to characterize graphite particle size. The area-equivalent diameter is defined as the diameter of a circle having the same projected area as the particle.
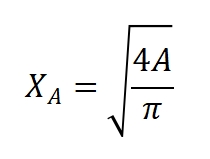
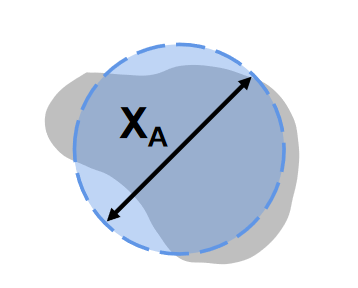
Figure 1. Definition of Area-Equivalent Diameter XA
The maximum Feret diameter (XFmax) was used to characterize fiber length. The Feret diameter is defined as the distance between two parallel tangent lines on opposite sides of a particle’s projected contour. The largest measured Feret diameter of a particle is referred to as the maximum Feret diameter, XFmax.
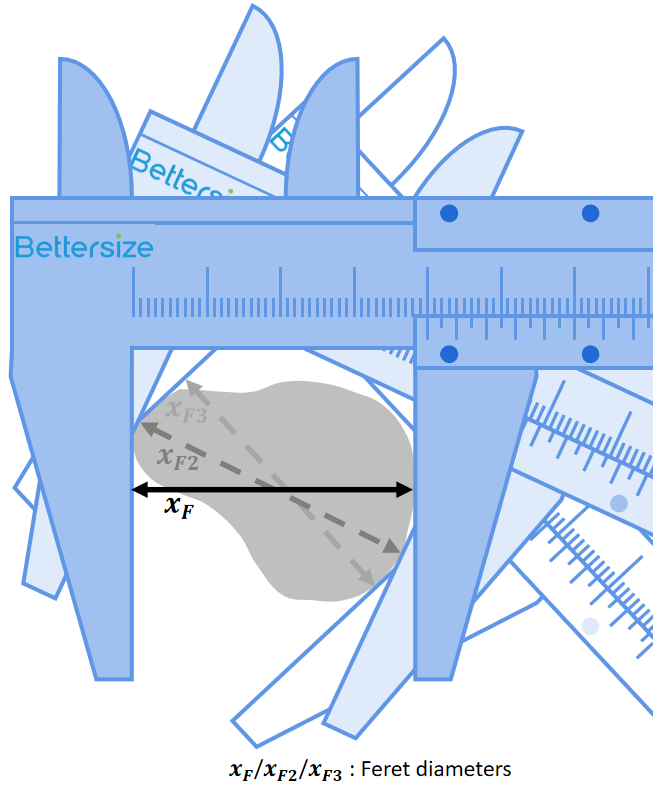
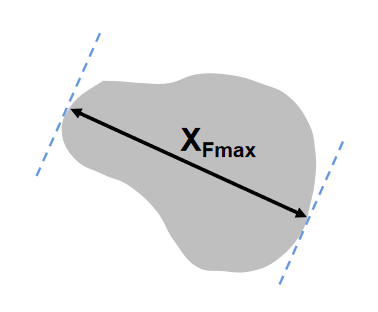
Figure 2. Definition of Maximum Feret Diameter (XFmax)
The minimum Martin diameter (XMmin) was used to characterize fiber width. The Martin diameter is defined as the chord length that divides a particle’s projected area into two equal halves. The shortest Martin diameter measured for a particle is defined as XMmin.
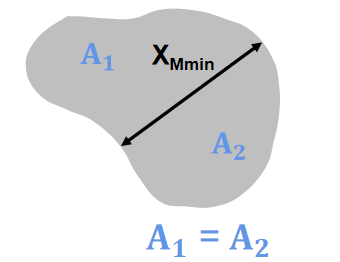
Figure 3. Definition of Minimum Martin Diameter (XMmin)
Circularity CaFmax was used to characterize particle shape. A circularity value approaching 1 indicates a near-spherical particle, whereas lower values indicate increasingly elongated, irregular, or fibrous particle shapes. This parameter provides excellent sensitivity for differentiating spherical graphite particles from fibrous impurities.
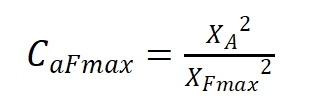
Figure 4. Definition of Circularity CaFmax
Circularity Analysis of Graphite Particles
Table 2 illustrates the relationship between particle shape and circularity. as the circularity value approaches 1, the particle shape becomes increasingly spherical. As circularity decreases, particle shape gradually transitions from spherical particles to fibrous agglomerates and eventually to elongated fibers.
Table 2. Representative Circularity values of different particle types in graphite
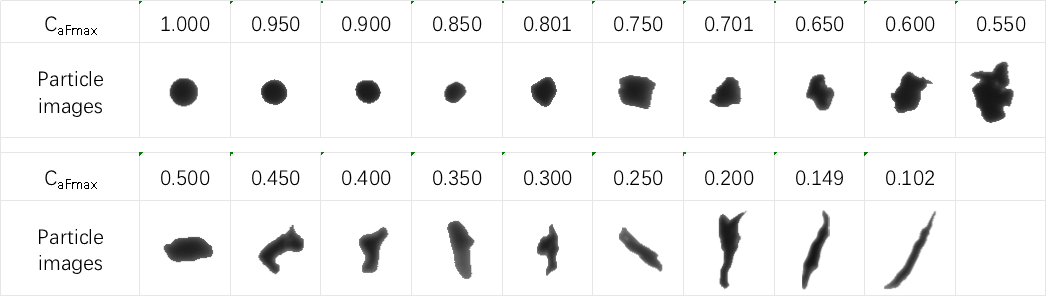
CaFmax > 0.75: Highly spherical graphite particles. These particles represent the desired shape for lithium-ion battery anodes.Their spherical shape promotes excellent powder flowability, high tap density, and efficient conductive network formation within the electrode.
0.50 < CaFmax ≤ 0.75: Fibrous agglomerates. While generally less harmful than true fibers, they can negatively affect tap density and create unstable slurry rheology.
CaFmax ≤ 0.50: High-risk fibrous impurities. These elongated particles represent the most critical contamination category. When incorporated into anode slurries, they may cause localized current concentration, lithium plating, and micro-short circuits, posing serious risks to battery performance and safety.
The BeVision D3 Pro utilizes a high-resolution blue-light imaging system capable of capturing sharp images of ultrafine particles. The BeVision software automatically calculates circularity values for all detected particles and classifies them according to shape without manual intervention.
Compared with optical microscopy and scanning electron microscopy (SEM), dynamic image analysis provides significantly higher throughput and reduces subjective human errors and insufficient sampling representativeness, delivering standardized quantitative criteria for graphite morphology quality control.
Impurity Content Analysis
Traditional laser diffraction reports volume-weighted particle size distributions, which can obscure the presence of trace fibrous contaminants. Dynamic image analysis overcomes this limitation by simultaneously providing both volume-weighted and number-weighted statistics.
This dual-dimensional approach offers more reliable information for graphite raw material inspection and spheroidization process optimization.
Table 3. Volume-weighted and number-weighted proportions of graphite particles
| Circularity range | Volume-weighted proportion | Number-weighted proportion |
|---|---|---|
| CaFmax > 0.75 | 84.10% | 40.98% |
| 0.50 < CaFmax ≤ 0.75 | 11.00% | 21.02% |
| CaFmax ≤ 0.50 | 4.90% | 38.00% |
The results reveal a typical characteristic of fibrous impurities: a relatively low volume fraction, but a high particle count. Although fibers contribute only 4.90% of the total sample volume, they account for approximately 38% of all detected particles. Due to their small individual volume, these particles can remain hidden within the dominant graphite population when analyzed using conventional volume-based methods.
Despite their limited volume contribution, large numbers of fibrous particles can act as initiation sites for lithium plating, micro-short circuits and accelerated capacity degradation during battery cycling. As a result, effective identification and removal during incoming material inspection is essential for battery safety and long-term performance.
Size Analysis of Spherical Graphite Particles
Particles with circularity values greater than 0.75 were isolated using the software’s particle filtering function. Their particle size distribution was then analyzed using the area-equivalent diameter, XA.
The resulting particle size distribution exhibits a narrow span with minimal coarse-particle or ultrafine-particle tails, indicating excellent control of both spheroidization and classification processes. Uniform particle size and shape are critical for maintaining consistent electrode compaction density and cell-to-cell capacity uniformity making them key quality attributes for high-performance anode materials.
The BeVision D3 Pro particle filtering capability enables users to remove interference from fibrous impurities and evaluate the size distribution of only the spherical graphite fraction, supporting process optimization and product consistency.
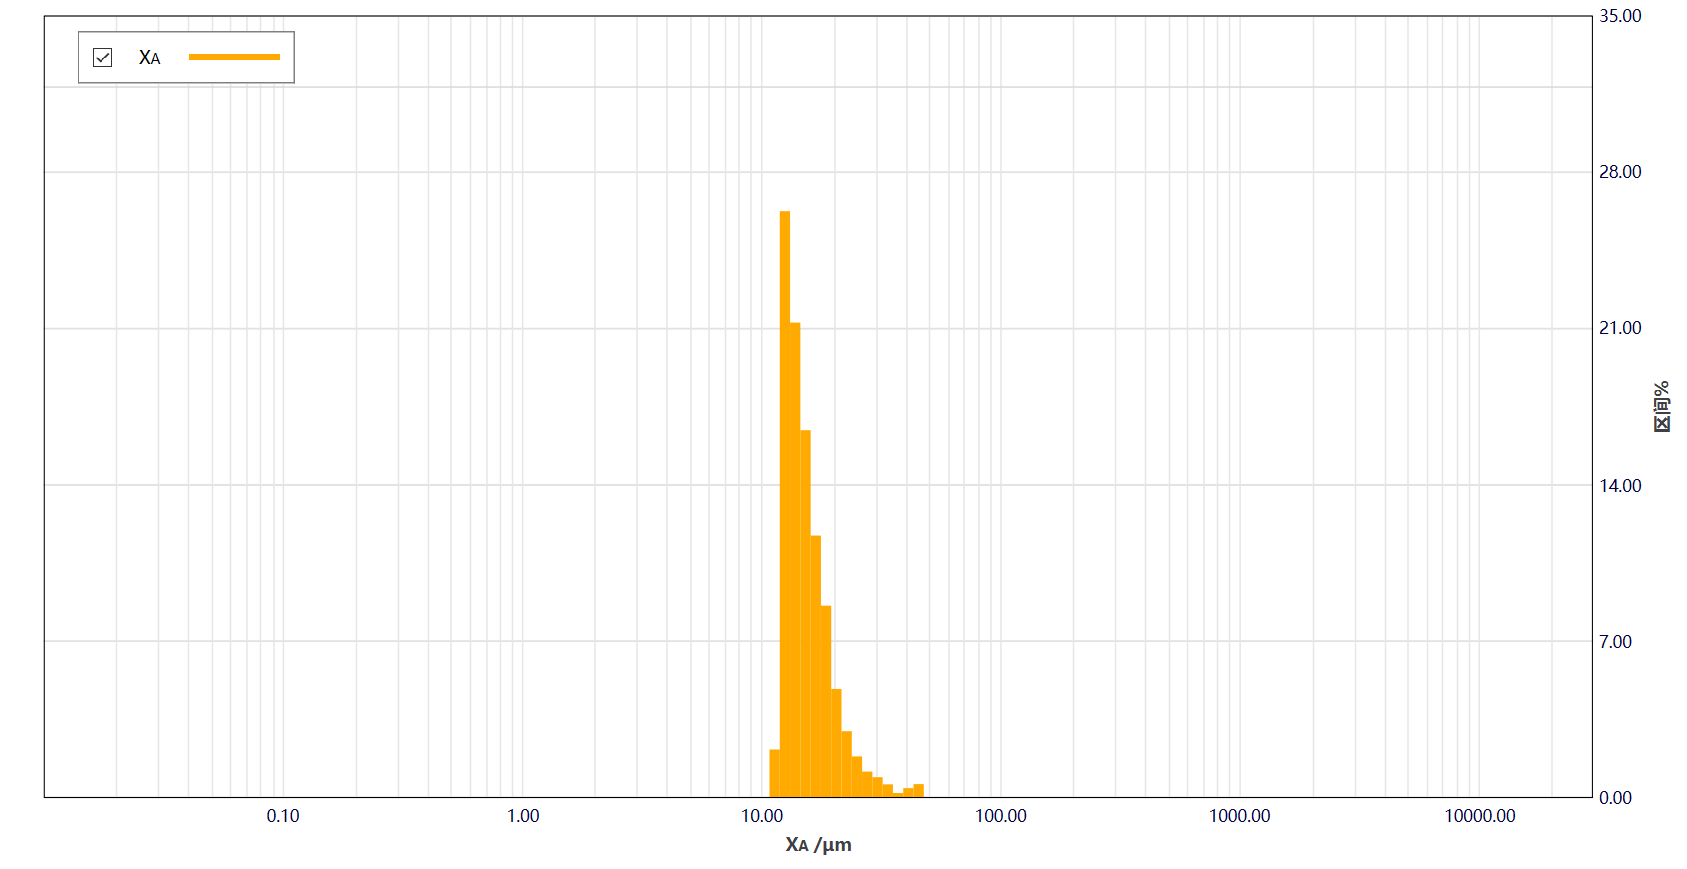
Figure 5. Particle size distribution of highly spherical graphite
Size Analysis of Fibrous Impurities
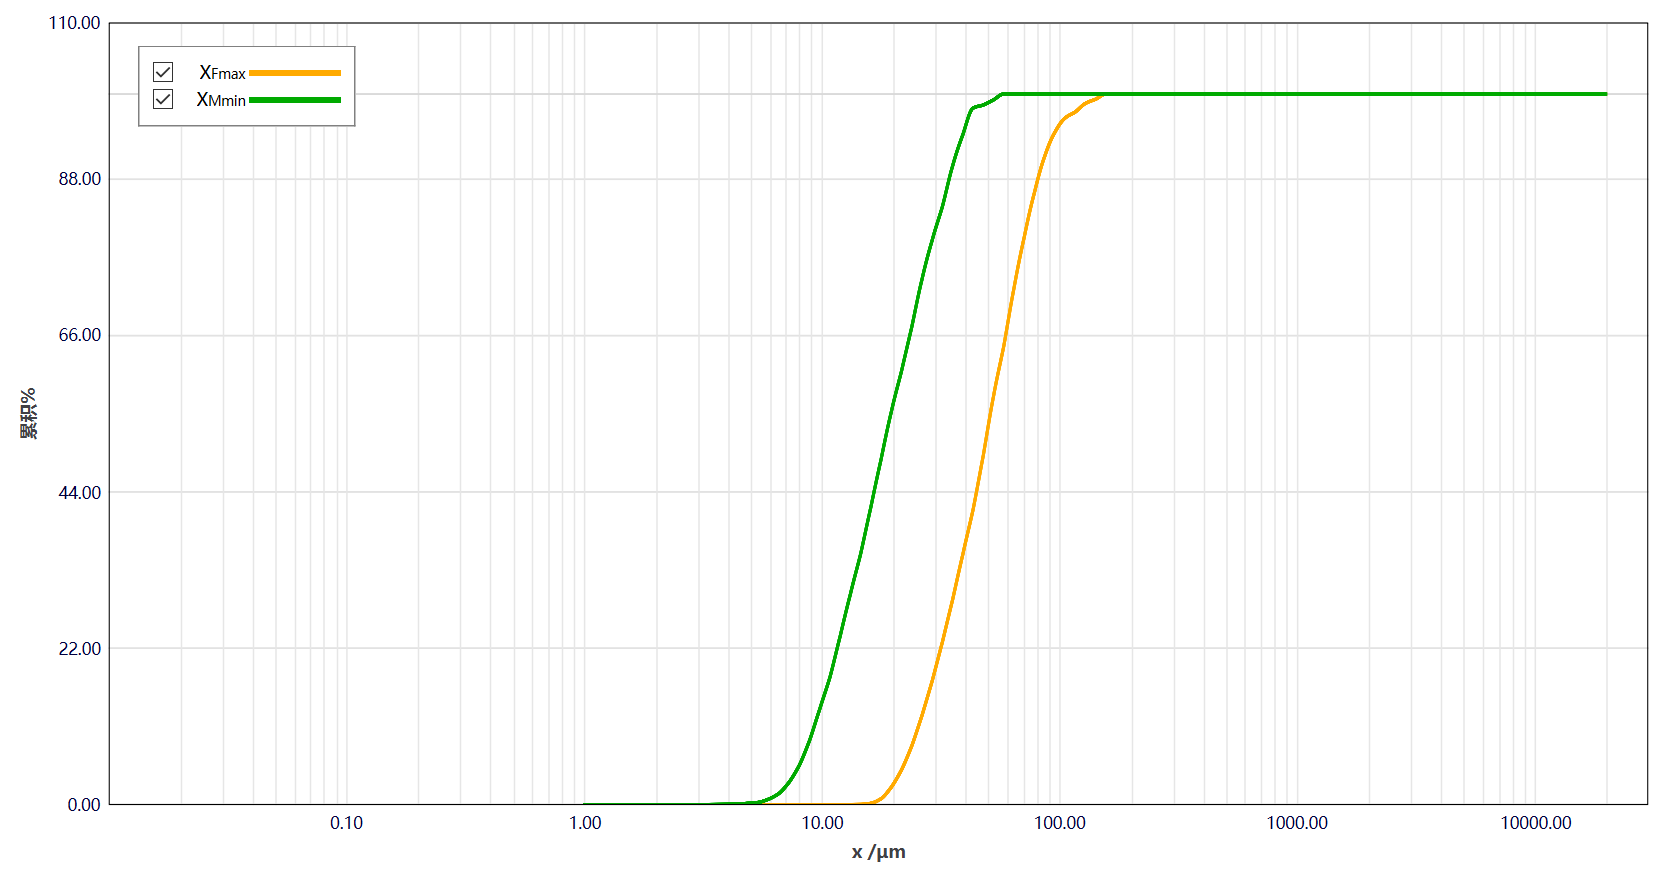
Figure 6. Length (XFmax) and Width (XMmin) distribution curves of fibrous impurities
Particles with circularity values below 0.75 were isolated and analyzed separately. The maximum Feret diameter (XFmax) was used to characterize fiber length, while the minimum Martin diameter (XMmin) was used to characterize fiber width. Together, these parameters provide a quantitative assessment of the potential impact of fibrous contaminants on slurry coating processes and battery performance.
Table 4. Length (XFmax) and Width (XMmin) statistics of fibrous impurities
| Parameter | Values |
|---|---|
| XFmax10 | 23.95 μm |
| XFmax50 | 47.37 μm |
| XFmax90 | 82.37 μm |
| XMmin10 | 9.14 μm |
| XMmin50 | 17.80 μm |
| XMmin90 | 36.15 μm |
The results show a median fiber length (XFmax50) of 47.37 μm, while 90% of fibers are shorter than 82.37 μm. The median fiber width (XMmin50) is 17.80 μm, with 90% of fibers narrower than 36.15 μm.
The BeVision software supports user-defined length and width thresholds for automatic identification and quantification of high-risk fibers. In addition, particle images are retained for visual verification and traceability.
This integrated workflow combines quantitative analysis, qualitative observation and evidence retention, supporting pass/fail evaluation of incoming materials and facilitating root-cause analysis of contamination events.
Conclusion
Fibrous impurities in lithium-ion battery anode graphite can significantly affect slurry processing, electrode quality, battery performance and cell safety. Due to fundamental limitations in measurement principles, traditional methods such as laser diffraction cannot effectively identify or quantify shape defects, leaving critical blind spots in quality control.
Equipped with the BV-H10 Hydro dispersion unit, the BeVision D3 Pro dynamic image particle size and shape analyzer provides comprehensive characterization of graphite anode materials by combining particle size measurement with detailed shape analysis of fibrous impurities.
The BeVision D3 Pro enables standardized particle classification through a high-resolution imaging system, advanced features, particle filtering function, and circularity algorithm analysis, clearly distinguishing spherical graphite particles from high-risk fibrous impurities.
The BeVision software, which eliminates interference from foreign matter and generates accurate particle size distribution for the spherical graphite fraction, alone supporting optimization of spheroidization and classification processes.
By simultaneously reporting both volume-weighted and number-weighted impurity statistics, the BeVision D3 Pro reveals hidden contamination risks that may be overlooked by conventional particle sizing techniques.
With the ability to analyze more than 100,000 particles within two minutes, the BeVision D3 Pro combines high throughput with excellent statistical representativeness, making it suitable for both laboratory research and high-volume incoming inspection in battery manufacturing environments.
About the Author
 |
Echo Cao Application Engineer @ Bettersize Instruments |
|
|
BeVision D3 Series
|
LOGIN TO ACCESS EXCLUSIVE CONTENT
More Resources Including
- Application Notes & Collections
- Webinars & Workshops
- Presentations & Videos
- Monthly Newsletters
- Exclusive Events...

Recommended articles
Rate this article