Concentration Measurement of Silica Polishing Slurry with the BeNano 180 Zeta Max
2025-05-12Application Note
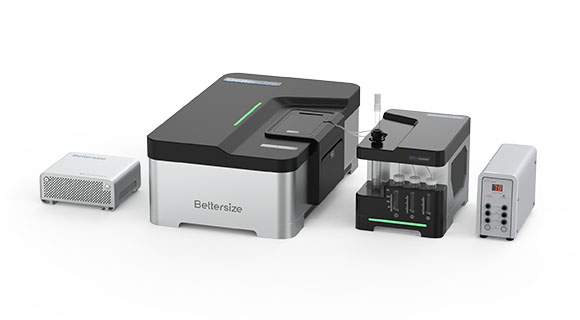
With the advanced LEDLS technology, BeNano 180 Zeta Max offers researchers an efficient path to precise characterization of silica polishing slurry and similar materials.
| Product | BeNano 180 Zeta Max |
| Industry | Chemicals |
| Sample | Silica Polishing Slurry |
| Measurement Type | Particle Concentration |
| Measurement Technology | Light Extinction—Dynamic Light Scattering (LEDLS) |
Jump to a section:
Introduction
Silica polishing slurry is an essential component in the semiconductor industry, where its concentration significantly impacts key processes like coating, etching, and deposition. Precise measurement of slurry concentration is vital for maintaining process stability and reliability while optimizing particle dispersion and overall solution performance. If the concentration is too high, particles may aggregate, reducing dispersion stability. Conversely, an in-suffcient concentration can lead to inadequate film coverage, compromising process quality.

There are several techniques for measuring particle concentration, including light scattering, light obscuration, and electrical resistance methods. The BeNano 180 Zeta Max, an anoparticle size and zeta potential analyzer designed by Bettersize, employs a unique LEDLS (Light Extinction and Dynamic Light Scattering) approach. This method allows for precise measurement of particle volume fraction and number concentration across a broad size spectrum. As an innovative technique, LEDLS eliminates the need for toluene calibration before measurement, streamlines operation, and supports single-angle concentration measurement.
This note presents the characterization of silica polishing slurry in terms of particle size and concentration using the BeNano 180 Zeta Max.
Experimental
The BeNano 180 Zeta Max is equipped with a high-performance laser to illuminate the sample within the sample cell, while scattered light is collected at a 173° angle using an APD detector. Additionally, a photodiode detector positioned at 0° measures transmission intensity. A disposable PS cuvette was used during the procedure.
A refractive index of 1.45 and an absorption of 0.0001 were used as the optical parameters of the silica particles for these measurements. Each sample was measured three times, and the average result was recorded.
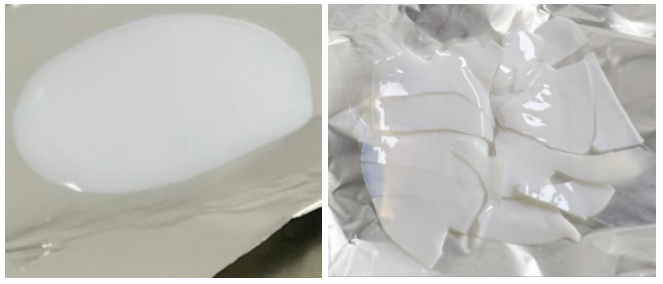
The silica polishing slurry consisted of a water-silica mixture. To determine the theoretical volume fraction of silica, 1 mL of the solution was placed on a clean aluminum foil sheet, with an initial total mass of 1561.5 mg. The sample was dried in an oven at 70°C for three hours until the mass stabilized, indicating complete water evaporation. The final recorded mass was 972.3 mg. Accordingly, 1 mL of the sample contains 0.5892 mL of water and 0.4108 mL of silica, resulting in a theoretical silica volume fraction of 41%.

Silica solutions of different theoretical concentrations were prepared using 10 mM NaCl as a diluent. The solutions were diluted 100 times (0.41% v/v), 1000 times (0.041% v/v), and 10000 times (0.0041% v/v). Particle size was measured using dynamic light scattering (DLS), and concentration was determined using LEDLS.
Results and Discussion
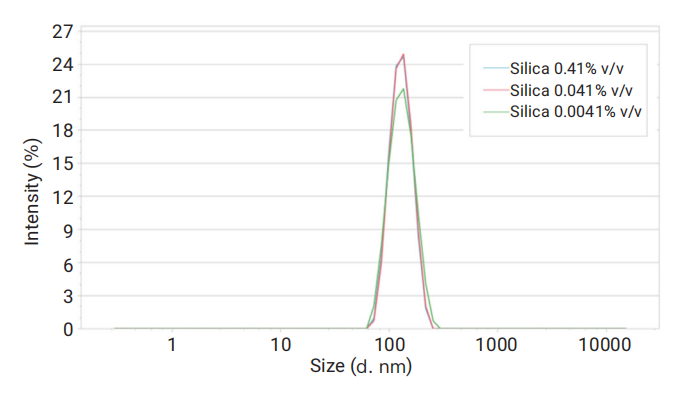
The BeNano 180 Zeta Max was used to characterize the particle size of silica spheres. Figure 3 displays the intensity distribution curves across different concentrations. The data reveals a single-peak distribution, indicating that particle sizes remained unchanged regardless of dilution, thereby confirming sample stability.
| Sample | Theoretical Volume Fraction | Z - Average (nm) | PDI |
| Silica Slurry | 0.41% | 130.26 | 0.008 |
| 0.041% | 133.27 | 0.048 | |
| 0.0041% | 128.95 | 0.005 |
Table 1 summarizes the Z-average sizes and polydispersity indices (PDI) for different silica concentrations. The average size was approximately 130 nm, with a PDI below 0.05, indicating a narrow monodisperse distribution across all concentrations.
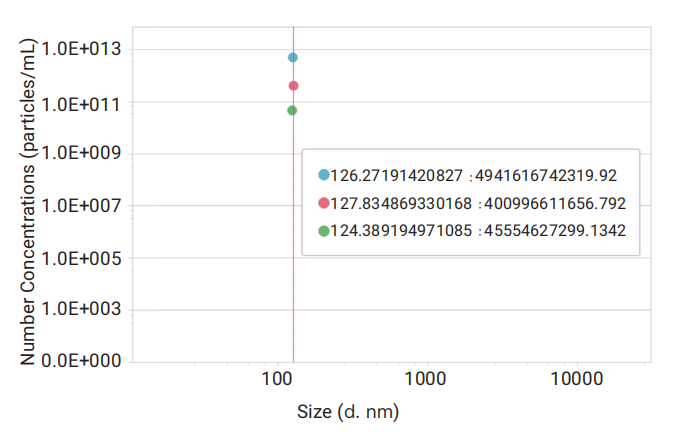
Silica concentration was determined using the Bettersize BeNano 180 Zeta Max. Figure 4 illustrates the particle number concentrations for 130 nm silica spheres at different dilution levels. The x-axis represents the volume-weighted particle size measured via dynamic light scattering (DLS), while the y-axis indicates the number concentration derived from LEDLS.
The theoretical volume fractions were 0.41%, 0.041%, and 0.0041%, corresponding to theoretical number concentrations of 3.56E+12, 3.56E+11, and 3.56E+10 particles/mL. The LEDLS measurements yielded volume fractions of 0.4289%, 0.0373%, and 0.0038%, with number concentrations of 4.94E+12, 4.01E+11, and 4.56E+10 particles/mL. The measured values exhibited strong linear correlation with dilution factors, maintaining a near 10-fold ratio.

The appropriate size and concentration range for particle concentration measurement depend on both particle size and optical properties. Typically, particles within the 100 nm to 400 nm range allow for a broader concentration measurement range. Figure 5 shows that for 130 nm silica spheres, measured values aligned closely with theoretical concentrations within a range of 1E+10 to 1E+12 particles/mL.
BeNano 180 Zeta Max
Conclusion
This application note highlights the effectiveness of the BeNano 180 Zeta Max in measuring silica polishing slurry concentration using the LEDLS technique. LEDLS simplifies sample preparation, enables rapid measurements, and delivers consistent, reliable results. For 130nm silica particles within the optimal concentration range, the measured values closely aligned with theoretical predictions, demonstrating the accuracy and dependability of this method.
About the Authors
 |
Zhibin Guo Application Manager @ Bettersize Instruments |
 |
Dr. Ning Chief Product Officer @ Bettersize Instruments |
|
BeNano 180 Zeta Max Advanced Nanoparticle Size & Zeta Potential Analyzer
|
|
LOGIN TO ACCESS EXCLUSIVE CONTENT
More Resources Including
- Application Notes & Collections
- Webinars & Workshops
- Presentations & Videos
- Monthly Newsletters
- Exclusive Events...

Recommended articles
Rate this article