Characterizing Iron Dextran Preparation with the BeNano 90
2022-01-13Application Note
BeNano 90 characterizes iron dextran injections, detecting size differences & aggregates crucial for drug stability & efficacy.
| Product | BeNano Series |
| Industry | Pharmaceuticals |
| Sample | Iron Dextran Preparation |
| Measurement Type | Particle Size |
| Measurement Technology |
Jump to a section:
Iron dextran is a liquid complex comprised of ferric hydroxide and dextran, which is used to treat iron deficiency anemia through intramuscular injection. In a clinical setting, it is used in patients who cannot be treated with oral iron supplements or those who need immediate and sufficient iron supplements.
The size and size distribution of iron dextran are closely related to the manufacturing process of the preparation, and, in turn, impact bioavailability, efficacy, and immune response produced by the final product significantly. In addition, product stability could be evaluated by monitoring the size and size distribution of the preparation. In this application note, a comparison study on the size distributions of one commercially available and one R&D stage iron dextran was carried out.
Instrumentation
The BeNano 90 nanoparticle size analyzer (Bettersize Instruments Ltd.) was utilized with a solid-state laser source of a wavelength of 671 nm and a power of 50 mW. An avalanche photodiode (APD) detector was used to collect scattered light signals at 90 degrees. Single-mode fibers were incorporated for signal transmission in order to increase the signal-to-noise ratio.
Sample Preparation
Commercially available and R&D stage iron dextran were measured in this study. The stock solutions of both samples were dark-brown suspensions, indicating high absorbance. The stock solutions were diluted with deionized water 100 times, respectively, and the measurements were performed at 25 °C with the built-in temperature control unit in the Bettersize BeNano 90. Each sample was measured at least three times to obtain the standard deviations of sizes and investigate the result repeatability.
Results and Discussion
By analyzing the original scattered light signals, the correlation functions of samples are calculated, as shown below in Figures 1 and 2.
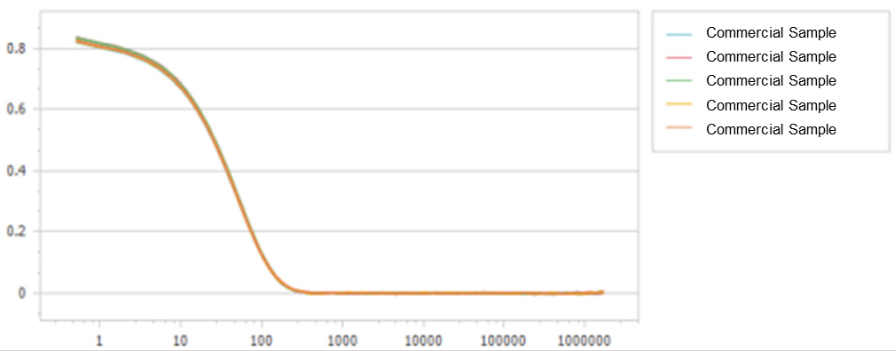
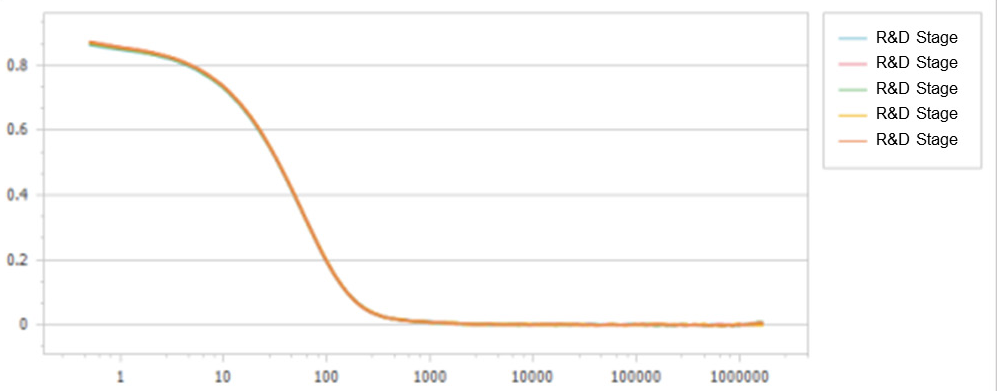
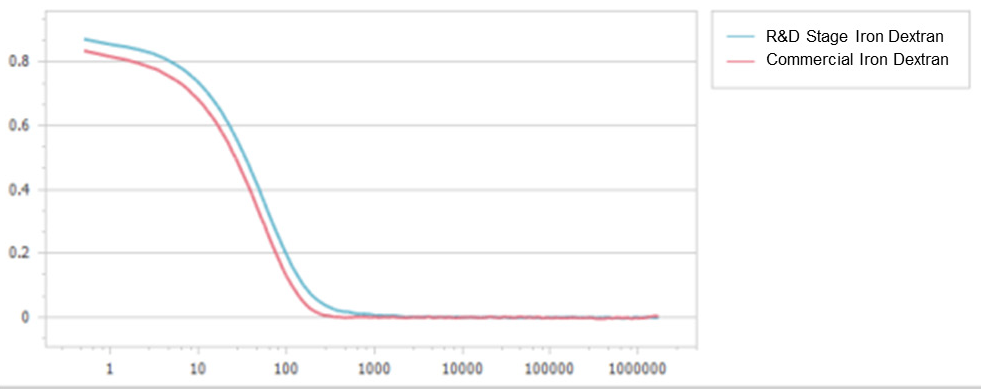
As illustrated, both correlation functions display high signal-to-noise ratios and excellent repeatability. However, their decay rates show slight deviations from each other, as shown in Figure 3.
The correlation function of the commercially available sample decayed more rapidly than that of the R&D stage sample. This, thereby, illustrates that the R&D stage iron dextran was larger in size than the commercially available one, and its particles diffused more slowly.
Table 1 shows that the R&D stage iron dextran shows a larger Z-average size and a larger polydispersity index (PD.I), compared with the commercially available one.
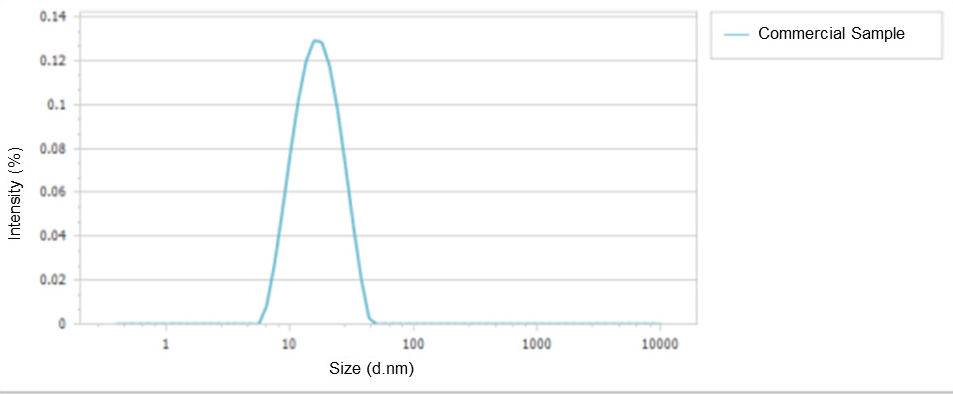
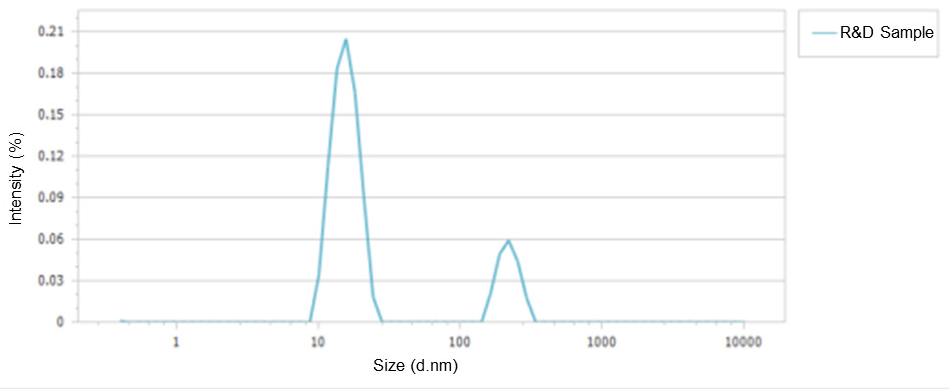
The particle size distributions of two iron dextran preparations are displayed in Figure 4 and Figure 5, demonstrating the narrow distribution of sizes in the commercially available sample, compared with the two peaks from the R&D stage sample. Such an additional peak at around 200 nm suggests the presence of aggregates in the R&D stage sample.
| Iron Dextran Sample | Z - average Size (nm) | PD.I |
| Commercially Available |
15.78 ± 0.27
|
0.089 |
| R & D Stage |
22.25 ± 1.26
|
0.230 |
Conclusion
In this application note, the BeNano 90 was used to characterize two iron dextran injections, a commercially available one and an R&D stage one. Size differences were successfully distinguished, and the presence of aggregates in the R&D sample was ascertained. With regards to the injection preparations, particular attention needs to be paid to the formation of aggregates, due to their significant effect on the drug stability, efficacy, and immune response. Hence, the BeNano 90 with its excellent sensitivity for aggregates or large particles will be extremely useful and convenient as a research tool for injection preparation.
About the Authors
 |
Zhibin Guo Application Manager @ Bettersize Instruments |
 |
Dr. Ning Chief Product Officer @ Bettersize Instruments |
|
Advanced Nanoparticle Size & Zeta Potential Analysis
|
|
LOGIN TO ACCESS EXCLUSIVE CONTENT
More Resources Including
- Application Notes & Collections
- Webinars & Workshops
- Presentations & Videos
- Monthly Newsletters
- Exclusive Events...

Recommended articles
Rate this article