Absolute Molecular Weight Determination of HSAs using the BeSEC
2026-01-13Application Note
Abstract: Human serum albumin (HSA) is widely used in biomedical, pharmaceutical, and industrial applications, where accurate molecular weight determination is essential. In this study, size-exclusion chromatography coupled with static light scattering and refractive index detection was applied to determine the absolute molecular weight and aggregation states of HSA, enabling reliable identification and quantification of monomeric and oligomeric species.
Keywords: Human serum albumin (HSA), Absolute molecular weight, Protein aggregation, Size-exclusion chromatography (SEC), Static Light Scattering, Biopolymer characterization
| Product | BeSEC |
| Industry | |
| Sample | Human serum albumin (protein) |
| Measurement Type | Absolute molecular weight and protein aggregation analysis |
| Measurement Technology |
Size-Exclusion Chromatography (SEC), Static Light Scattering
|
Introduction
Human serum albumin (HSA) is the most abundant protein in plasma, playing a critical role in maintaining colloid osmotic pressure and transporting a wide range of endogenous and exogenous substances. Clinically, HSA is used to restore blood volume in cases of shock or burns, treat hypoalbuminemia in liver cirrhosis or nephrotic syndrome, and serves as a drug carrier due to its strong binding capacity.
In research, HSA is widely employed as a standard due to its high purity and stability, and it supports cell growth as a key component in culture media. Beyond biomedical applications, HSA is incorporated into skincare formulations to enhance moisture retention and strengthen the skin barrier. In specialized foods, it provides high quality protein and contributes to emulsification and stability.
Experimental Section
-
Detectors: Light Scattering (LS) + Refractive Index (RI)
-
Column: Shodex PROTEIN LW-803
-
Mobile phase: Phosphate-buffered saline (PBS)
-
Flow rate: 0.7 mL/min
-
Injection volume: 100 μL
-
Column temperature: 40 °C
-
dn/dc: 0.185 mL/g
Results and Discussion
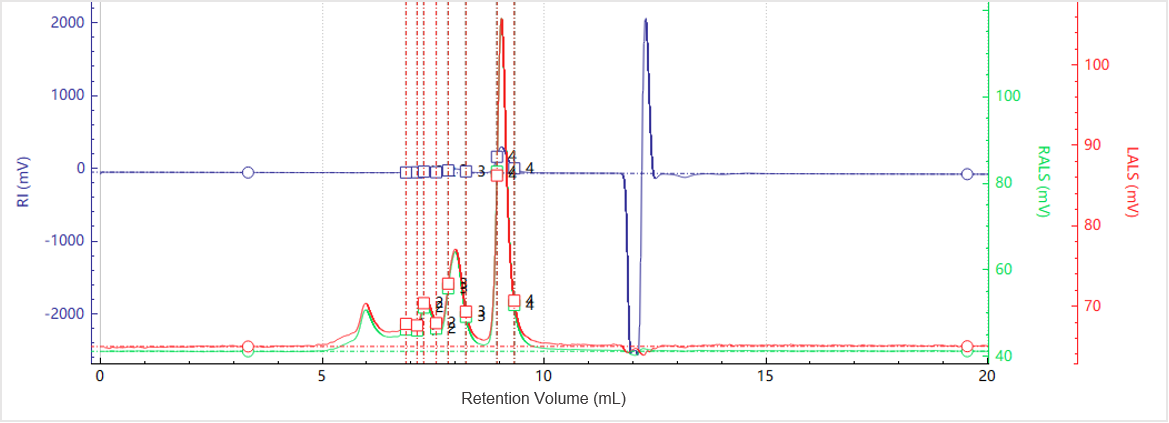
Figure 1. Elution profiles of the multi-detector signals for Sample A
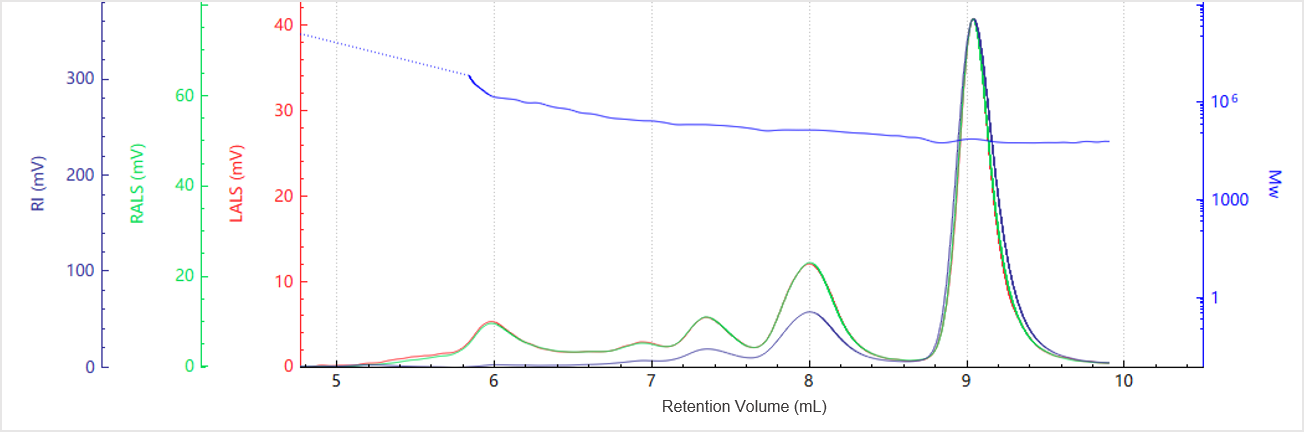
Figure 2. Elution profile of the molecular weight for Sample A
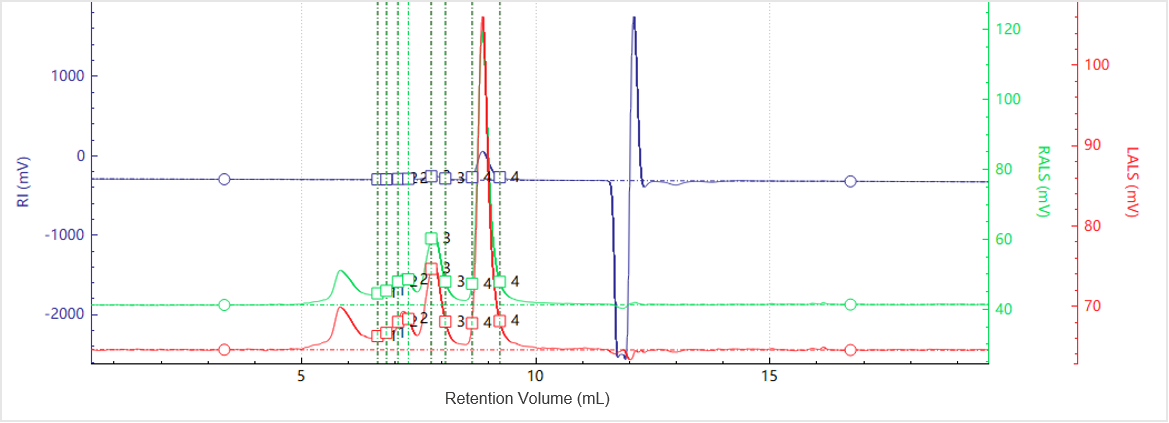 Figure 3. Elution profiles of the multi-detector signals for Sample B
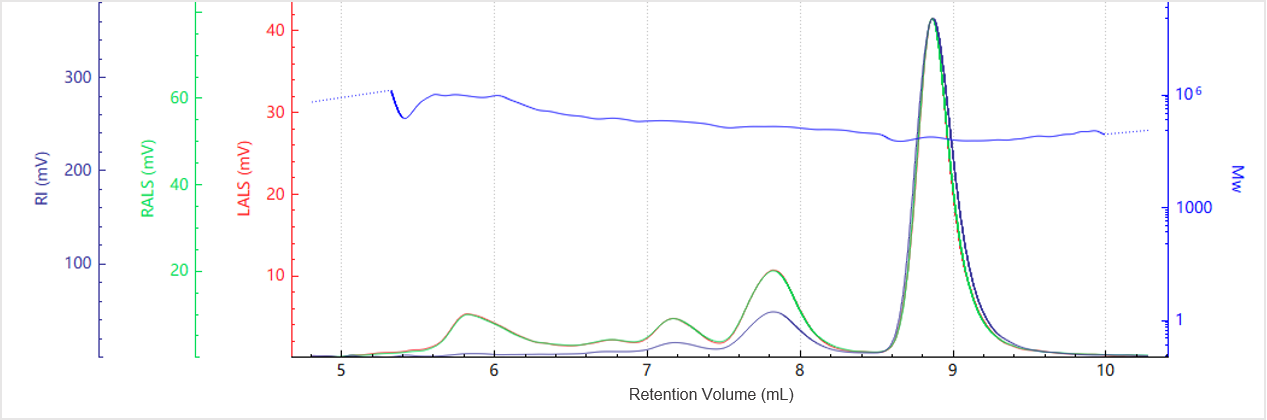
|
Peak |
Sample A |
Sample B |
||
|
Mw (Da) |
Area (%) |
Mw (Da) |
Area (%) |
|
|
Peak 1 |
274,459 |
1.5 |
271,545 |
1.7 |
|
Peak 2 |
199,148 |
4.6 |
201,826 |
3.8 |
|
Peak 3 |
138,694 |
16.5 |
141,070 |
14.4 |
|
Preak 4 |
68,516 |
76.1 |
68,403 |
77.3 |
Conclusion
About the Authors
 |
Zhibin Guo |
BeSECAdvanced Light Scattering Detector
|
 |
LOGIN TO ACCESS EXCLUSIVE CONTENT
More Resources Including
- Application Notes & Collections
- Webinars & Workshops
- Presentations & Videos
- Monthly Newsletters
- Exclusive Events...

Recommended articles
Rate this article