
Particle Size and Shape Analysis of Abrasives Using the BeVision D3 Pro
2026-09-14Application Note
Silicon carbide (SiC) and brown fused alumina are key abrasive raw materials used in precision grinding, polishing, grinding wheel manufacturing, and semiconductor wafer dicing. Particle size and particle angularity (or sphericity) directly influence grinding forces, workpiece surface roughness, grinding wheel hardness, and service life.
Abrasive particles with sharp edges and low sphericity deliver high cutting efficiency yet are more likely to scratch precision components. Excessively broad particle size distributions can lead to non-uniform grinding textures and reduced product yield. In addition, elongated needle-like and flaky particles decrease the packing density of grinding wheels and increase the risk of wheel cracking during manufacturing and use.
Traditional laser diffraction particle size analyzers provide only equivalent particle diameters and cannot characterize particle shape. In contrast, dynamic image particle size and shape analyzers can measure hundreds of thousands of particles in a single test while simultaneously determining particle size and shape parameters. The system automatically quantifies the fraction of particles with different sphericity levels through intuitive visual analysis. It provides comprehensive quantitative data for abrasive classification, crushing and shaping process optimization, and incoming quality inspection, making it an indispensable tool for advanced quality control in the abrasive industry.
Measurement Method
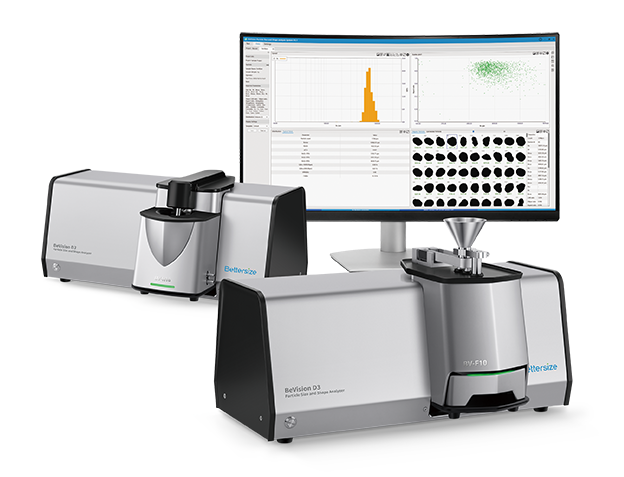
A BeVision D3 Pro dynamic image particle size and shape analyzer equipped with a BV-H10 Hydro dispersion unit was used to simultaneously characterize the particle size and shape of silicon carbide (SiC) and brown fused alumina powder samples.
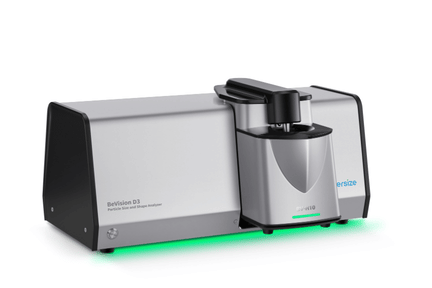
Table 1. Results of three repeatability tests
|
Dispersion method |
Wet circulation |
|
Medium |
Water |
|
Dispersant |
None |
|
Number of particles analyzed |
100,000 pcs |
|
Measurement time |
1.5 minutes |
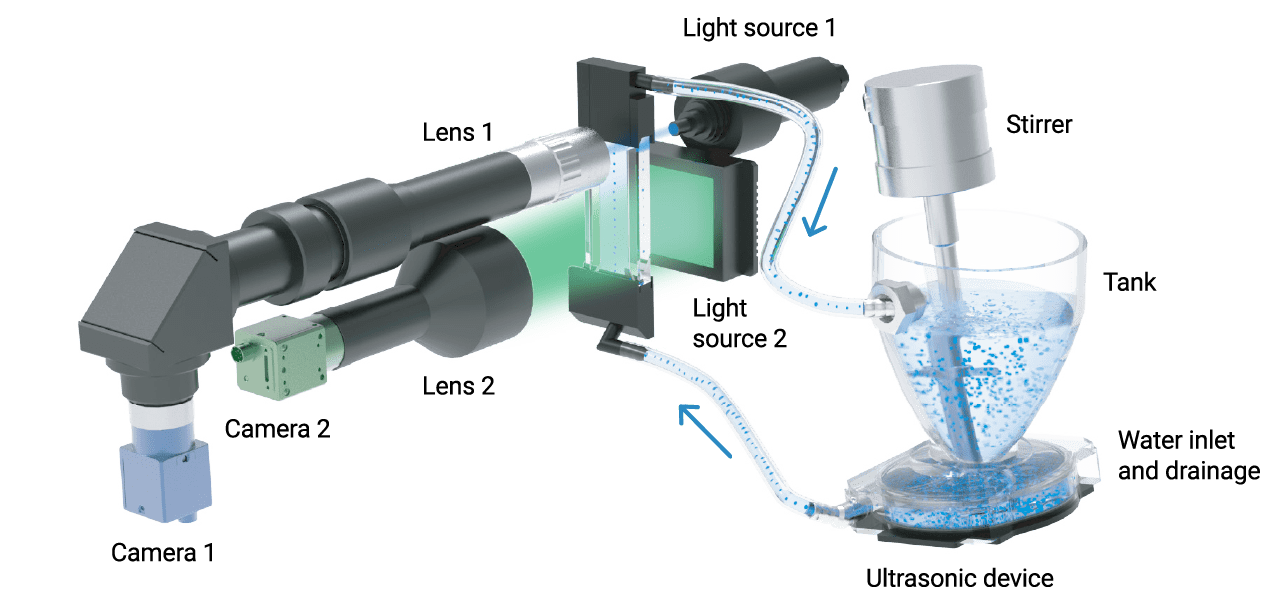
BeVision D3 Pro system configuration for DIA of powders
Results and Discussion
The area-equivalent diameter XA was used to characterize the particle size of the abrasive powders. The area-equivalent diameter is defined as the diameter of a circle having the same projected area as the particle.
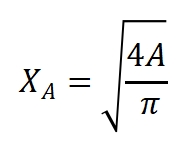
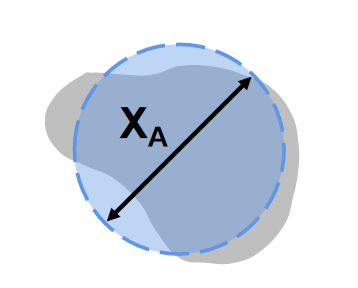
Figure 1. Definition of Area-Equivalent Diameter XA
Circularity Ca (or sphericity) was used to characterize the angularity of abrasive particles. A circularity value closer to 1 indicates a more rounded particle, whereas lower values indicate increasingly angular particle shapes. Circularity is the ratio of area-equivalent diameter to perimeter-equivalent diameter, and is calculated according to the following equation:
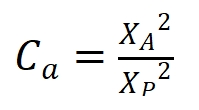
Where XA is the area-equivalent diameter; XP is the perimeter-equivalent diameter.
Figure 2. Definition of Circularity Ca
Analysis of Silicon Carbide (SiC)
The cumulative size distribution curves reveal that SiC 1 is significantly finer, with a D50 value of 7.81 μm, whereas SiC 2 exhibits a broader and coarser particle size distribution with a D50 of 16.67 μm.
The repeatability of D10 and D50 measurements for both samples is better than 0.25% demonstrating excellent measurement precision with extremely low relative standard deviations. The Hydro wet dispersion system of BeVision D3 Pro effectively disperses agglomerates in ultrafine SiC powders. By analyzing more than 100,000 particles, random statistical errors are substantially reduced. In addition, the built-in image processing software automatically eliminates blurred and out-of-focus particles, minimizing measurement bias. As a result, the system provides highly stable and accurate particle size measurements, even for micron-scale abrasive materials.
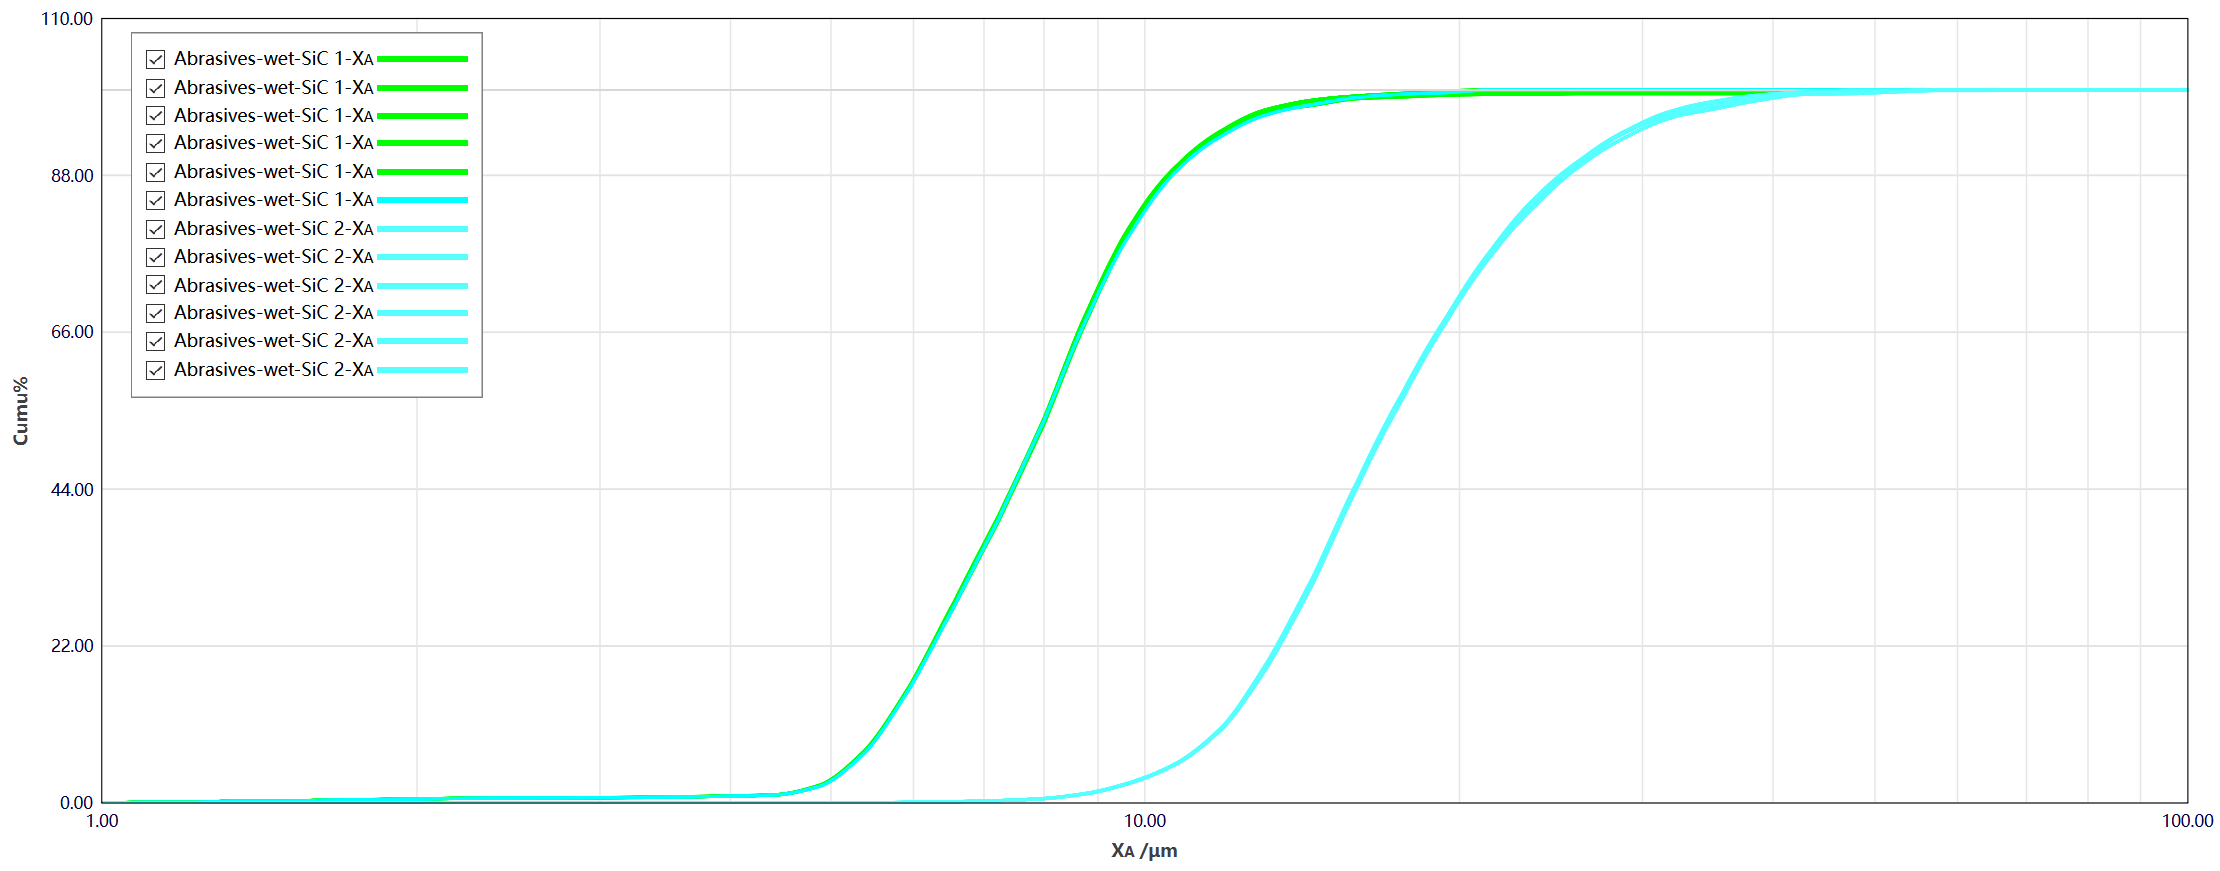
Figure 3. Cumulative particle size distribution curves of SiC powders
Table 2. Results of six replicate measurements
|
Sample |
Parameter |
Mean value |
Std. dev. |
Repeatability |
|
SiC 1 |
D10 |
5.58 μm |
0.01 μm |
0.18% |
|
D50 |
7.81 μm |
0.01 μm |
0.13% |
|
|
D90 |
10.92 μm |
0.05 μm |
0.46% |
|
|
SiC 2 |
D10 |
11.78 μm |
0.01 μm |
0.08% |
|
D50 |
16.67 μm |
0.04 μm |
0.24% |
|
|
D90 |
26.28 μm |
0.20 μm |
0.76% |
Table 3. Circularity values of representative SiC particles
Circularity (Ca) is an effective quantitative parameter for characterizing silicon carbide particle shape. As shown in the representative particle images, particle shape gradually changes as Ca decreases from 0.927 to 0.145. Particles evolve from sub-rounded shapes with smooth contours to angular fragments and ultimately to elongated needle-like and flaky particles.
Particles with Ca values above 0.85 are relatively rounded and provide gentler grinding performance but lower cutting efficiency. Particles with Ca values between 0.60 and 0.85 exhibit moderate angularity, offering a favorable balance between grinding efficiency and surface finish quality. Particles with Ca values below 0.4 possess sharp edges and highly irregular shapes, increasing the risk of scratching sensitive workpieces such as precision silicon wafers.
Furthermore, excessive amounts of needle-like and flaky particles can reduce grinding wheel packing density and increase the likelihood of wheel cracking.
As shown in Figure 4, the circularity of most SiC particles falls within the range of 0.60 to 0.85. The proportion of low-circularity, highly angular particles increases with particle size, which is consistent with the shape characteristics expected from mechanically crushed materials.
SiC 2 exhibits a higher overall circularity (Ca50= 0.799) than SiC 1 (Ca50= 0.757), indicating that the coarser SiC sample contains fewer sharp edges and therefore presents a lower risk of scratching workpiece surfaces.
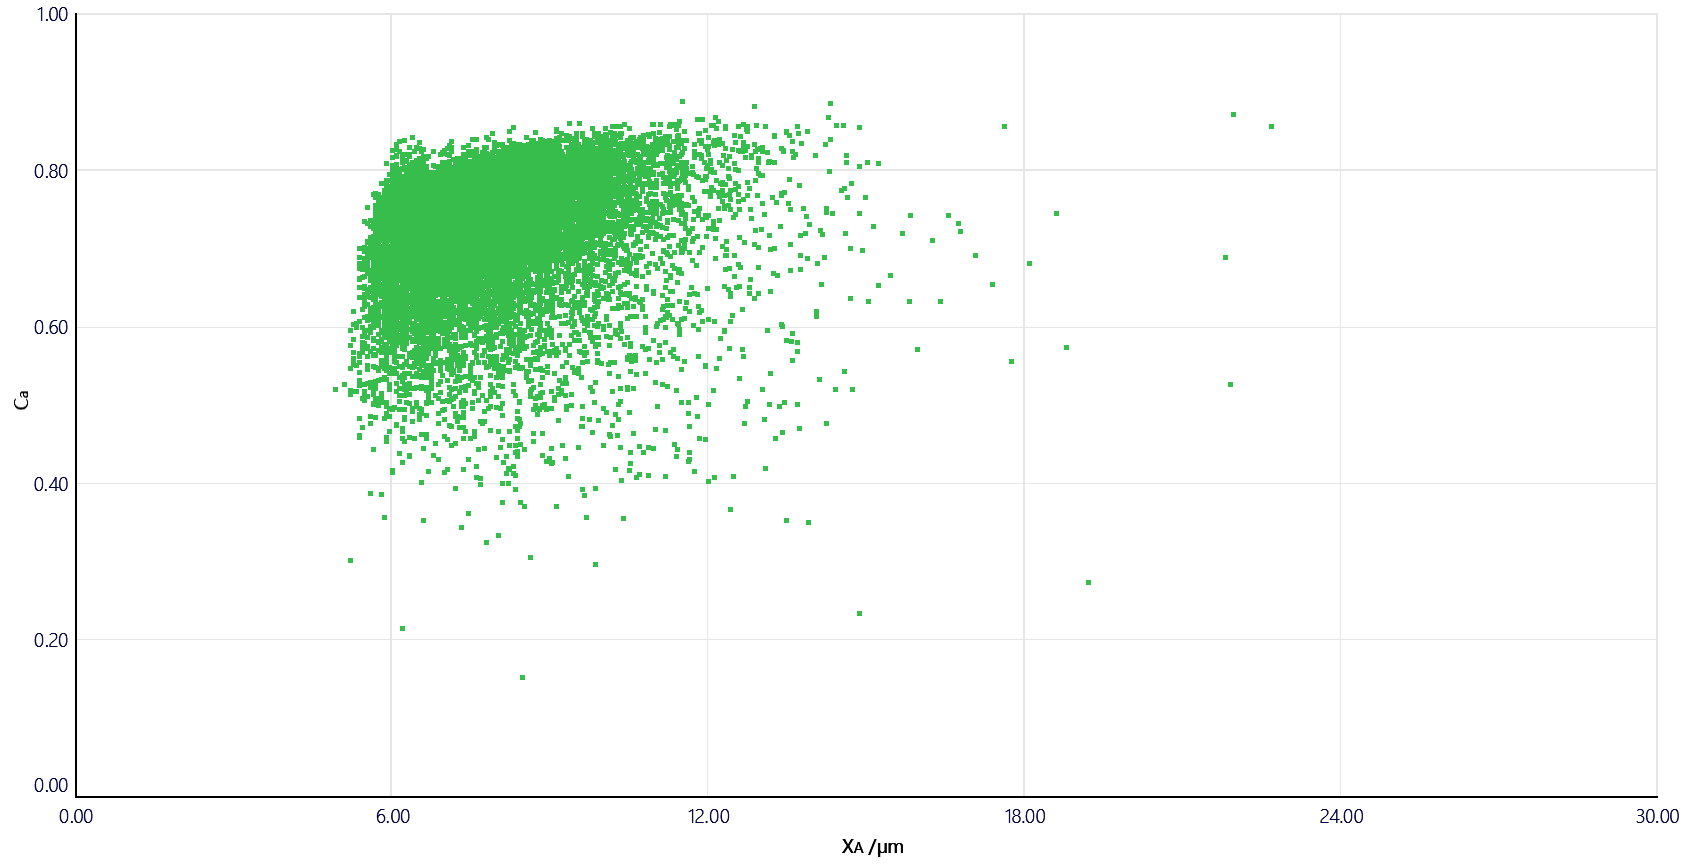
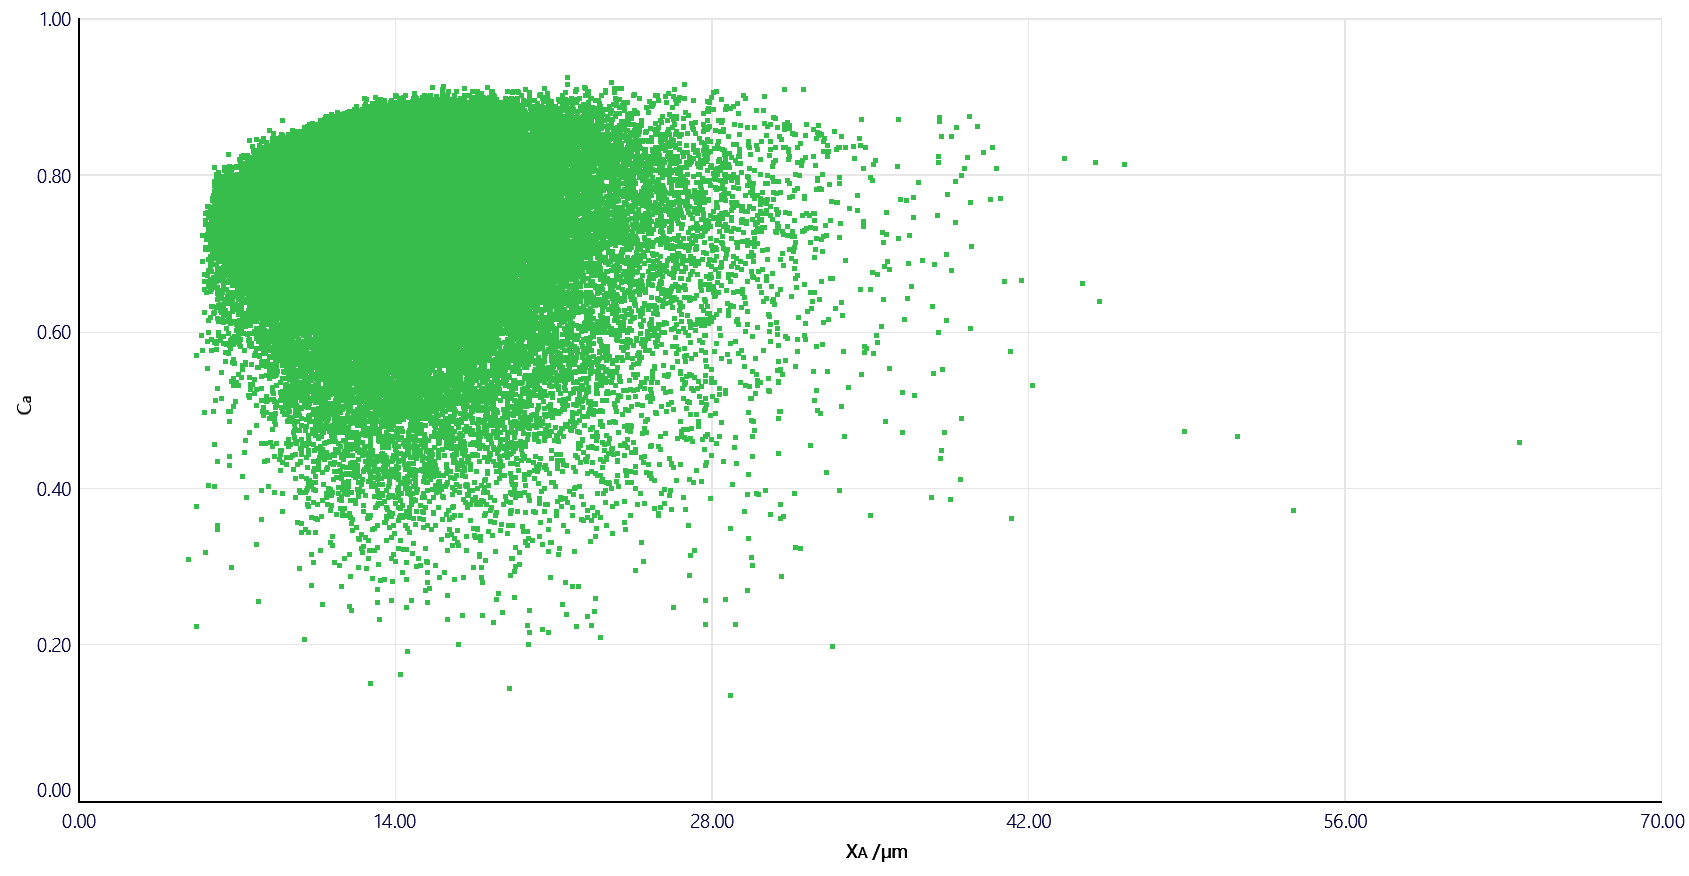
Figure 4. Particle size vs. Circularity (Ca) scatter plots of SiC powders (Left: SiC 1; Right: SiC 2)
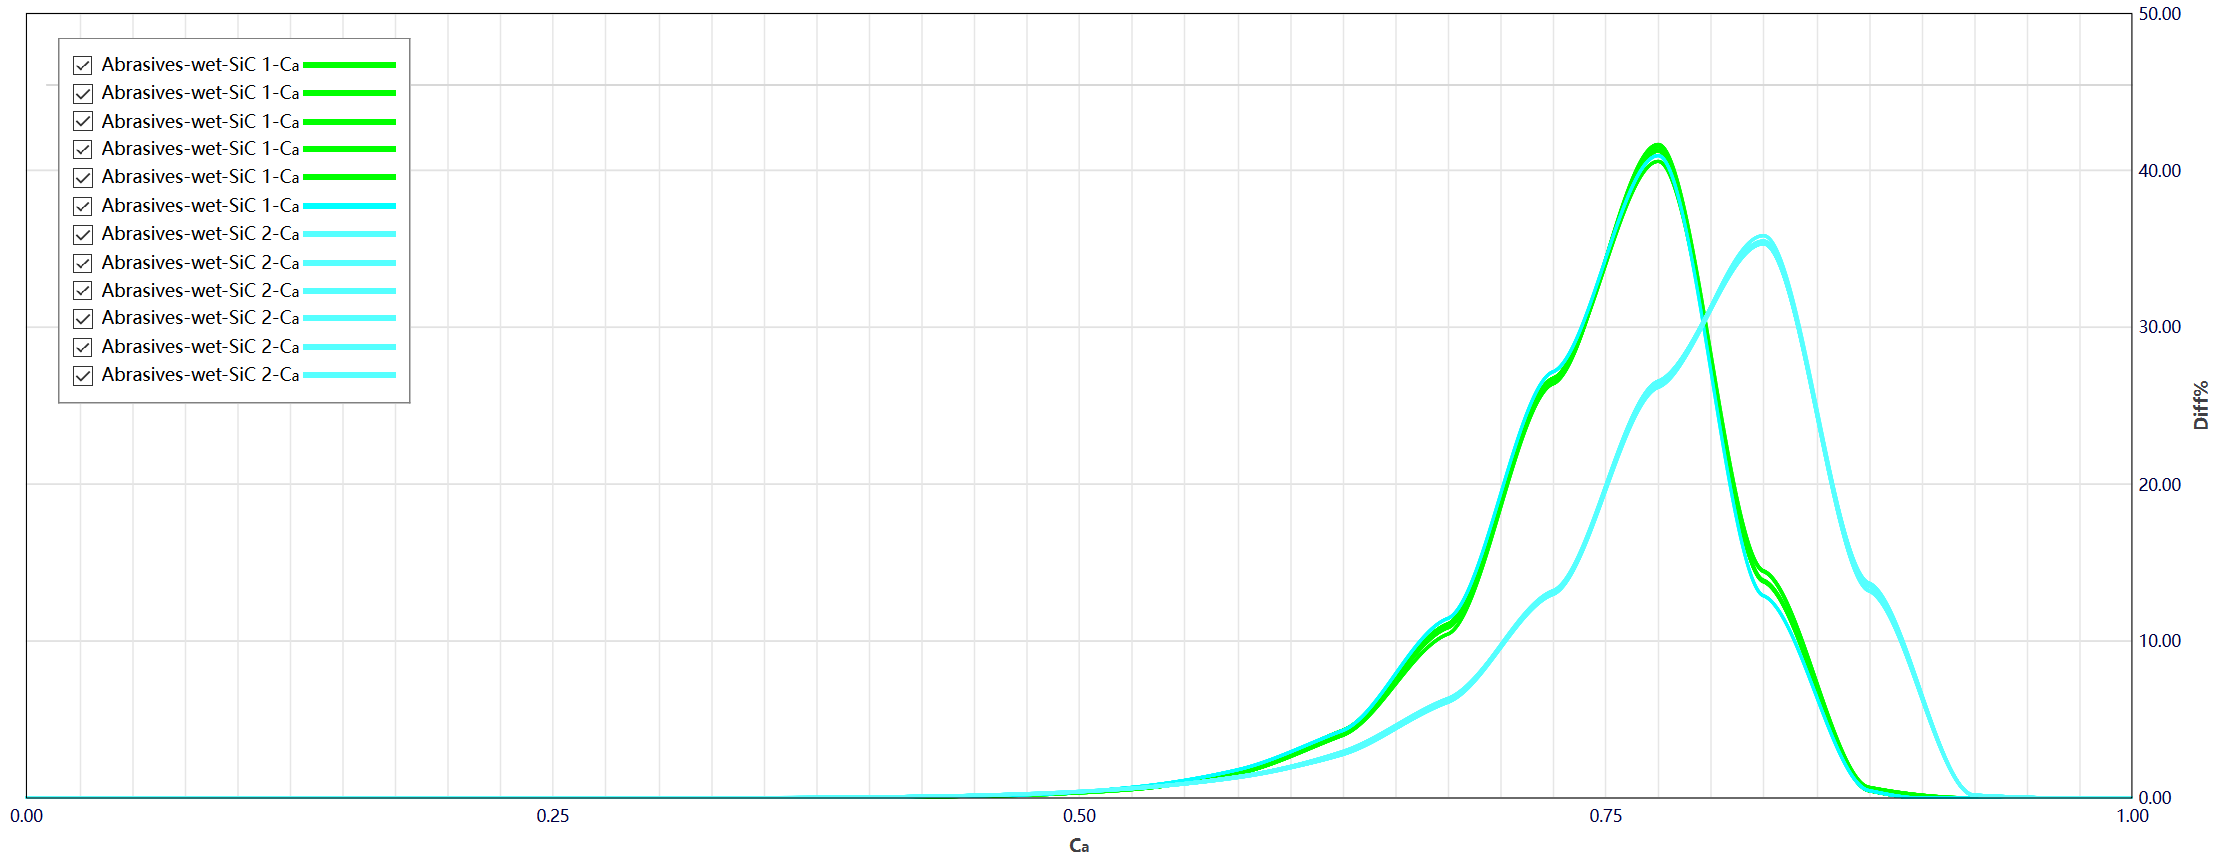
Figure 5. Circularity Ca distribution curves of SiC powders
Table 4. Results of six replicate measurements
|
Sample name |
Circularity Ca |
Mean values |
Std. dev. |
Repeatability |
|
SiC 1 |
Ca10 |
0.671 |
0.002 |
0.30% |
|
Ca50 |
0.757 |
0.001 |
0.13% |
|
|
Ca90 |
0.808 |
0.001 |
0.12% |
|
|
SiC 2 |
Ca10 |
0.692 |
0.001 |
0.14% |
|
Ca50 |
0.799 |
0.001 |
0.13% |
|
|
Ca90 |
0.857 |
0.000 |
0.00% |
The repeatability obtained from six replicate measurements is better than 0.5%, demonstrating excellent instrument stability and reproducibility.
Equipped with a high-resolution imaging system, the BeVision D3 Pro accurately captures the sharp edges and contour details of abrasive particles and generates circularity distribution curves for straight forward batch-to-batch comparison. These results provide valuable, guidance for optimizing crushing, shaping, and classification processes, enabling manufacturers to achieve an optimal balance between grinding efficiency and workpiece surface quality.
Analysis of Brown Fused Alumina Powders
Brown fused alumina consists of relatively coarse abrasive particles with distinct particle size distributions across the three tested samples: As shown in Figure 6, Sample 1 has the coarsest particle size distribution, while Sample 3 is the finest. The clearly-separated cumulative distribution curves demonstrate that the BeVision D3 Pro is capable of measuring abrasive materials across a wide particle size range from micron-scale powders to millimeter-scale grains.
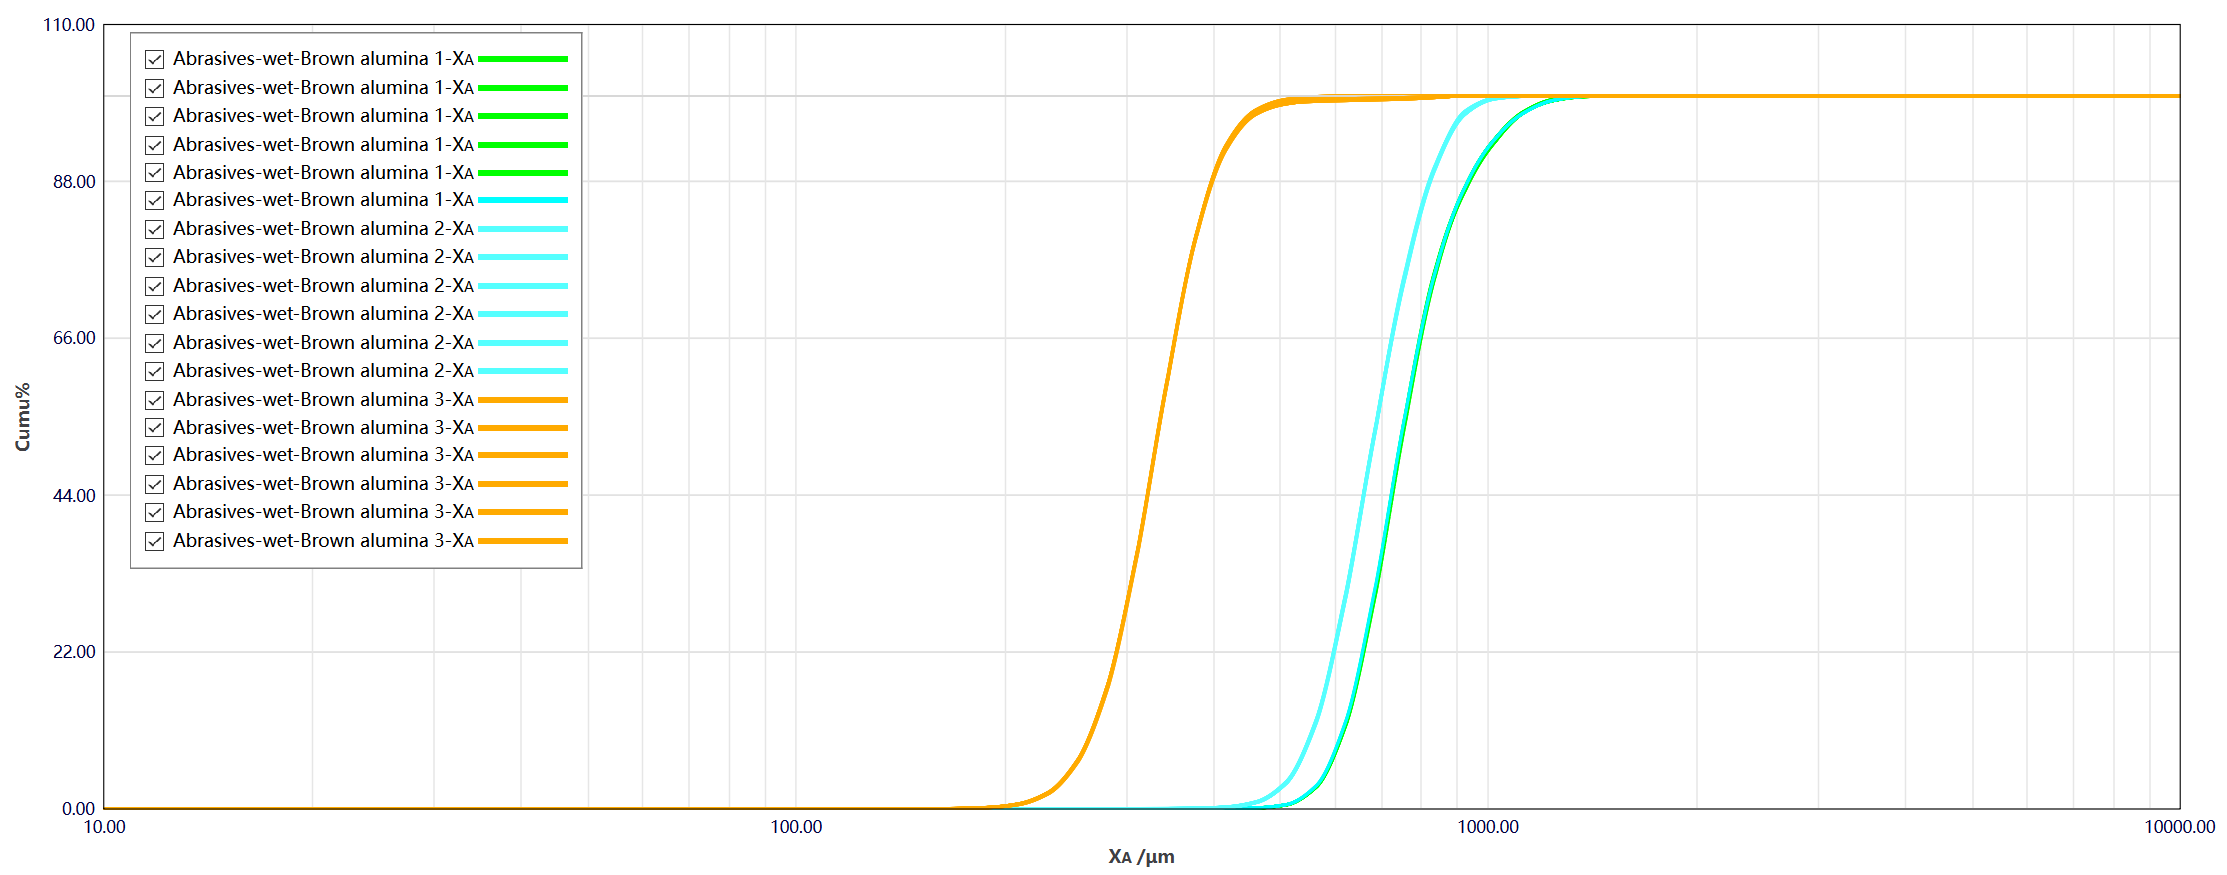
Figure 6. Cumulative particle size distribution curves of brown fused alumina powders
Table 5. Results of six replicate particle size measurements
|
Sample |
Parameter |
Mean value |
Std. dev. |
Repeatability |
|
Brown fused alumina 1 |
D10 |
613.88 μm |
0.94 μm |
0.15% |
|
D50 |
744.21 μm |
1.44 μm |
0.19% |
|
|
D90 |
961.72 μm |
2.77 μm |
0.29% |
|
|
Brown fused alumina 2 |
D10 |
554.15 μm |
0.84 μm |
0.15% |
|
D50 |
678.16 μm |
0.69 μm |
0.10% |
|
|
D90 |
839.11 μm |
1.21 μm |
0.14% |
|
|
Brown fused alumina 3 |
D10 |
265.88 μm |
0.42 μm |
0.16% |
|
D50 |
330.44 μm |
0.20 μm |
0.06% |
|
|
D90 |
405.95 μm |
0.90 μm |
0.22% |
The particle size repeatability for all brown fused alumina samples is better than 0.5%, demonstrating excellent measurement precision. The specialized circulation design of the BV-H10 Hydro dispersion unit effectively prevents sedimentation of coarse particles during measurement.
Integrated stirring and ultrasonic dispersion modules eliminate agglomeration and air bubbles while maintaining a homogenous particle suspension, thereby minimizing measurement errors caused by particle settling or sample stratification.
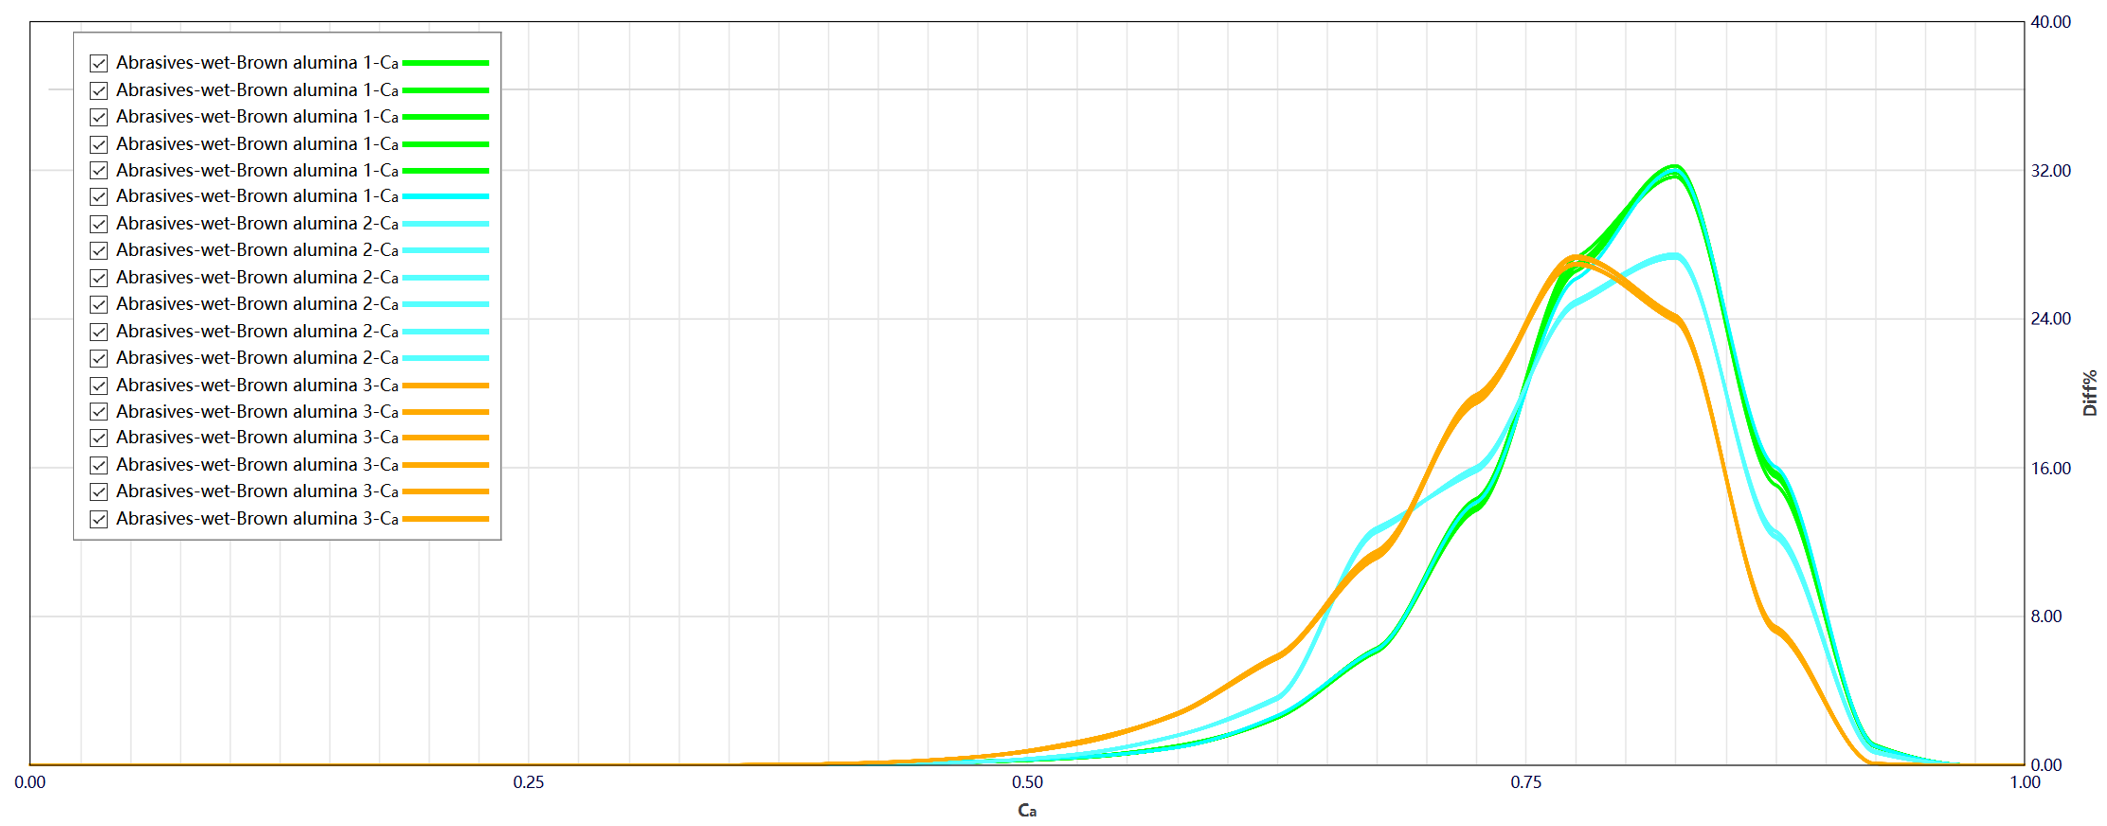
Figure 7. Circularity (Ca) distribution curves of brown fused alumina powders
Table 6. Results of six replicate circularity measurements
|
Sample |
Parameter |
Mean value |
Std. dev. |
Repeatability |
|
Brown fused alumina 1 |
Ca10 |
0.697 |
0.000 |
0.00% |
|
Ca50 |
0.798 |
0.001 |
0.13% |
|
|
Ca90 |
0.864 |
0.000 |
0.00% |
|
|
Brown fused alumina 2 |
Ca10 |
0.677 |
0.002 |
0.30% |
|
Ca50 |
0.784 |
0.001 |
0.13% |
|
|
Ca90 |
0.858 |
0.000 |
0.00% |
|
|
Brown fused alumina 3 |
Ca10 |
0.647 |
0.001 |
0.15% |
|
Ca50 |
0.767 |
0.000 |
0.00% |
|
|
Ca90 |
0.843 |
0.000 |
0.00% |
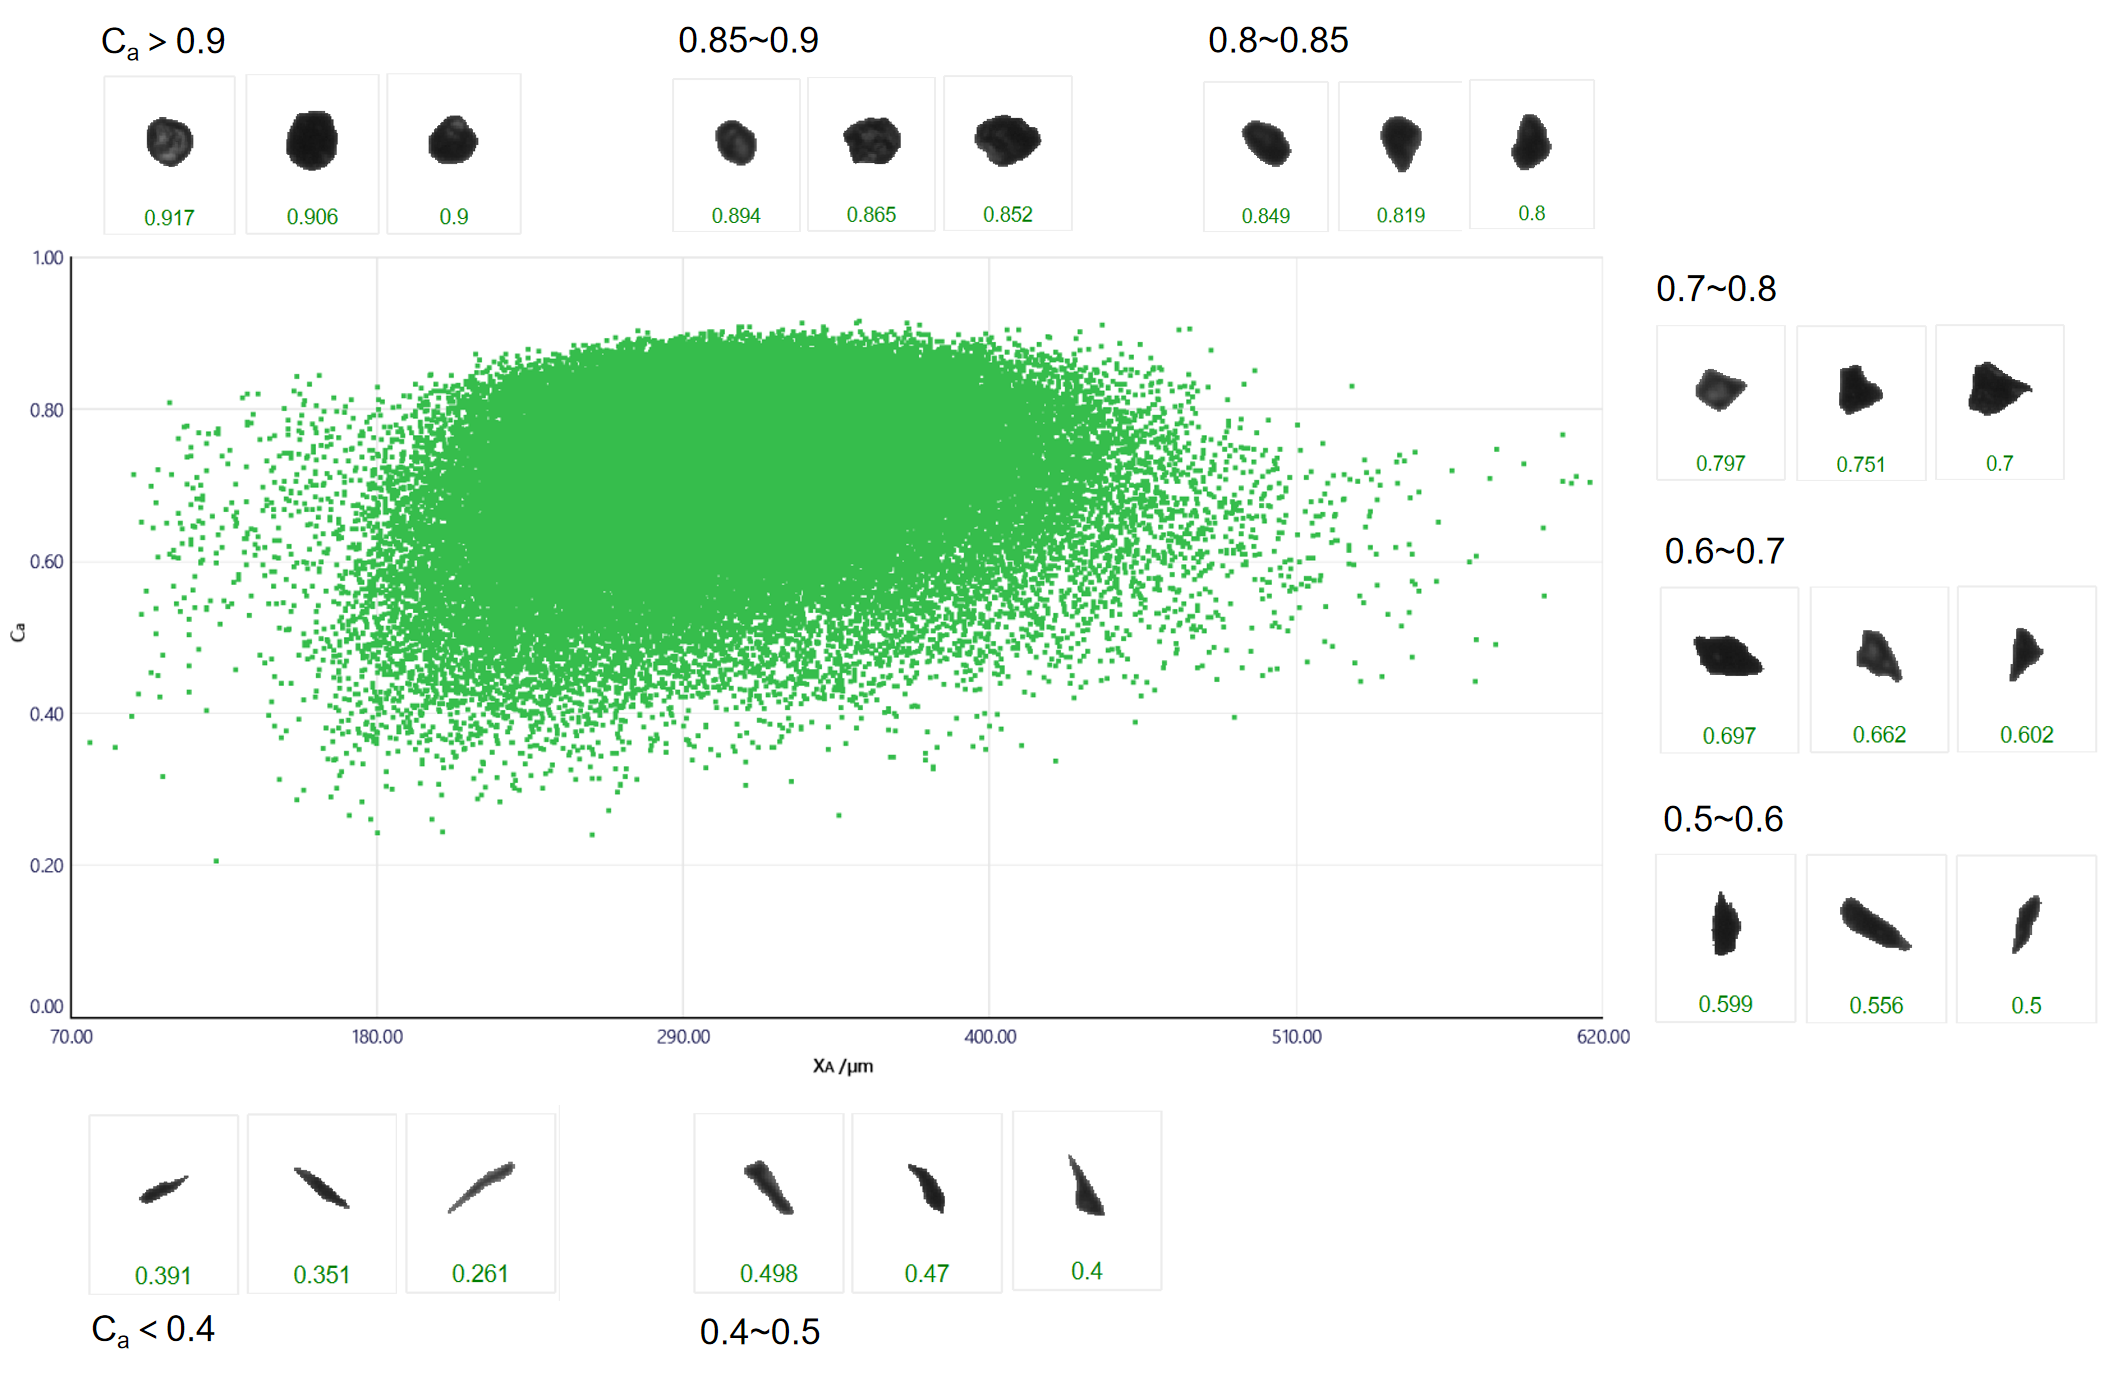
Figure 8. Particle Size vs. Circularity (Ca) scatter plot of brown fused alumina 3
Table 7. Volume-weighted proportion of particles by Circularity
|
Circularity range |
Volume-weighted proportion |
|
Ca > 0.9 |
0.08% |
|
0.9~0.85 |
7.28% |
|
0.85~0.8 |
24.27% |
|
0.8~0.7 |
46.92% |
|
0.7~0.6 |
16.95% |
|
0.6~0.5 |
3.86% |
|
0.5~0.4 |
0.59% |
|
Ca < 0.4 |
0.04% |
Comparison of the circularity distributions shows that brown fused alumina sample 1 exhibits the highest median circularity (Ca50=0.798) , followed by Brown Fused Alumina Sample 2 (Ca50=0.784) and Brown Fused Alumina Sample 3 (Ca50=0.767). This indicates that the coarser sample generally contains more rounded particles, whereas the finer sample contains a greater proportion of angular particles.
The repeatability of the six replicate measurements for all three samples is better than 0.5%, confirming the excellent stability and reproducibility of the BeVision D3 Pro in both particle imaging and dispersion performance.
Combining the particle size versus circularity scatter plot (Figure 8) with the volume-weighted circularity statistics (Table 7), it is evident that the majority of particles in Brown Fused Alumina Sample 3 exhibit circularity values between 0.70 and 0.85. Only 0.08 % of the particles have circularity values greater than 0.90, while highly elongated needle-like or flaky particles with circularity values below 0.40 represents only 0.04% of the total particle volume.
These results indicate that the sample is dominated by moderately angular particles that are well suited for general grinding and abrasive applications. The BeVision software automatically classifies particles according to circularity and calculates volume fractions for each shape category, and displays representative particle images to visualize particle shape characteristics. This capability enables manufacturers to identify abnormal shape distributions and proactively assess potential production risks, including excessive workpiece scratching or insufficient grinding wheel strength.
Conclusion
The BeVision D3 Pro dynamic image particle size and shape analyzer provides a comprehensive solution for abrasive quality control throughout the entire production process, supporting characterization of materials ranging from micron-scale fine powders to millimeter-scale coarse abrasive grains.
The BeVision D3 Pro simultaneously measures multiple particle characteristics in a single analysis, including both particle size and circularity distributions. Furthermore, two-dimensional particle size versus circularity scatter plots enable direct correlation of shape and size, providing valuable information for abrasive classification, process optimization, and grinding performance prediction.
The BeVision D3 Pro demonstrates exceptional measurement repeatability. For both ultrafine silicon carbide powders and coarse brown fused alumina grains, the repeatability particle size and circularity measurements remained below 0.5%. By analyzing more than 100,000 particles in a single measurement within approximately two minutes, the system delivers highly representative and statistically reliable results.
Overall, the BeVision D3 Pro combines high-throughput particle imaging, robust dispersion technology, and advanced shape analysis to provide accurate, repeatable, and comprehensive characterization of abrasive materials, making it a powerful tool for modern abrasive manufacturing and quality assurance.
About the Author
 |
Echo Cao Application Engineer @ Bettersize Instruments |
|
|
BeVision D3 Series
|
LOGIN TO ACCESS EXCLUSIVE CONTENT
More Resources Including
- Application Notes & Collections
- Webinars & Workshops
- Presentations & Videos
- Monthly Newsletters
- Exclusive Events...

Recommended articles
Rate this article