Home > Products > By Technology > Dynamic Light Scattering Testing
Technology

By Technology

  • ● Introduction
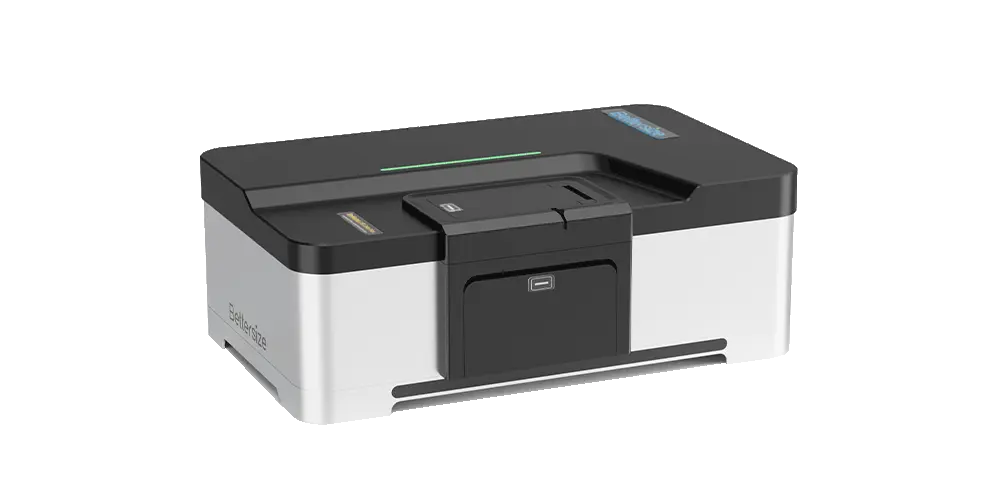
  • ● Nanoparticle Size and Zeta Potential Analyzer
  • ● Measurement Principles
  • ● Industry Solutions
  • ● Technical FAQs

1. Introduction


What is Dynamic Light Scattering (DLS)?

Dynamic Light Scattering (DLS), also known as Photon Correlation Spectroscopy (PCS) or Quasi-Elastic Light Scattering (QELS), is a non-destructive, highly sensitive characterization technique primarily used to measure the hydrodynamic diameter (DH), size distribution, and polydispersity index (PDI) of nanoparticles, biomacromolecules, and colloidal dispersions suspended in liquid media.

What Does It Measure?

  • Hydrodynamic Size and Distribution: Measures the velocity of Brownian motion driven by thermal collisions in liquid, converting scattered light fluctuations into the translational diffusion coefficient D, which is then used to resolve hydrodynamic diameters.

  • Polydispersity Index (PDI): Quantifies the degree of polydispersity within a dispersion to assess sample homogeneity.

  • Extended Multi-Parameter Attributes: On the BeNano optical platform, standard DLS sizing expands to cover Phase Analysis Light Scattering (PALS) zeta potential, Static Light Scattering (SLS) absolute molecular weight, DLS microrheological properties, transmittance, particle number concentration via light extinction DLS (LEDLS), and solvent refractive index.

What Samples Can Be Analyzed?

  • Biopharmaceuticals and Life Sciences: Monoclonal antibodies (mAbs), recombinant proteins, peptides, lipid nanoparticles (LNPs), liposomes, virus-like particles (VLPs), exosomes, and nucleic acid complexes.

  • Advanced Materials and Chemicals: Semiconductor CMP slurries, quantum dots, carbon nanotubes, graphene dispersions, fine ceramics, electronic pastes, high-performance coatings, and nano-emulsions.

  • Synthetic Polymers and Macromolecules: Copolymers, polymeric micelles, dendrimers, and thermo-responsive hydrogels.

What Core Challenges Does It Solve?

  • Trace Aggregation Monitoring: Because scattered light intensity in the Rayleigh regime is proportional to the sixth power of particle diameter, DLS sensitively captures early-stage aggregates present at mass fractions well below 1% long before visible turbidity develops.

  • Direct Measurement of Concentrated Formulations: Using intelligent backscattering optics, the system minimizes multiple scattering effects and supports direct testing of turbid samples at concentrations up to 40% w/v, avoiding dilution-induced de-emulsification or disassembly.

  • Formulation and Process Stability Screening: Integrated with precision temperature control (-15 ℃ to 120 ℃) and automated pH titration, the system quantitatively determines aggregation onset temperatures (Tagg) and isoelectric points (IEP) to support formulation optimization.

2. Measurement Principles

2.1 Brownian Motion Induces Scattered Light Fluctuations

Nanoparticles suspended in liquid undergo perpetual, random Brownian motion. Smaller particles diffuse rapidly, whereas larger particles move slowly. When illuminated by a monochromatic laser beam, the light scattered by the particles interferes coherently. Because particle positions continuously change over time, the scattered light intensity detected at a defined angle exhibits dynamic fluctuations.

2.2 Digital Correlator Resolves the Autocorrelation Function

An Avalanche Photodiode (APD) detector captures the photon pulses, and a high-speed digital correlator computes the autocorrelation function. For smaller particles with rapid motion, the correlation function decays quickly; for larger particles or aggregates with slower diffusion, the correlation function decays gradually.

2.3 Stokes-Einstein Equation Converts Diffusion to Particle Size

Using Cumulants analysis or multi-peak distribution algorithms (CONTIN/NNLS), the translational diffusion coefficient D is extracted from the correlation function. With known absolute temperature T, Boltzmann constant kB, and solvent viscosity η, the hydrodynamic diameter DH is calculated via the Stokes-Einstein equation.Stokes–Einstein equation

3. Industry Solutions

3.1 Biopharmaceuticals and Protein Analysis

  • Analytical Challenge: Monoclonal antibodies and recombinant protein formulations are vulnerable to self-association and aggregation during purification, ultrafiltration, pumping, and freeze-thaw cycles. Trace oligomers can compromise therapeutic potency and increase immunogenic risks.

  • BeNano Approach: Utilizes high-sensitivity APD optics and precise temperature programming to track monomer hydrodynamic size, PDI, and aggregation onset temperature (Tagg) in 3–5 μL ultra-micro quartz capillary cells.

  • Practical Benefits: Enables formulation stability screening at the earliest development stages, saving precious, high-cost candidate materials while delivering predictive thermal stability profiles.

3.2 Nucleic Acid Delivery Systems and Lipid Nanoparticles

  • Analytical Challenge: In vivo transfection efficiency and biodistribution of mRNA-LNPs depend on rigorous control over particle size and polydispersity. Inconsistent sizing or batch variability accelerates macrophage clearance and undermines therapeutic efficacy.

  • BeNano Approach: Utilizes Light Extinction DLS (LEDLS) to simultaneously determine mean hydrodynamic diameter, PDI, and absolute particle number concentration (particles/mL) across batches.

  • Practical Benefits: Accelerates formulation optimization and ensures seamless batch-to-batch consistency and regulatory release, supported by fully compliant audit trails and electronic signature workflows (FDA 21 CFR Part 11).

3.3 Semiconductor CMP Slurries

  • Analytical Challenge: CMP slurries including silica, ceria, or alumina require rigorous sizing control. Trace large particle counts (LPCs) in the micron range induce micro-scratches on wafer surfaces, directly lowering die yield.

  • BeNano Approach: Employs 173° backscattering optics to characterize undiluted slurries at concentrations up to 40% w/v, avoiding dilution-induced agglomeration artifacts, while a 0° photodiode monitors gravitational sedimentation of 1 to 50 micron coarse particles.

  • Practical Benefits: Enables simultaneous tracking of primary nanoparticles and destructive coarse-tail outliers in a single platform, safeguarding wafer polish quality and optimizing chemical slurry production.

3.4 Colloids, Conductive Slurries, and High-Performance Inks

  • Analytical Challenge: Carbon nanotube dispersions, graphene slurries, and conductive inks readily aggregate and settle when electrostatic or steric repulsion falls short, causing print-head nozzle clogging and defective film deposition.

  • BeNano Approach: Uses Phase Analysis Light Scattering (PALS) to resolve ultra-low electrophoretic mobilities in high-salt or organic systems, combined with the BAT-1 autotitrator to automate pH-dependent surface charge titrations from pH 1 to 13 and map isoelectric points (IEP).

  • Practical Benefits: Streamlines surfactant and dispersant dosage selection, substantially shortening shelf-life testing cycles and preventing costly line stoppages during downstream jetting or coating operations.

3.5 Synthetic Polymers and Front-End Separation Coupling (Flow Mode)

  • Analytical Challenge: Broadly polydisperse polymers and conjugates challenge standard batch-mode DLS, where dominant scattering from larger fractions masks smaller populations and obscures true component distributions.

  • BeNano Approach: Integrates the BeNano as an in-line light scattering detector downstream of GPC/SEC or AF4 systems via the BFC-1 signal collector, profiling fractionated eluates through a 27 μL low-volume flow cell using DLS.

  • Practical Benefits: Resolves closely eluting species with a size ratio as low as 1.3:1, delivering true oligomer distributions.

3.6 Specifications Table

The BeNano integrates particle sizing, zeta potential, molecular weight, and extended optical measurements into a single platform:

  Parameter Specification (BeNano 180 Zeta Max)
Particle Size Measurement Principle and Angles Dynamic Light Scattering (DLS); detection angles at 173° (backscattering), 90° (side scattering), and 12° (forward scattering)
Sizing Range 0.3 nm to 15 μm (sample dependent)
Upper Concentration Limit Up to 40% w/v (sample dependent)
Minimum Sample Volume 3 μL (using capillary sizing cell)
Zeta Potential Measurement Principle Electrophoretic Light Scattering (ELS) with Phase Analysis Light Scattering (PALS)
Electrophoretic Mobility Range > ± 20 μm·cm/V·s
Sample Conductivity Limit 0 to 270 mS/cm or higher
Upper Particle Size Limit 1 nm to 120 μm or higher
Extended Optical Measurements Absolute Molecular Weight (SLS) 342 Da to 20,000,000 Da (Debye plot fitting for Mw and second virial coefficient A2)
Particle Concentration (LEDLS) 10^8 to 10^12 particles/mL
Refractive Index (RI) Range 1.2 to 1.6; accuracy better than 0.1% (patented quartz wedge cell)
Sedimentation Sizing 1 μm to 50 μm (measures transmission changes over time via a 0-degree detector)
DLS Microrheology Mean Squared Displacement (MSD), storage modulus G', loss modulus G'', complex viscosity, creep compliance
System Laser Source 50 mW solid-state laser, 671 nm (Class 1)
Optical Detectors Avalanche Photodiode (APD), 0-degree photodiode, and CMOS camera module
Temperature Control Range -15 ℃ to 120 ℃ (accuracy ± 0.1 ℃; dry gas purge port included)
Accessories Optional BFC-1 signal collector for GPC/SEC flow mode; optional BAT-1 autotitrator
Compliance FDA 21 CFR Part 11, ISO 13321, ISO 22412, ISO 13099

Technical FAQs

Question 1: What is the fundamental difference between Dynamic Light Scattering (DLS) and Laser Diffraction, and how should a lab choose between them?


Dynamic Light Scattering measures the intensity fluctuations of scattered light caused by the Brownian motion of particles in liquid, specializing in the sub-micron and nanoscale range (0.3 nm to 15 microns). It is very sensitive to trace aggregates. Laser Diffraction measures the static spatial angular distribution of scattered light, covering a broad range from sub-micron to millimeters, making it suitable for dry powders, emulsions, and bulk industrial slurries. For nano-scale formulations, protein stability, or zeta potential analysis, DLS is the appropriate choice.


Question 2: Why is 173-degree backscattering advantageous over traditional 90-degree side scattering?


In traditional 90-degree optics, the incident laser beam must pass through the center of the cuvette. For turbid or concentrated samples, light scattered by one particle is rescattered by adjacent particles before exiting ("multiple scattering"), distorting the correlation decay and producing inaccurate sizes. The 173-degree backscattering configuration uses a motorized lens to position the measurement point against the cuvette's inner wall. This shortens the path length through the liquid, suppressing multiple scattering and reducing interference from dust, allowing direct testing at concentrations up to 40% w/v.


Question 3: Why does hydrodynamic size from DLS differ from the size measured by TEM or SEM?


Transmission or scanning electron microscopy (TEM/SEM) measures the projected geometric core dimensions of dried particles in an ultra-high vacuum environment. DLS measures particles solvated in liquid, determining the rate of diffusion. The resulting hydrodynamic diameter encompasses the core particle plus its surrounding electrical double layer (EDL), hydration shell, and any attached surface polymers or capping ligands. Consequently, DLS hydrodynamic sizes are routinely larger than dry-state electron microscopy sizes.


Question 4: What distinct benefits does Phase Analysis Light Scattering (PALS) provide over conventional Doppler Electrophoretic Light Scattering (ELS)?


Conventional ELS calculates mobility from frequency shifts in scattered light. When particles have low surface charges, when samples are dispersed in low-dielectric organic media, or when ionic strength is high (such as physiological saline), electrophoretic velocities are minimal and easily obscured by noise. PALS extracts mobility by integrating the phase shift over time rather than detecting frequency changes. This improves measurement sensitivity, allowing reliable zeta potential characterization in high salinity buffers and near the isoelectric point.


Question 5: Under what circumstances should Flow Mode DLS replace standard Batch Mode DLS?


Batch mode DLS takes 1 to 2 minutes per measurement and is suitable for monodisperse or moderately polydisperse samples. However, because light scattering intensity in the Rayleigh regime scales with particle diameter to the sixth power (I ∝ d^6), larger species can mask smaller particles in complex mixtures. By coupling the BeNano to a GPC/SEC or AF4 system via the BFC-1 collector, components are separated by hydrodynamic volume prior to entering the BeNano flow cell. The detector measures each fraction sequentially, delivering 1.3:1 size resolution alongside accurate volume-weighted distributions.


Question 6: Can turbid or concentrated samples be analyzed directly without dilution?


In many cases, yes. The BeNano automatically positions the focal point adjacent to the cuvette wall for high-concentration or strongly scattering dispersions. This limits the optical path length, suppressing multiple scattering artifacts and enabling direct analysis at concentrations up to 40% w/v. Direct measurement eliminates dilution steps that might otherwise disrupt chemical equilibria, dismantle self-assembled micelles, or induce aggregation.


Question 7: How does the BeNano calculate particle number concentration (particles/mL) using LEDLS?


The system pairs 0-degree light extinction detection with DLS sizing. When the laser traverses the sample, the 0-degree photodiode measures optical attenuation relative to a solvent blank. By combining transmission loss with the hydrodynamic size distribution obtained from DLS, the software applies extinction and scattering models to calculate the volume fraction and absolute particle number concentration (from 10^8 to 10^12 particles/mL) for individual peaks without requiring external calibration standards, provided the particle's optical properties (refractive index and absorption) are defined.


Question 8: What capabilities are enabled by the auxiliary 0-degree optical detector module?


The 0-degree transmission module integrates a photodiode and a dedicated CMOS camera to provide three functions:

  1. Refractive Index (RI) Measurement: Uses a quartz wedge cell where beam deflection captured by the CMOS sensor calculates liquid refractive index between 1.2 and 1.6 to an accuracy better than ± 0.1%, eliminating the need for an external refractometer.

  2. Concentration Determination (LEDLS): Measures transmitted intensity to derive light extinction and particle number concentration.

  3. Gravitational Sedimentation Sizing: Monitors transmission changes over time as larger particles settle, extending sizing capabilities from 1 to 50 μm.


Question 9: What specialized sample cells are supported for ultra-low volume or high-value materials?


The instrument accommodates a wide selection of cuvettes. For scarce biologics, nucleic acids, or exosomes, a quartz capillary sizing cell requires only 3 μL of sample. Additional cells include 16 μL micro-volume polarized cells, 25 μL micro-quartz cuvettes, dip cells for organic solvents, and disposable folded capillary cells for zeta potential testing.


Question 10: How does the operating software comply with FDA 21 CFR Part 11 requirements?


The BeNano software includes a security architecture designed for regulated pharmaceutical environments. It provides multi-level role-based access control, automated audit trails recording system operations, and electronic signature workflows. The BeNano also provides standardized Installation Qualification and Operational Qualification (IQ/OQ) protocols to support GMP and GLP compliance validation as needed.