
Particle Size and Shape Analysis of Rod-Shaped Catalysts Using the BeVision D3 Macro
2026-09-23Application Note
Rod-shaped and cylindrical catalysts are widely used in fixed-bed catalytic processes, including selective catalytic reduction (SCR) for flue gas denitrification, petroleum hydrotreating, fine chemical synthesis and industrial waste gas treatment. The shape of catalyst particles plays a critical role in determining catalytic performance, bed packing characteristics, pressure drop, mechanical durability, and overall service life.
Key shape parameters, including particle length, diameter, length-to-width (L/W) ratio and straightness, directly influence catalyst activity, mass transfer efficiency, and reactor operating stability. Variations in these properties can lead to non-uniform bed voidage, channeling effects, uneven pressure distribution and premature catalyst failure.
Conventional measurement methods, such as manual caliper measurements and optical microscopy, suffer from low throughput and poor sampling representativeness, as only a limited number of particles can be evaluated. In addition, measurement results are often influenced by operator judgment, leading to reduced reproducibility.
Dynamic image analysis overcomes these limitations through automated high-speed imaging and advanced particle analysis algorithms. By measuring thousands of particles in a single test, the technique provides statistically representative and objective shape characterization for rod-shaped catalysts.
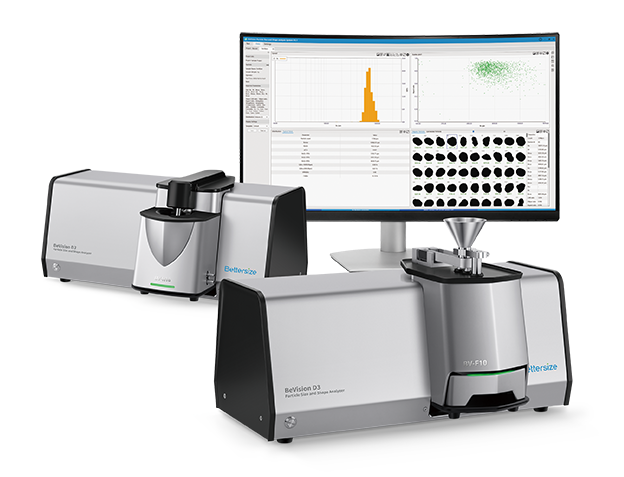
The BeVision D3 Macro dynamic image particle size and shape analyzer equipped with the BV-F10 Free Fall dispersion unit, is specifically designed for the characterization of large granular materials. The gentle dispersion process preserves the original shape of catalyst particles while enabling simultaneous measurement of multiple shape parameters including length, diameter, L/W ratio and straightness. Combining high throughput, excellent repeatability and comprehensive particle characterization, the system provides an efficient solution for catalyst research process optimization and quality control.
Measurement Method
A BeVision D3 Macro dynamic image particle size and shape analyzer equipped with a BV-F10 Free Fall dispersion unit was used to simultaneously characterize the particle length, diameter, length-to-width ratio (L/W ratio) and straightness of two rod-shaped catalyst samples.
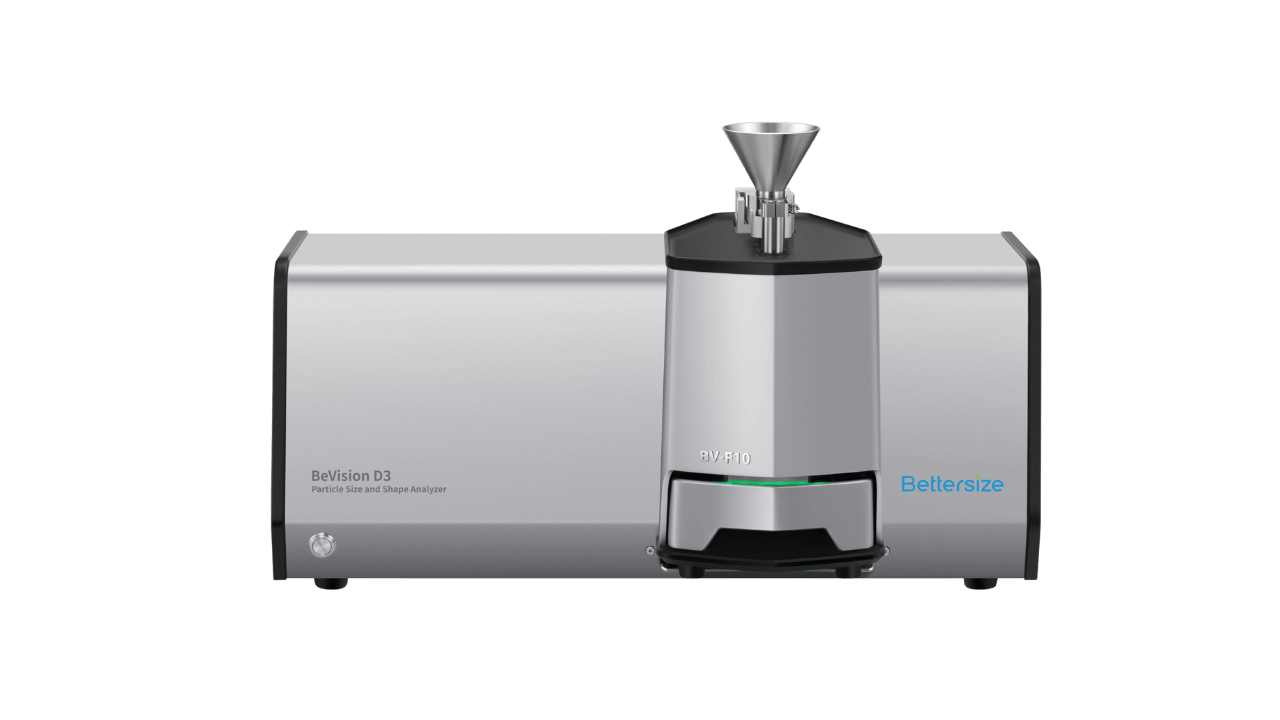
Table 1. Measurement conditions
| Dispersion method | Free fall dry dispersion |
| Imaging | 5-megapixel CMOS |
| Feeding control | Automatic |
| Number of particles analyzed | 30,000 pcs |
| Measurement time | 4 minutes |
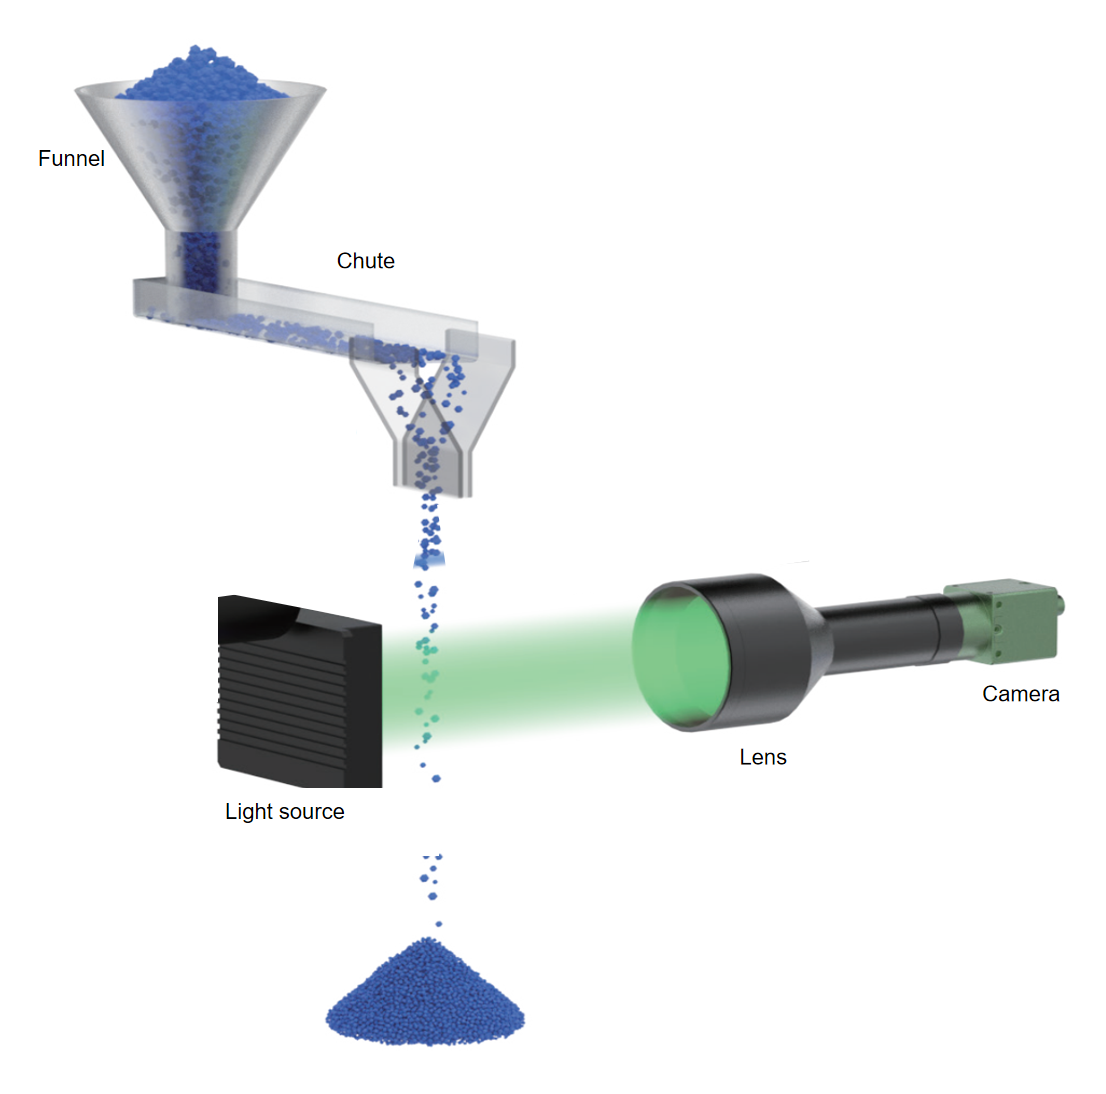
Figure 1. BeVision D3 Macro and BV-F10 free fall dispersion unit for DIA of rod-shaped catalysts
Results and Discussion
The Maximum Feret Diameter (XFmax) was used to characterize catalyst length. The Feret diameter is defined as the distance between two parallel tangent lines touching opposite sides of a particle’s projected contour. The largest Feret diameter measured for particles is referred to as the Maximum Feret diameter XFmax.
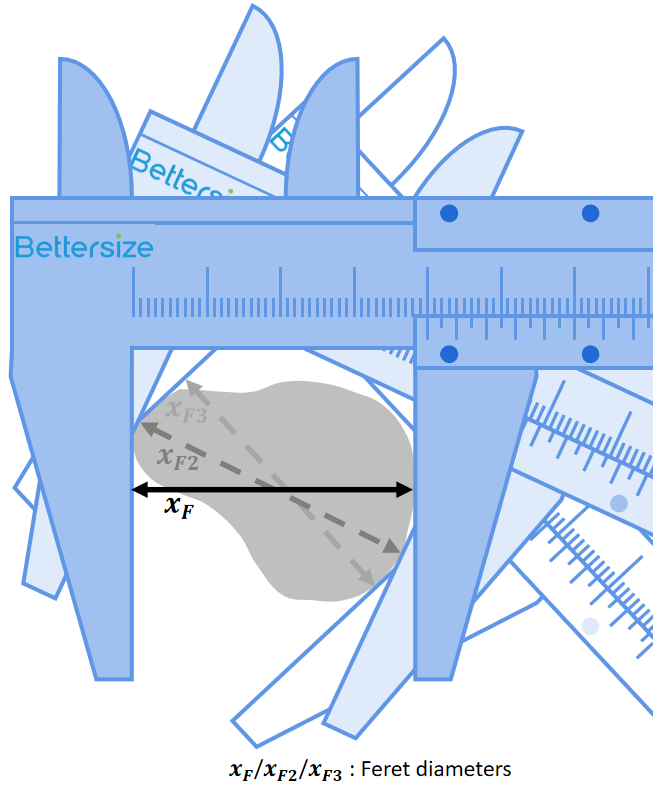
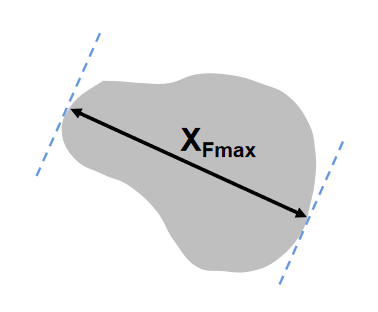
Figure 2. Definition of maximum feret diameter, XFmax
The Minimum Martin Diameter, XMmin, was used to characterize the diameter of rod-shaped catalyst. The Martin diameter is defined as the chord length that bisects a particle’s projected area. The shortest Martin diameter of a particle is referred to as the Minimum Martin Diameter, XMmin.
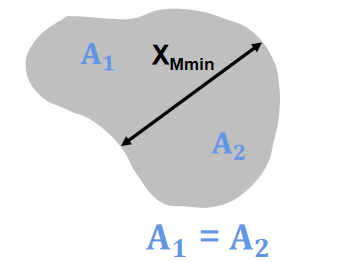
Figure 3. Definition of Minimum Martin Diameter XMmin
Length-to-Width Ratio (L/W Ratio) is calculated as the ratio of the length to the width of the particle’s minimum bounding rectangle.
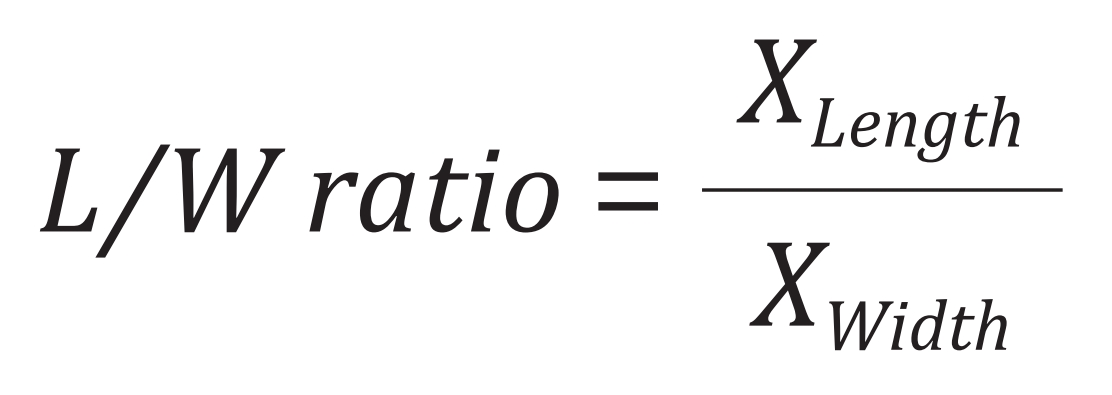
Figure 4. Definition of Length-to-Width ratio (L/W ratio).
Straightness is defined as the ratio of Maximum Feret Diameter to geodesic length and the calculation is shown below, where XFmax is the Maximum Feret Diameter, and XLG is the geodesic length of the particle projection. Straightness is used to quantify the degree of particle bending and ranges from 0 to 1. Values approaching 1 indicate perfectly straight particles, whereas lower values indicate increasing levels of curvature or bending.
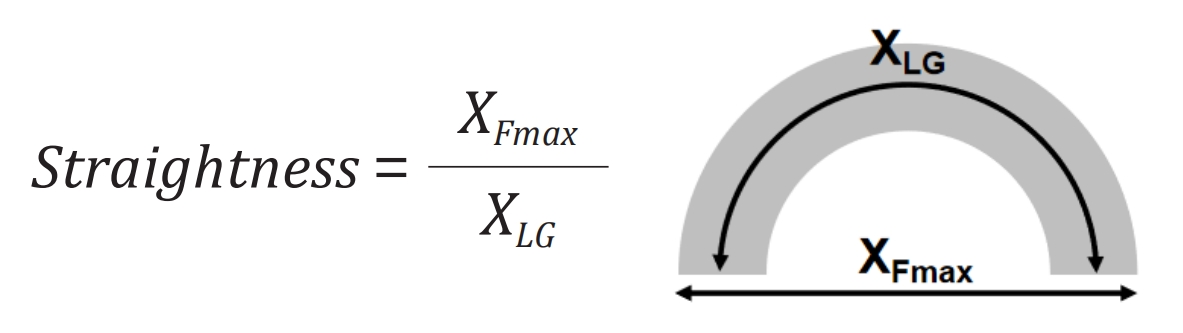
Figure 5. Definition of Straightness
Length Analysis
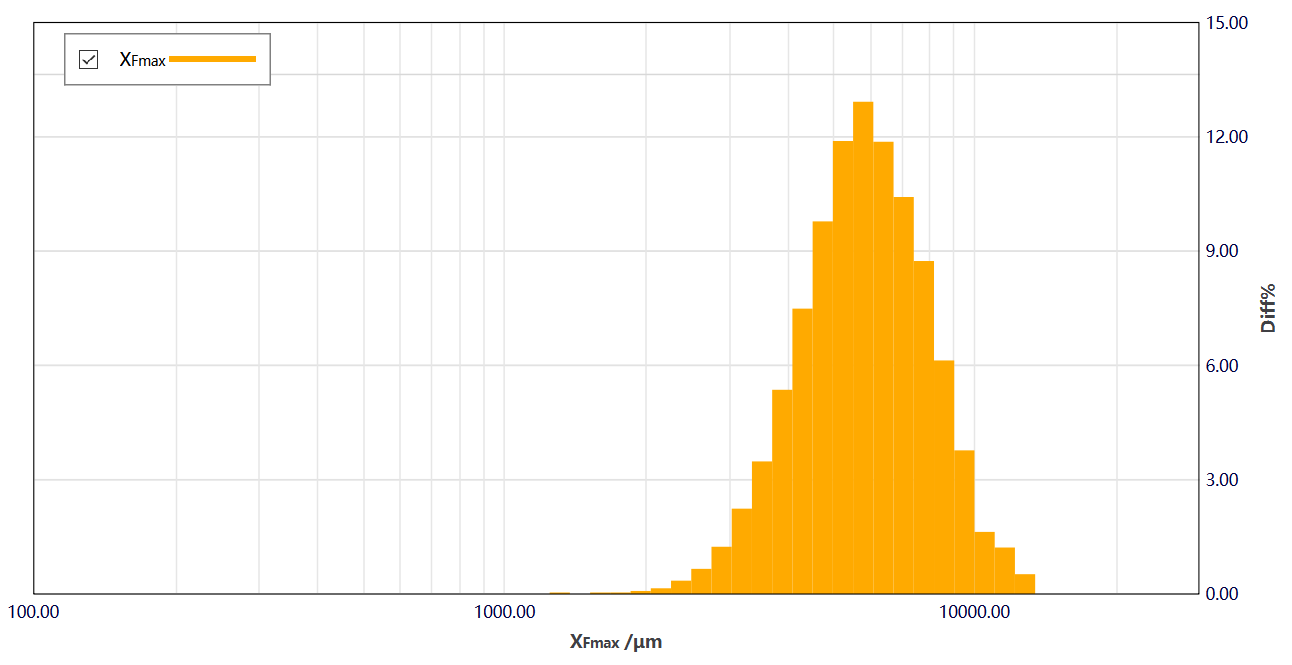
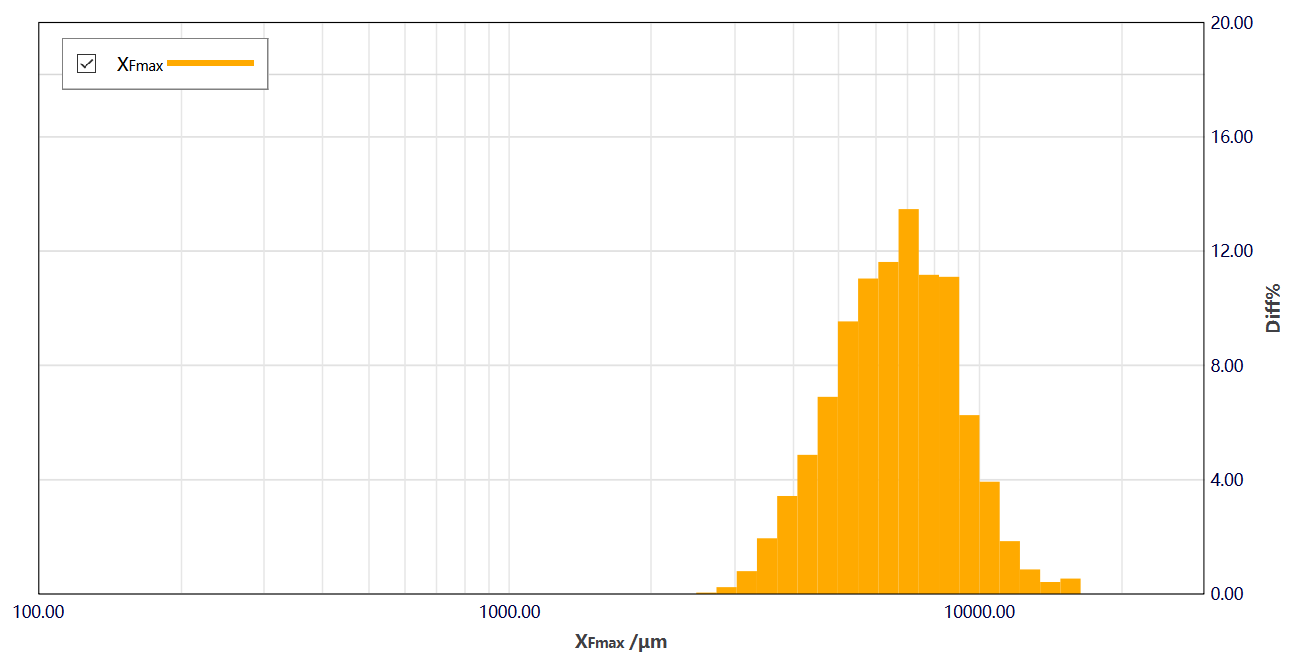
Figure 6. Length (XFmax) distribution curves of catalyst samples (top: catalyst 1; bottom: catalyst 2)
Table 2. Comparison of catalyst length
| Sample | XFmax 10 | XFmax 50 | XFmax 90 | Span |
|---|---|---|---|---|
| Catalyst 1 | 3903.81 μm | 5901.59 μm | 8666.45 μm | 0.81 |
| Catalyst 2 | 4448.47 μm | 6718.47 μm | 9680.25 μm | 0.78 |
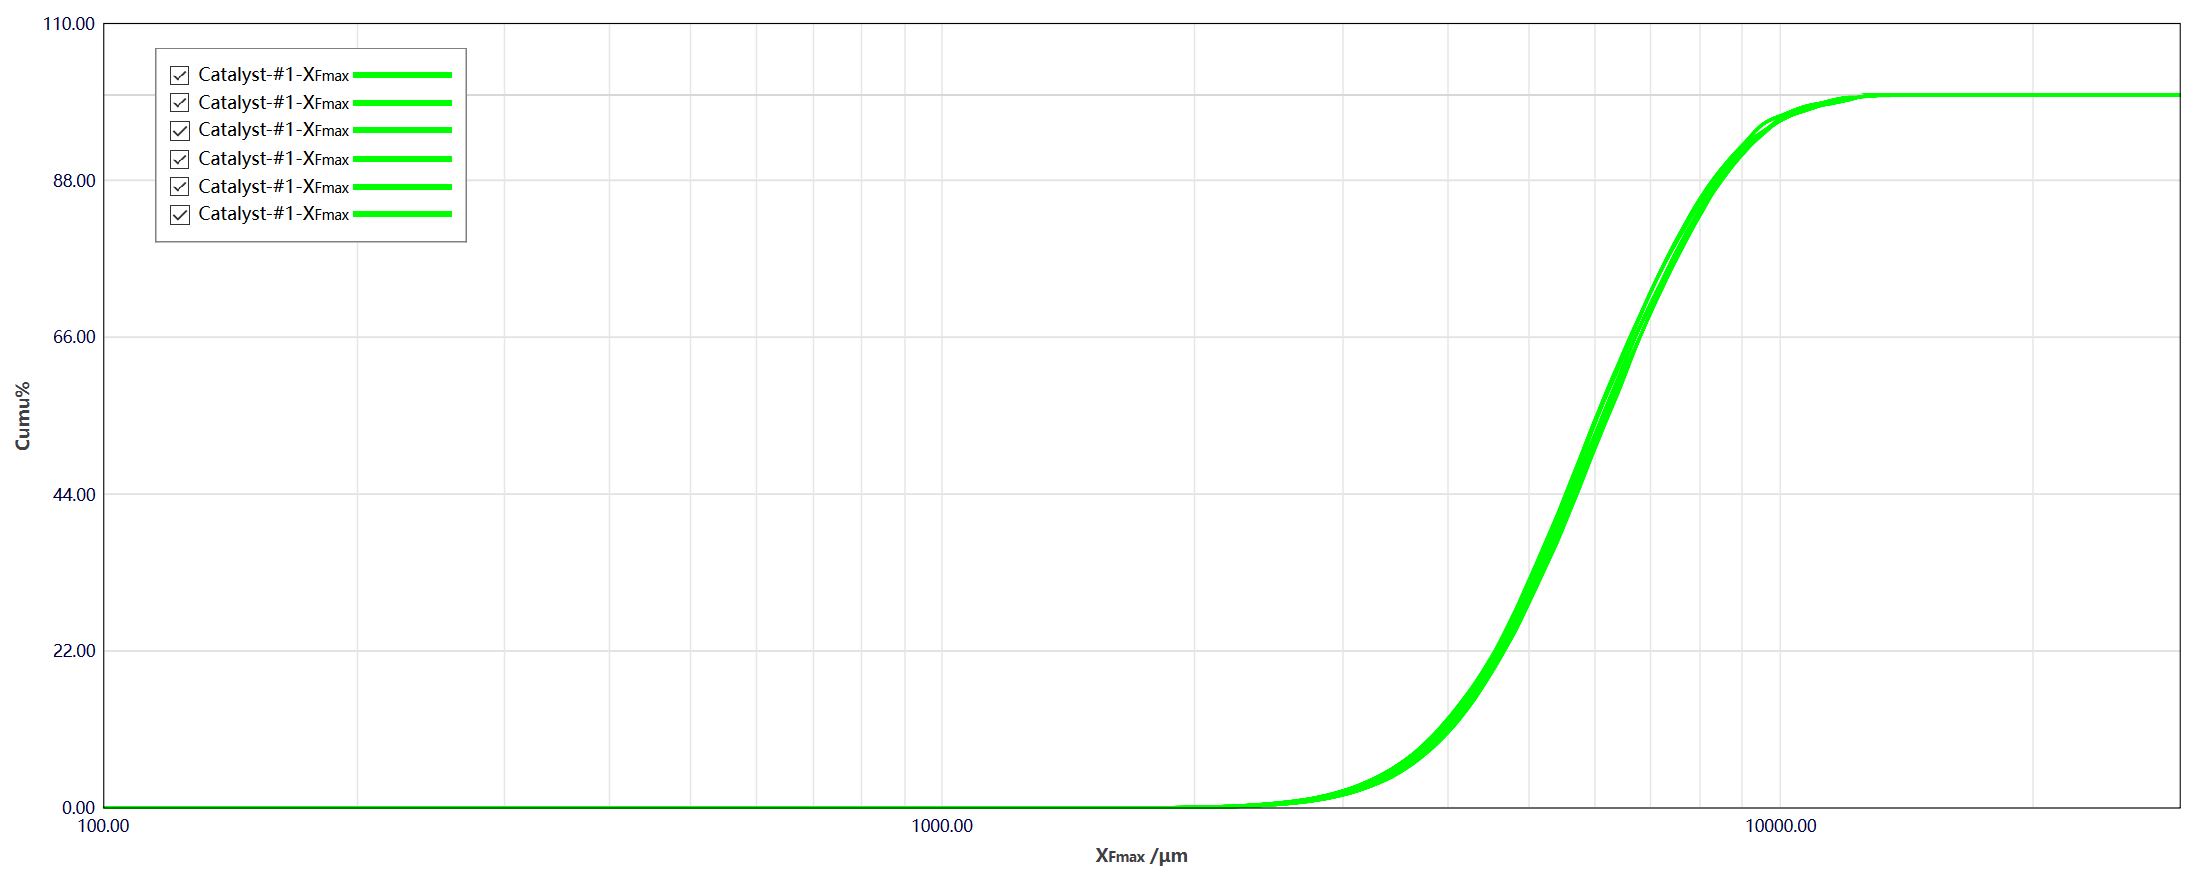
Figure 7. Cumulative length distribution curves from six replicate measurements of catalyst 1
The length distribution results indicate that both samples are millimeter-scale extruded catalysts. Catalyst 1 exhibits a median length XFmax 50 of 5901.59 μm with a span of 0.81, while Catalyst 2 displays a larger XFmax 50 of 6718.47 μm and a span of 0.78.
The length spans of both samples are below 1, demonstrating excellent particle length uniformity and stable cutting processes during manufacturing. Uniform particle length helps maintain consistent bed voidage after reactor loading, minimizing channeling effects and uneven pressure drop caused by mixtures of excessively long and short catalyst particles.
The strong overlap of the cumulative distribution curves demonstrates excellent measurement repeatability. In contrast to manual caliper measurement, which is limited by small sample sizes and low throughput, the BeVision D3 Macro can automatically analyze 30,000 particles in a single measurement within four minutes.
The BV-F10 Free Fall dispersion unit delivers a steady particle stream while minimizing collisions and particle breakage thereby preserving the original catalyst shape and ensuring accurate length measurements.
Diameter Analysis
Both catalyst samples exhibit exceptionally narrow diameter distributions. Catalyst 1 has a median diameter XMmin 50 of 1303.90 μm with a span of only 0.09, while Catalyst 2 has a median diameter of 2663.49 μm and a span of 0.11. The narrow diameter distributions indicate consistent extrusion performance, minimal die wear, and homogeneous catalyst slurry properties. Uniform diameter is essential for maintaining consist external surface area and ensuring accurate calculation of shape-related parameters such as L/W ratio. Significant variations in diameter can lead to uneven distribution of active sites and potentially distort the interpretation of catalyst shape during process optimization.
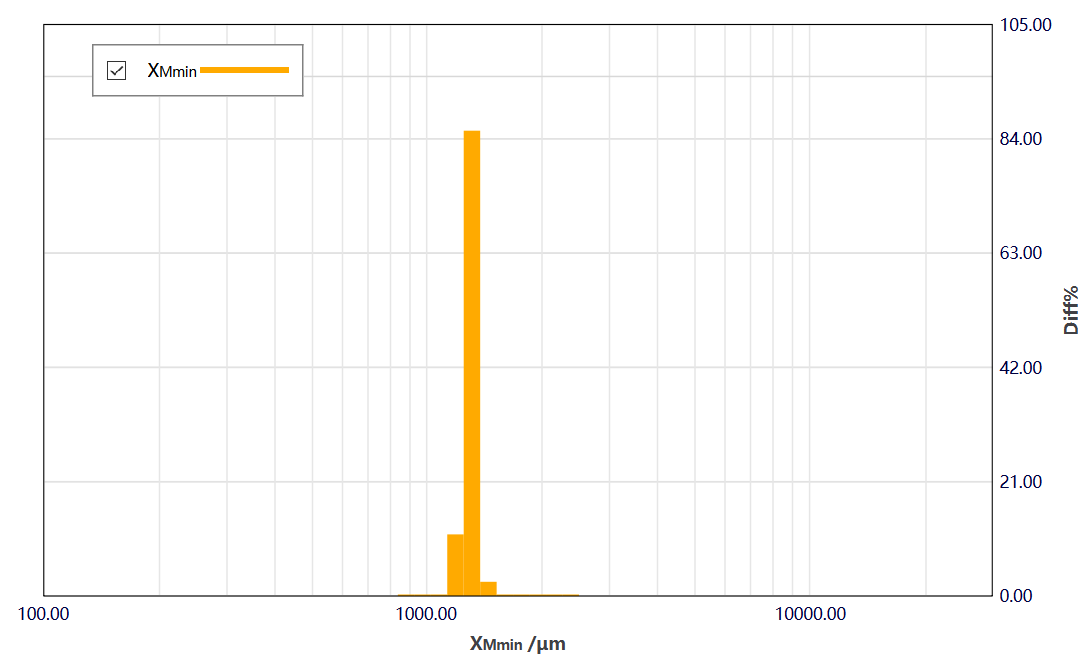
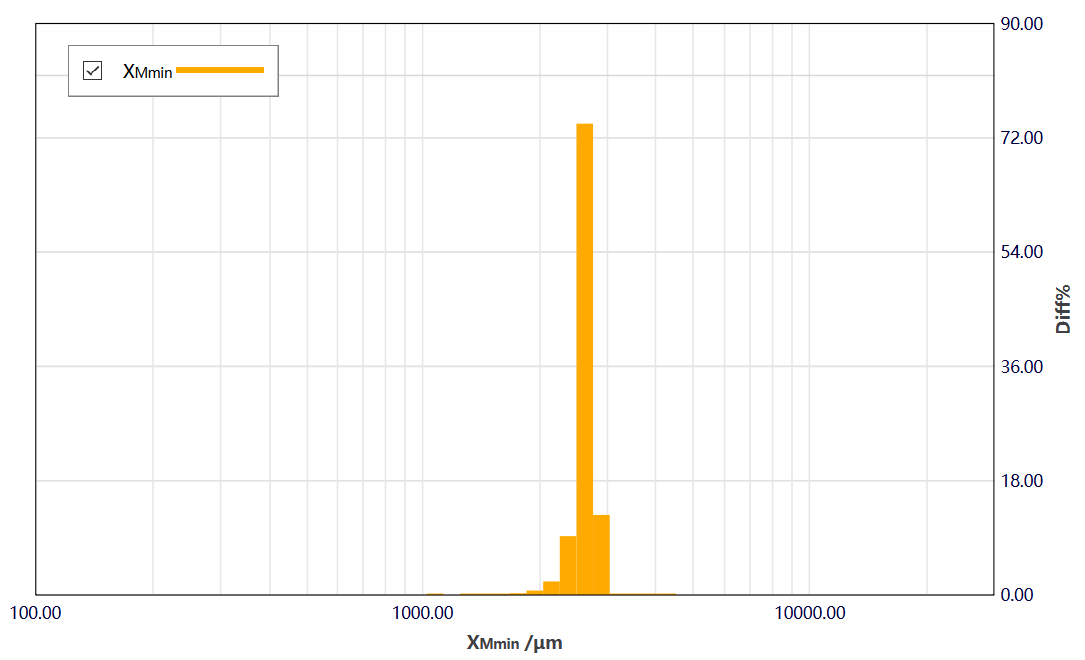
Figure 8 Diameter distributions of catalyst samples (top: catalyst 1; bottom: catalyst 2)
Table 3 Comparison of catalyst diameter
| Sample | XMmin 10 | XMmin 50 | XMmin 90 | Span |
|---|---|---|---|---|
| Catalyst 1 | 1240.95 μm | 1303.90 μm | 1356.11 μm | 0.09 |
| Catalyst 2 | 2469.12 μm | 2663.49 μm | 2769.69 μm | 0.11 |
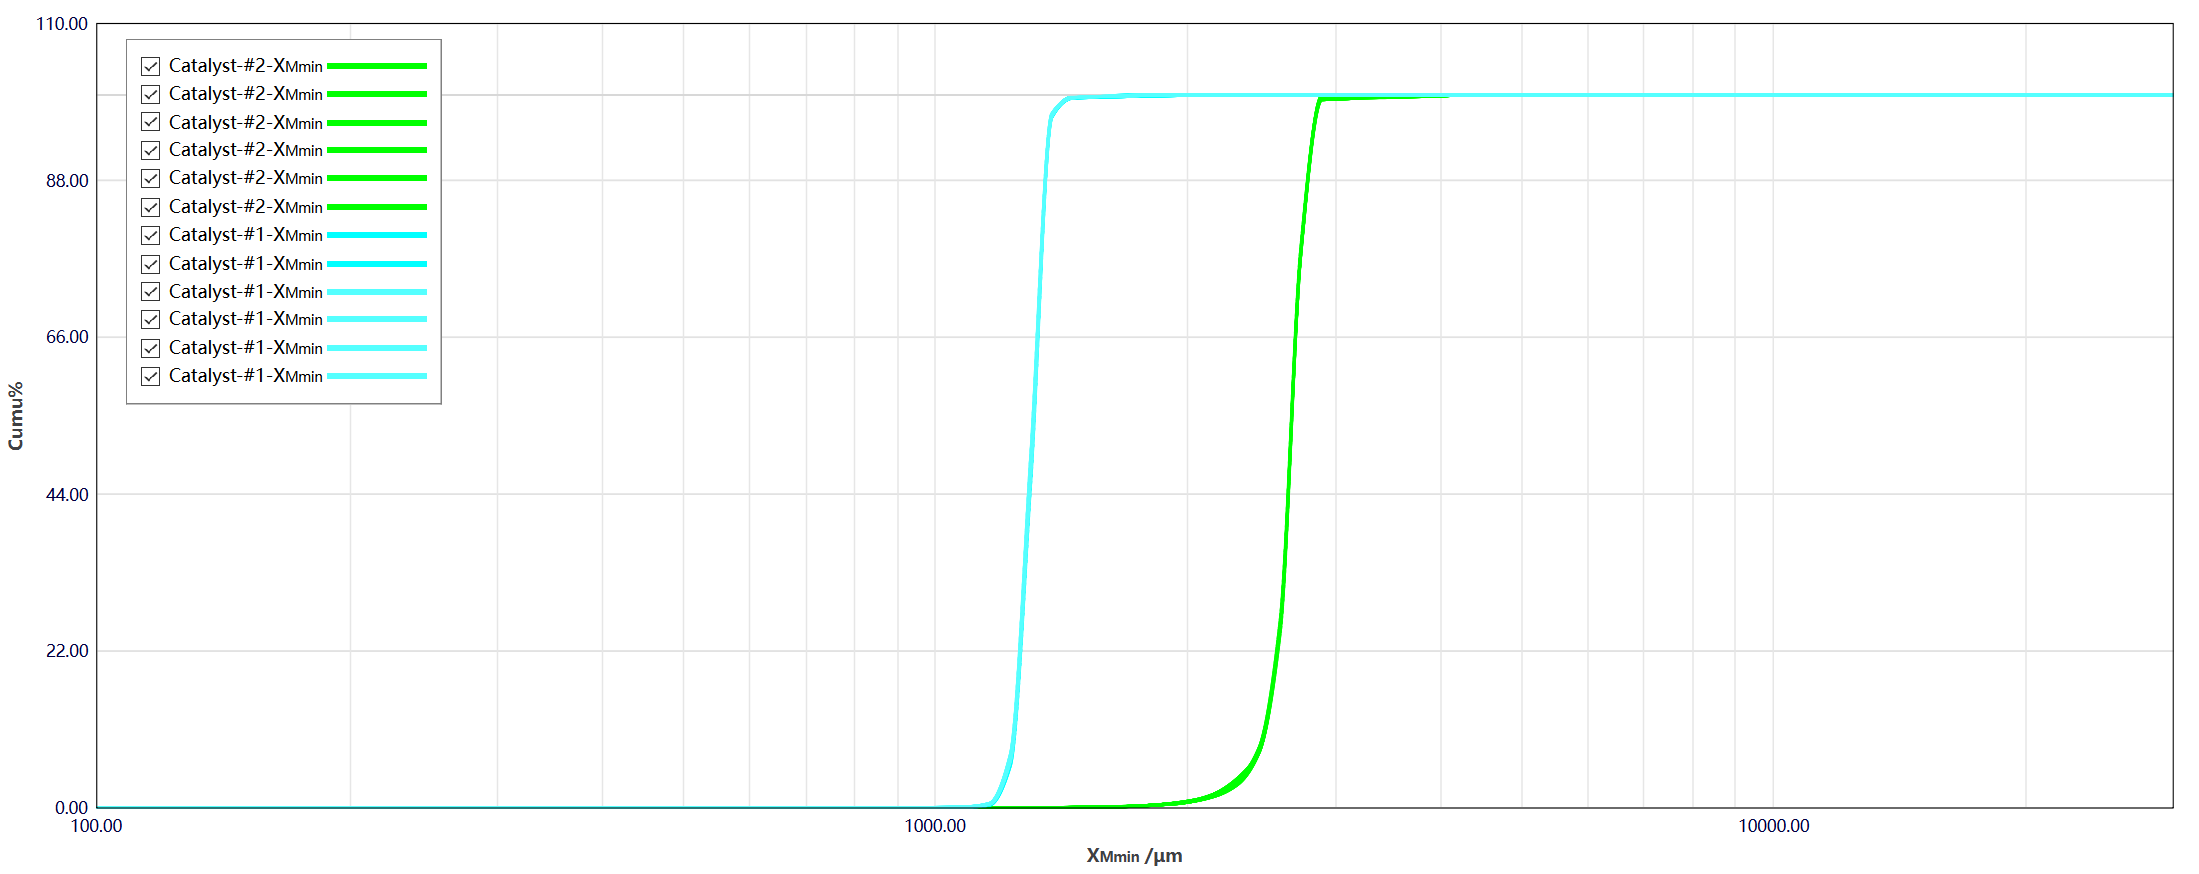
Figure 9. Cumulative diameter distribution curves of six replicate tests for catalyst 1 & catalyst 2
The highly overlapping cumulative distribution curves verify stable dispersion, imaging and analysis performance, resulting in highly repeatable results.
Unlike traditional sieving methods, which only provide coarse size classification, dynamic image analysis delivers continuous diameter distribution data while simultaneously identifying particles with abnormal dimensions, offering quantitative evidence for extrusion process monitoring and die maintenance.
Length-to-Width Ratio Analysis
The Length-to-Width Ratio (L/W ratio) is one of the most important quality control parameters for rod-shaped catalysts. It directly reflects particle slenderness and influences external surface area, mass transfer efficiency, pressure drop, and mechanical strength.
The L/W ratio results show significant shape differences between the two samples. Catalyst 1 has a median L/W ratio of 3.975 and a span of 0.75, featuring relatively slender particles. This shape is advantageous for reactions requiring high mass transfer efficiency and high catalytic selectivity. Catalyst 2 has a lower median L/W ratio of 2.707 and a span of 1.18, consisting of shorter, thicker particles. These particles generally provide superior mechanical strength and resistance to breakage, making them suitable for high-pressure operating conditions and applications involving elevated bed loads.
The BeVision D3 Macro automatically calculates particle fraction within any user-defined L/W ratio range, eliminating the need for manual particle-by-particle evaluation. This capability provides objective and standardized shape analysis for both catalyst development and production quality control.
Table 4. Representative L/W ratio values of catalyst particles
Table 5. Comparison of L/W ratio data
| Sample | L/W ratio 10 | L/W ratio 50 | L/W ratio 90 | Span |
|---|---|---|---|---|
| Catalyst 1 | 2.710 | 3.975 | 5.705 | 0.75 |
| Catalyst 2 | 1.712 | 2.707 | 4.902 | 1.18 |
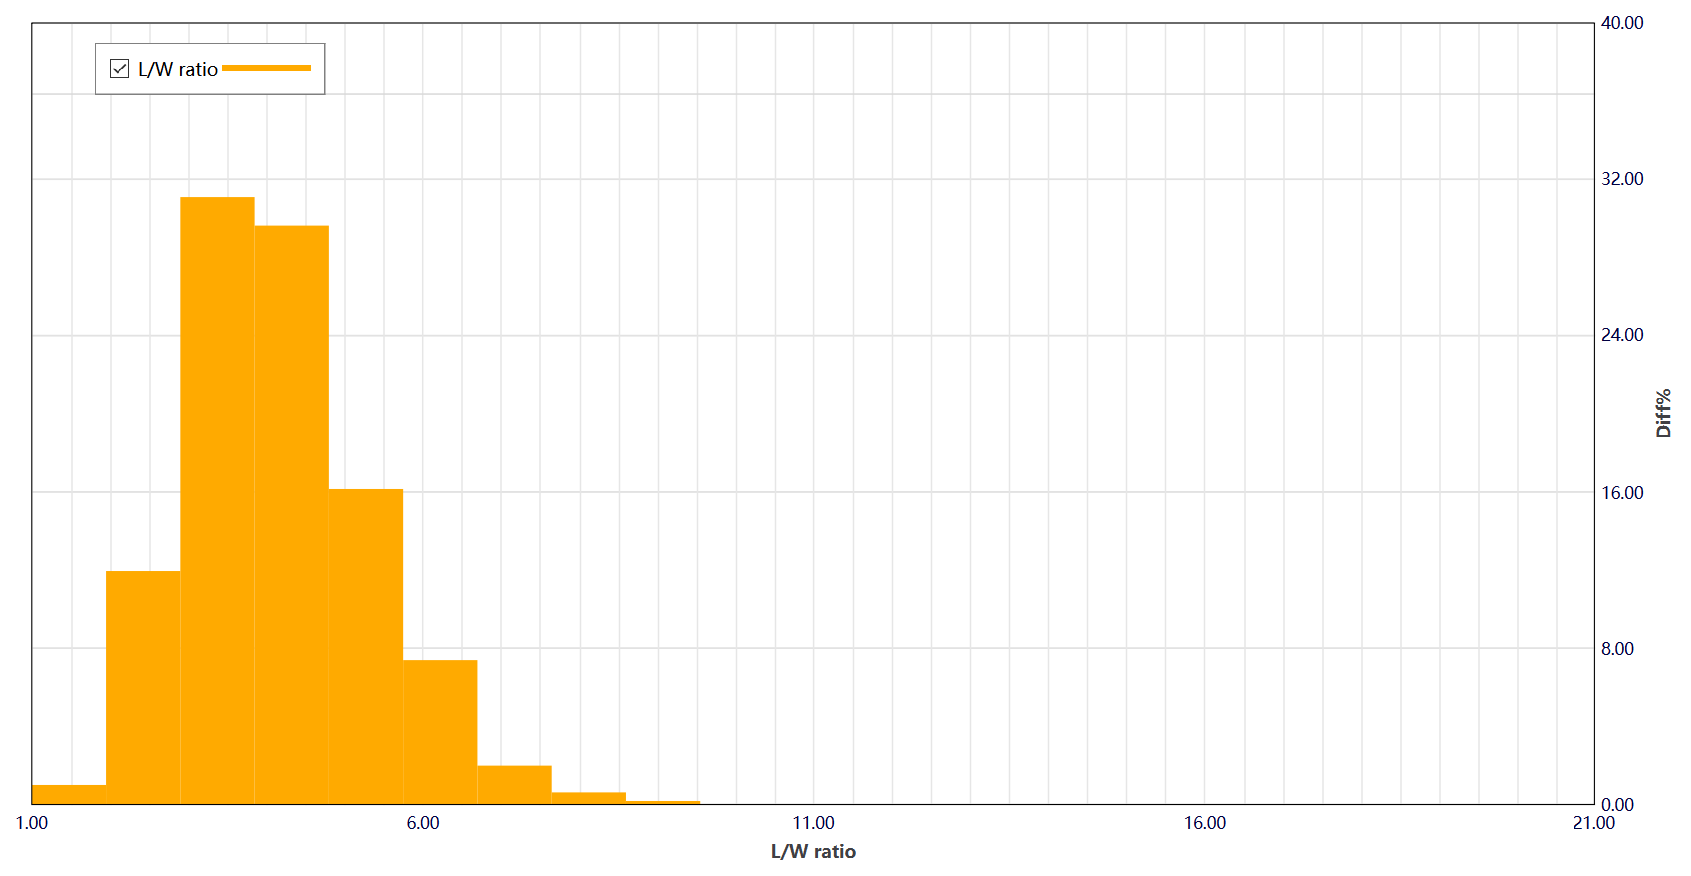
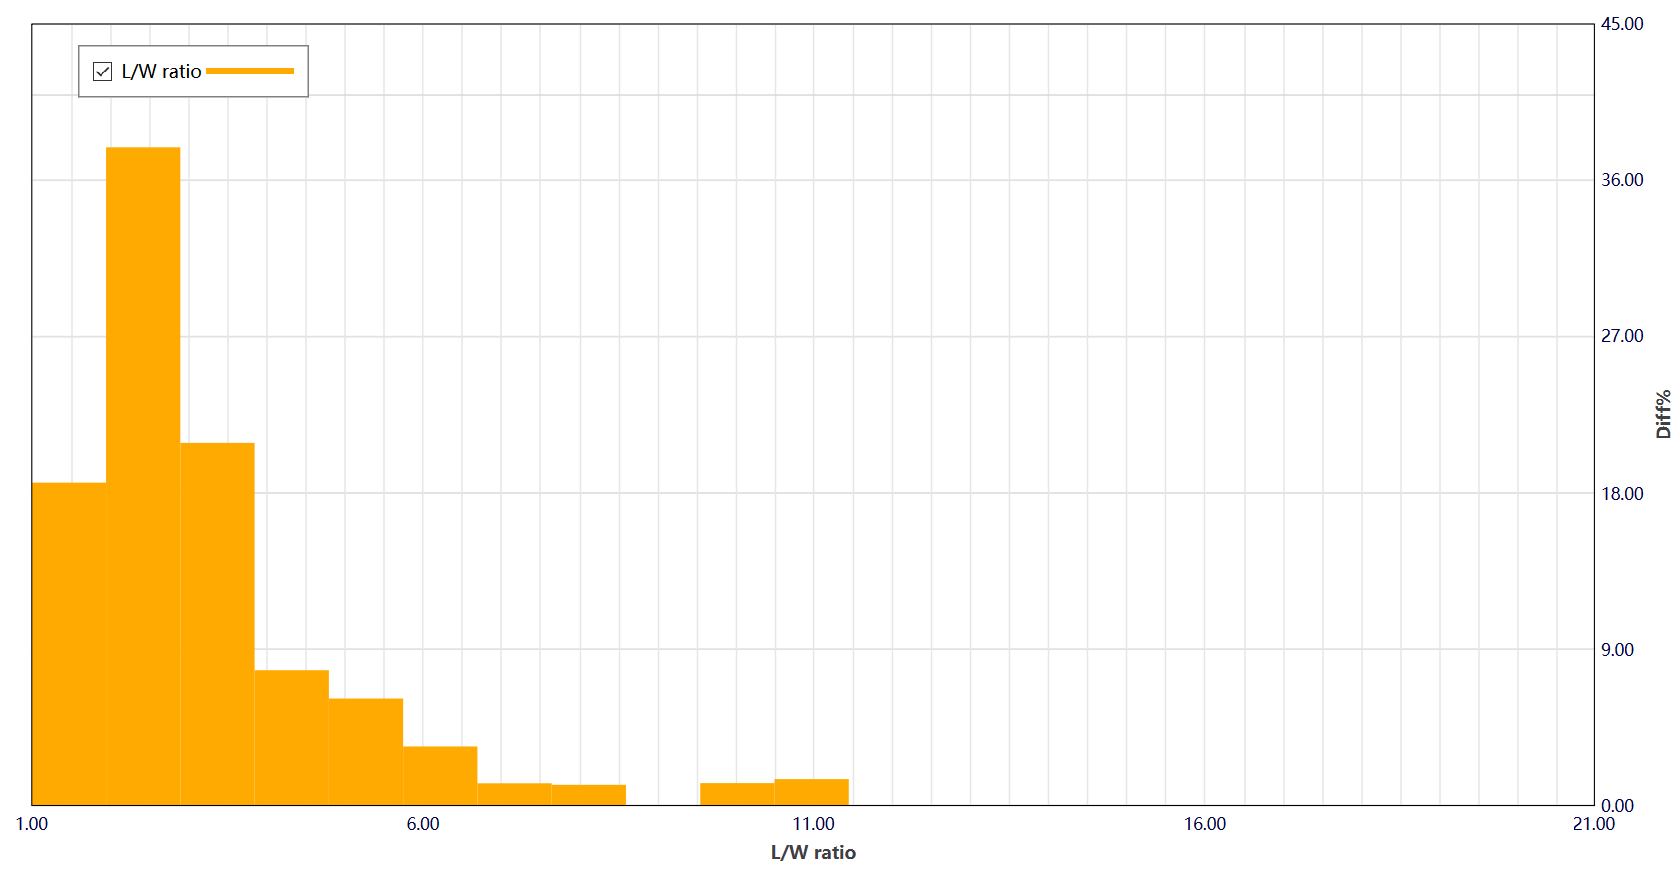
Figure 10. L/W ratio distribution curves of catalyst samples (top: catalyst 1; bottom: catalyst 2)
Straightness Analysis
Straightness is an important indicator of catalyst mechanical integrity and fixed-bed stability. Straightness values approaching 1 represent perfectly straight granules, while low values indicate severe particle bending. Particles with higher straightness value are less likely to create irregular packing structure and contribute more to predictable reactor performance.
The BeVision D3 Macro automatically calculates the straightness of each detected particle and generates distribution curves showing the proportion of particles with varying degrees of bending. This enables precise quantification of bent or deformed particles that may compromise catalyst loading performance and long-term reactor operation.
Unlike conventional particle sizing techniques, which cannot quantify particle curvature, dynamic image analysis provides objective and statistical evaluation of straightness. This capability fills an important gap in catalyst shape characterization and provides guidance for improving catalyst mechanical robustness and manufacturing quality.
Table 6. Representative Straightness values of catalyst particles
Conclusion
The length, diameter, length-to-width ratio and straightness of rod-shaped catalysts are critical shape parameters that directly influence catalytic efficiency, reactor pressure drop, bed stability and catalyst service life. Conventional testing methods are limited by low throughput, poor statistical representativeness, and an inability to quantitatively evaluated complex shape features, making them inadequate for modern catalyst quality control requirements.
Equipped with the BV-F10 Free Fall dispersion unit, the BeVision D3 Macro dynamic image particle size and shape analyzer delivers a comprehensive solution for catalyst shape characterization. In a single measurement, the system generates statistically robust distributions of particle length, diameter, L/W ratio, and straightness while preserving the original shape of catalyst particles.
The BeVision D3 Macro delivers high-throughput, repeatable and objective measurements for catalyst research and development, process optimization and routine quality inspection. By providing comprehensive shape data, the system helps catalyst manufacturers improve product consistency, optimize production processes, and ensure reliable performance in fixed-bed reactor applications.
 |
Echo Cao Senior Application Engineer @ Bettersize Instruments |
 |
BeVision D3 Macro
Dynamic Image Analyzer for Large Granular Materials Designed for particle size and shape characterization of large granular materials.
BV-F10 Free Fall dispersion preserves the original particle shape during analysis.
Measures length, diameter, L/W ratio, and straightness in a single test.
|
LOGIN TO ACCESS EXCLUSIVE CONTENT
More Resources Including
- Application Notes & Collections
- Webinars & Workshops
- Presentations & Videos
- Monthly Newsletters
- Exclusive Events...

Recommended articles
Rate this article