
Optimizing Yogurt Fermentation and Post-Acidification via Real-Time Structural Monitoring with BeScan Lab+
2026-06-23Application Note
Abstract: Yogurt fermentation and post-acidification involve continuous structural evolution of casein-based protein gels, which cannot be fully captured using conventional discrete analytical methods. This study employs BeScan Lab+ based on Static Multiple Light Scattering (SMLS) to non-destructively and in real time monitor yogurt structure during fermentation and refrigerated storage. The results reveal distinct gel formation kinetics and post-acidification behaviors between different lactic acid bacteria strains, demonstrating the capability of SMLS to provide continuous insight into gel development and structural rearrangement.
Keywords: Yogurt fermentation,Post-acidification, Protein gel structure, Casein micelles, Static Multiple Light Scattering (SMLS), BeScan Lab+, Backscattering (BS), Structural evolution, Lactic acid bacteria (LAB), Gel network formation
| Product | BeScan Lab+ |
| Industry | Food and Drink Analysis |
| Sample | Yogurt |
| Measurement Type | Stability |
| Measurement Technology | Static Multiple Light Scattering (SMLS) |
Introduction
Yogurt is a classic acid-induced milk protein gel whose quality evolves through two key stages: isothermal fermentation and low-temperature post-acidification. During fermentation, lactic acid bacteria (LAB) metabolize lactose into lactic acid, leading to a gradual decrease in pH. As the pH drops, electrostatic repulsion between casein micelles weakens, promoting aggregation of protein particles. This transition from a dispersed state to a connected structure culminates in the formation of a three-dimensional gel network at approximately pH 4.6.
Subsequently, during cold storage at 2–8 °C, the gel network continues to rearrange and stabilize. This post-acidification phase plays a critical role in determining the final texture and water-holding capacity of the yogurt.
The choice of LAB strain significantly influences both the acidification kinetics and the resulting gel microstructure. Variations in strain performance can affect fermentation time, structural development and overall product stability. Traditional analytical methods—such as titratable acidity measurement, centrifugal determination of water-holding capacity, and texture profile analysis—are typically limited to discrete sampling points. As a result, they cannot provide continuous insight into the full structural evolution from liquid milk to gel formation and subsequent cold maturation.
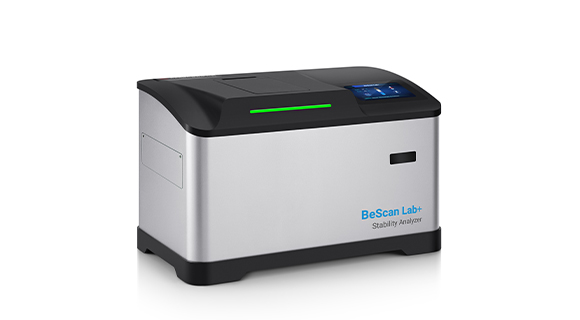
Static Multiple Light Scattering (SMLS) offers a powerful alternative by enabling in-situ, non-destructive, and real-time monitoring of complex dispersed systems. By following backscattering (BS) signals, this technique sensitively detects changes in particle size, local concentration, and refractive index contrast. In this study, BeScan Lab+ was utilized to continuously monitor the structural evolution of yogurt during fermentation and post-acidification using two commercially available LAB starter cultures (Figure 1). These results provide valuable insights into gel formation dynamics and offer datadriven support for strain selection and process optimization.
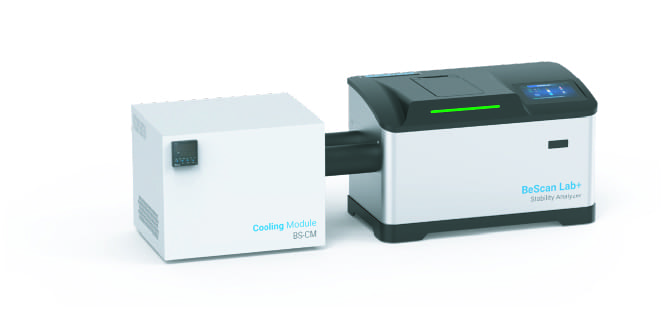
Figure 1. Diagram of the BeScan Lab+ system
Materials and Methods
Commercial organic whole milk was used as the fermentation substrate. Two commercially available LAB starter cultures (referred to as Strain 1 and Strain 2) were inoculated according to the supplier’s recommended dosage. After thorough mixing, the samples were transferred into BeScan Lab+ measurement cells.
Fermentation was carried out at 42 °C, followed by cooling to 8 °C to induce post-acidification. Throughout the process, the BeScan Lab+ instrument continuously acquired full-height backscattering (BS) profiles at 6-minute intervals.
During the post-acidification stage, the moment of temperature reduction was defined as the reference point (t0) and differential backscattering signals (dBS) were calculated relative to this baseline. Mean BS and dBS values were extracted from representative sample height regions and plotted as a function of time. Additionally, spatiotemporal distribution maps were generated to visualize structural evolution across the entire sample height.
This analysis enabled a direct comparison of fermentation kinetics and post-acidification structural rearrangement between the two LAB strains. The overall experimental workflow, from substrate preparation to multi-step instrumental monitoring, is schematically illustrated below (Figure 2).
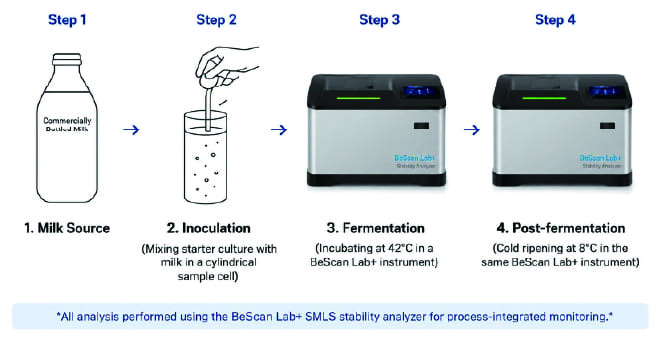
Figure 2. Schematic illustration of yogurt formation during milk fermentation
Results and Discussion
Isothermal Fermentation Stage
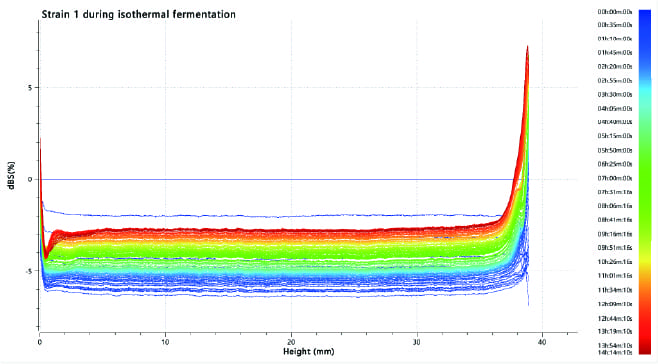
Figure 3. dBS signal as a function of height and time for Strain 1 during isothermal fermentation
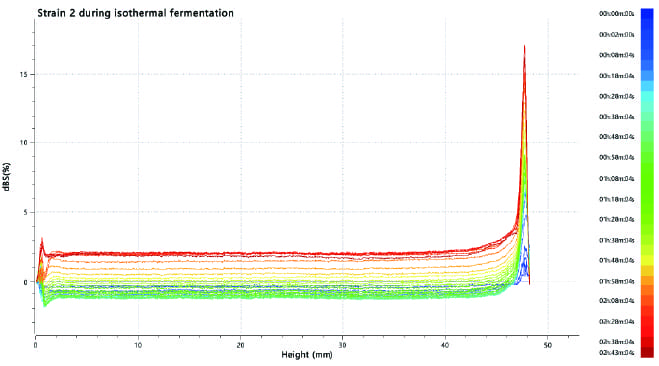
Figure 4. Evolution of backscattering (dBS) profiles as a function of sample height and fermentation time for Strain 2 during isothermal fermentation
As shown in Figures 3 and 4, both strains exhibited a characteristic three-stage evolution of BS signals during fermentation at 42 °C:
- Initial decrease in BS
- Rapid increase in BS
- Subsequent gradual decline in BS
Importantly, the BS profiles remained spatially uniform along the entire sample height throughout the fermentation process, indicating homogeneous gel formation without detectable phase separation phenomena such as whey syneresis or fat creaming.
The initial decrease in BS is attributed to changes in refractive index contrast and early modifications of the colloidal microenvironment during the onset of acidification. As the pH approached the critical gelation range (approximately pH 5.3–5.0), casein micelles progressively aggregated and interconnected, leading to the formation of a continuous threedimensional gel network. This structural transition is reflected by a pronounced increase in BS and corresponds to the solgel transition. Following the BS maximum, a gradual decline is observed, which is likely associated with network coarsening, local structural contraction, and ongoing rearrangement within the developing gel matrix.
To further compare the fermentation kinetics of the two strains, the mean differential backscattering (dBS) values were calculated and plotted as a function of fermentation time, as shown in Figure 5.
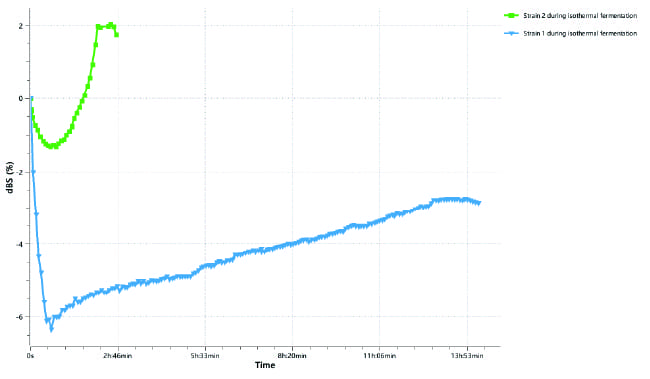
Figure 5. Comparison of mean differential backscattering (dBS) evolution during isothermal fermentation for Strain 1 and Strain 2
As illustrated in Figure 5, Strain 2 entered the BS growth phase earlier and reached its maximum response more rapidly than Strain 1, indicating accelerated acidification kinetics and earlier gel network formation. Despite the observed differences in fermentation kinetics, both strains exhibited a comparable overall increase in BS intensity, suggesting that under identical milk substrate conditions, the final extent of casein destabilization and gel network development was broadly similar.
Low-Temperature Post-Acidification Stage
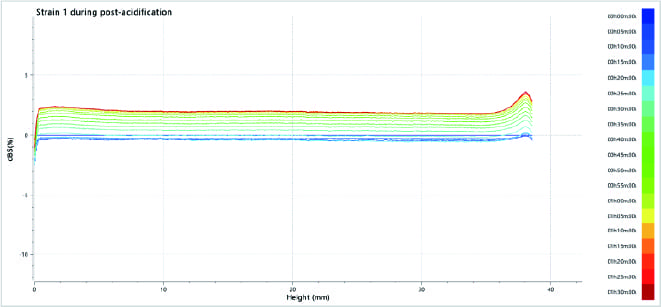
Figure 6. Evolution of differential backscattering (dBS) profiles as a function of sample height and storage time for Strain 1 during low-temperature post-acidification
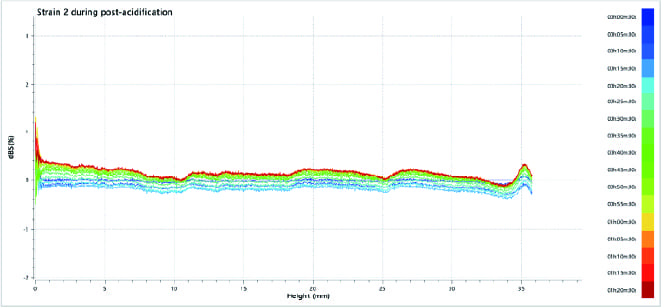
Figure 7. Evolution of differential backscattering (dBS) profiles as a function of sample height and storage time for Strain 2 during low-temperature post-acidification
After cooling to 8 °C, both samples showed a rapid decrease in differential backscattering (dBS), followed by a gradual recovery over approximately 2 hours (Figures 6 and 7). The initial decrease in dBS is primarily attributed to temperaturedependent changes in refractive index contrast, together with the relaxation of internal stresses accumulated within the gel network during the preceding fermentation stage.
Following the initial decrease, the progressive recovery of dBS suggests ongoing structural rearrangement and gradual densification of the protein network during cold storage. These observations indicate that microstructural stabilization and network maturation continue during refrigerated storage, even after the primary gelation process has been completed.
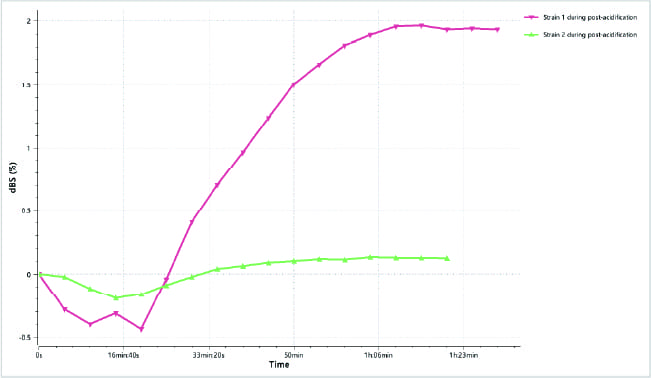
Figure 8. Comparison of mean differential backscattering (dBS) evolution during low-temperature post-acidification for Strain 1 and Strain 2
As illustrated in Figure 8, Strain 1 exhibited a significantly greater recovery in dBS compared to Strain 2. This behavior indicates more pronounced structural reorganization during post-acidification, which may correlate with improved waterholding capacity and enhanced textural stability.
Although both strains exhibited structural changes over similar timescales, suggesting that the overall kinetics of postacidification were primarily governed by temperature, the magnitude of structural rearrangement differed substantially between strains. These results suggest that strain-specific characteristics primarily influence the extent of network restructuring rather than the onset or duration of the post-acidification process.
Conclusion
BeScan Lab+ provides a powerful, non-destructive platform for real-time monitoring of yogurt structural evolution throughout the entire production process—from liquid milk to acid-induced gel formation and subsequent low-temperature post-acidification.
Under identical milk substrate conditions, Strain 2 exhibited faster fermentation kinetics and earlier gel network formation, whereas Strain 1 demonstrated more pronounced gel network restructuring during post-acidification. These findings highlight the ability of the technique to sensitively differentiate strain-dependent structural evolution patterns.
This methodology provides an objective and continuous analytical tool for starter culture selection, fermentation endpoint determination, and optimization of post-acidification conditions. When integrated with complementary measurements such as inline pH monitoring, rheological characterization, and final product quality evaluation, it can form the basis of a comprehensive yogurt process analysis framework, supporting both process optimization and industrial quality control.
Overall, the results demonstrate that SMLS-based monitoring can reveal both kinetic and structural differences between starter cultures that are not readily observable through conventional endpoint measurements, providing deeper insight into yogurt fermentation and post-acidification behavior.
About the Author
 |
Alia Yan Application Engineer @ Bettersize Instruments |
|
BeScan Lab+ Stability Analyzer
|
|
LOGIN TO ACCESS EXCLUSIVE CONTENT
More Resources Including
- Application Notes & Collections
- Webinars & Workshops
- Presentations & Videos
- Monthly Newsletters
- Exclusive Events...

Recommended articles
Rate this article