
Length and Aspect Ratio Analysis of Pharmaceutical Acicular Crystals Using the BeVision D3 Pro
2026-09-22Application Note
Acicular (needle-shaped) crystals are a common crystalline form encountered in active pharmaceutical ingredients (APIs). Crystal length, width, and aspect ratio (length-to-width (L/W) ratio) are critical parameters for pharmaceutical research, process development and quality control.
Particle size significantly influences the specific surface area and dissolution behavior of an API, directly impacting drug bioavailability and therapeutic performance. The aspect ratio provides insights into crystal shape; higher aspect ratios indicate more pronounced needle-like morphologies, that can adversely affect powder flowability, bulk density and tablet compressibility. In addition, highly acicular crystals are prone to entanglement and agglomeration, creating challenges during downstream processing steps such as filtration, centrifugation, drying and formulation.
Accurate and reliable measurement of crystal dimensions and aspect ratio enables users to better understand and control crystallization outcomes. These measurements support the optimization of recrystallization parameters including cooling profiles, solvent composition, supersaturation levels and mixing conditions to achieve consistent crystal shape and maintain polymorphic purity. Furthermore, quantitative crystal size and shape analysis supports batch-to-batch comparison, process validation and quality risk assessment, helping ensure robust manufacturing processes and the production of safe, effective and high-quality pharmaceutical products.
Measurement Method
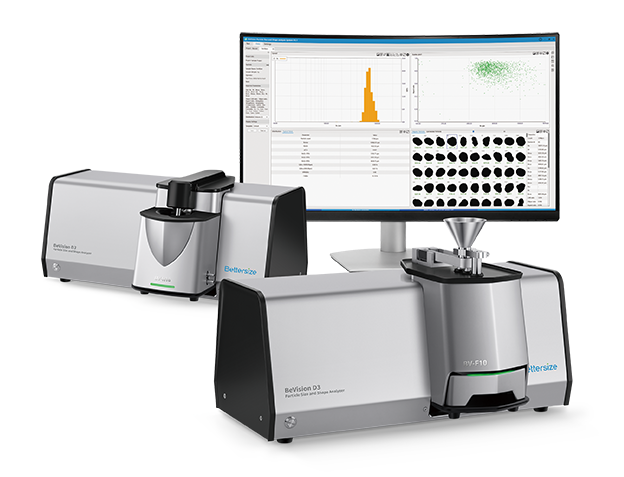
A BeVision D3 Pro dynamic image particle size and shape analyzer equipped with a BV-H10 Hydro dispersion unit was used to simultaneously characterize the particle size and shape of two pharmaceutical acicular crystal samples. Dynamic image analysis (DIA) was employed to measure particle length, width, and aspect ratio from 2-D projections of individual particles dispersed in a circulating liquid medium.
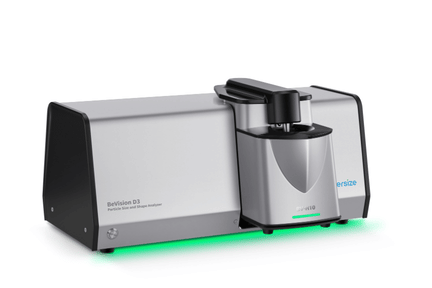
Table 1. Measurement conditions
| Dispersion method | Wet circulation |
| Medium | Anhydrous ethanol |
| Dispersant | None |
| Particles analyzed | 100,000 pcs |
| Measurement time | 2 minutes |
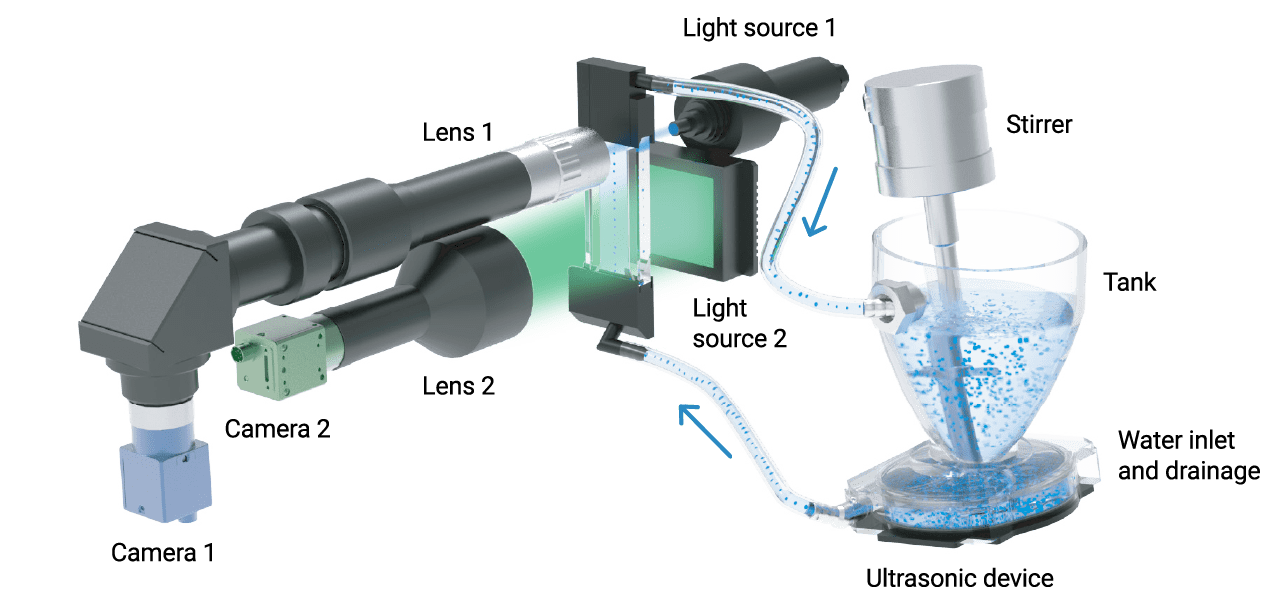
BeVision D3 Pro system configuration for DIA of acicular crystals
Results and Discussion
Maximum Feret diameter XFmax was employed to characterize the length of the acicular crystals. The Feret diameter (or caliper diameter) is defined as the distance between two parallel tangent lines on opposite sides of a particle’s projected contour. The maximum value among all possible Feret diameters of a particle is defined as Maximum Feret diameter XFmax, and is commonly used as an indicator of particle length for elongated particles.
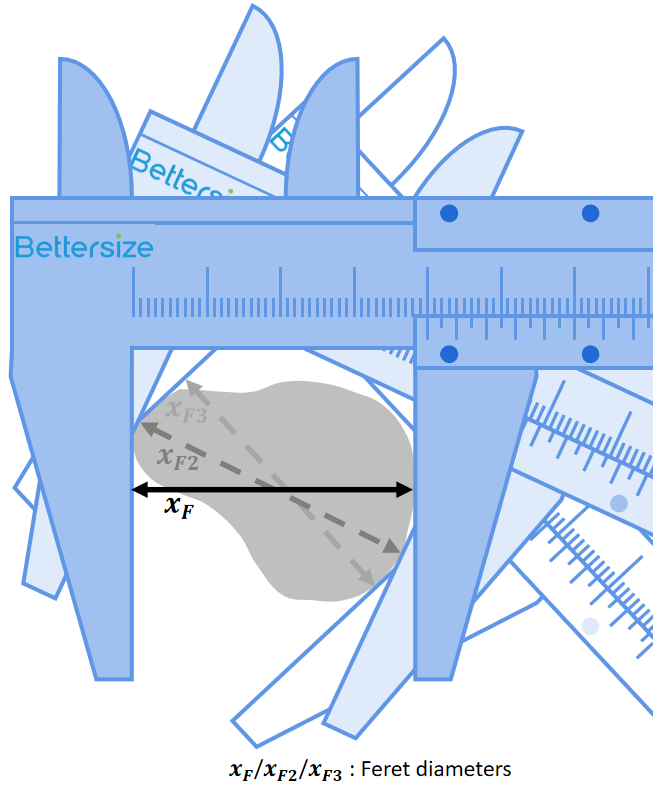
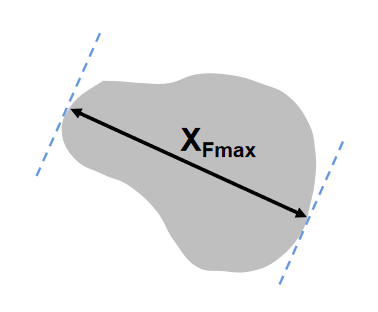
Figure 1. Definition of Maximum Feret diameter XFmax
To characterize crystal habit, the Length-to-Width Ratio (L/W Ratio) was employed. The L/W ratio is calculated as the ratio of the length to the width of the particle’s minimum bounding rectangle. Higher L/W ratio values indicate a more pronounced needle-like shape.
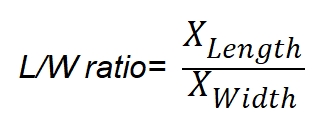
Figure 2. Definition of L/W ratio
Length Analysis
The results show that Sample 1 has a median crystal length XFmax 50 of 315.04 μm with a span of 1.23, while sample 2 exhibits a median crystal length of XFmax 50 of 318.57 μm and a span of 1.13. Although the median lengths of the two samples are similar, Sample 1 exhibits a broader particle size distribution, as evidenced by its higher span value. This indicates a greater variation in crystal length with a wider separation between fine and coarse particle fractions.
In contrast, Sample 2 demonstrates a narrower length distribution and greater size uniformity. Improved particle size consistency can contribute to more predictable downstream processing behavior and enhanced batch-to-batch reproducibility.
Single-particle measurements presented in Table 3 reveal a very broad length range within each sample: The smallest particles measure only a few micrometers in length, whereas the longest crystals exceed 600 μm, highlighting the significant particle-to-particle variability characteristic of acicular crystal systems.
Table 2. Comparison of crystal length distributions
| XFmax 10 | XFmax 50 | XFmax 90 | Span | |
|---|---|---|---|---|
| Sample 1 | 146.29 μm | 315.04 μm | 533.71 μm | 1.23 |
| Sample 2 | 153.75 μm | 318.57 μm | 516.16 μm | 1.13 |
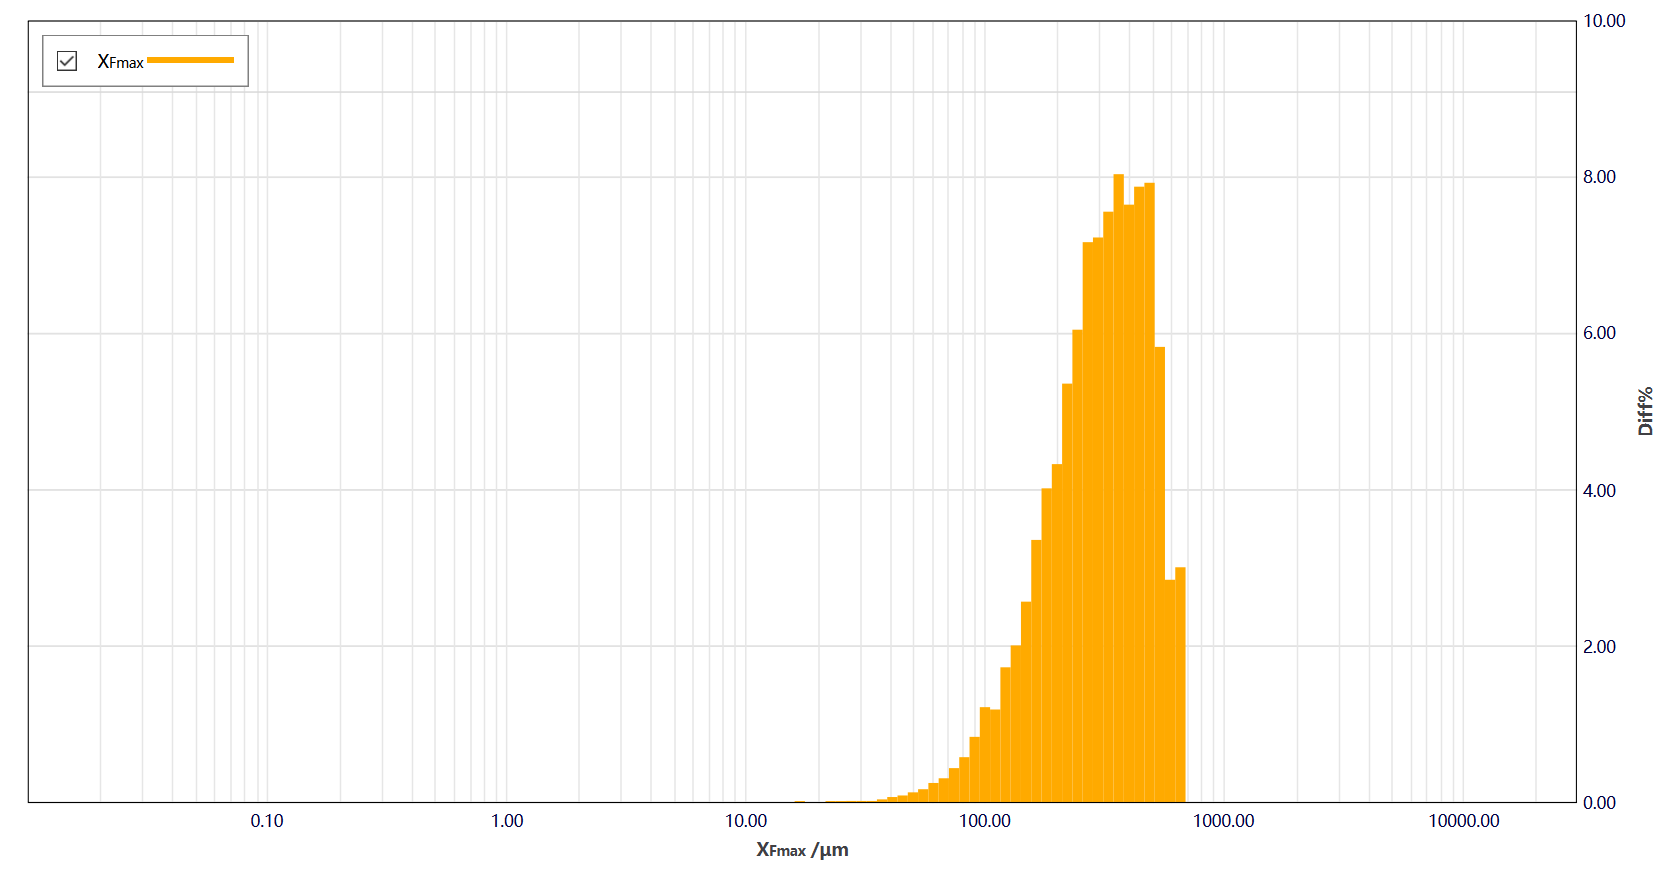
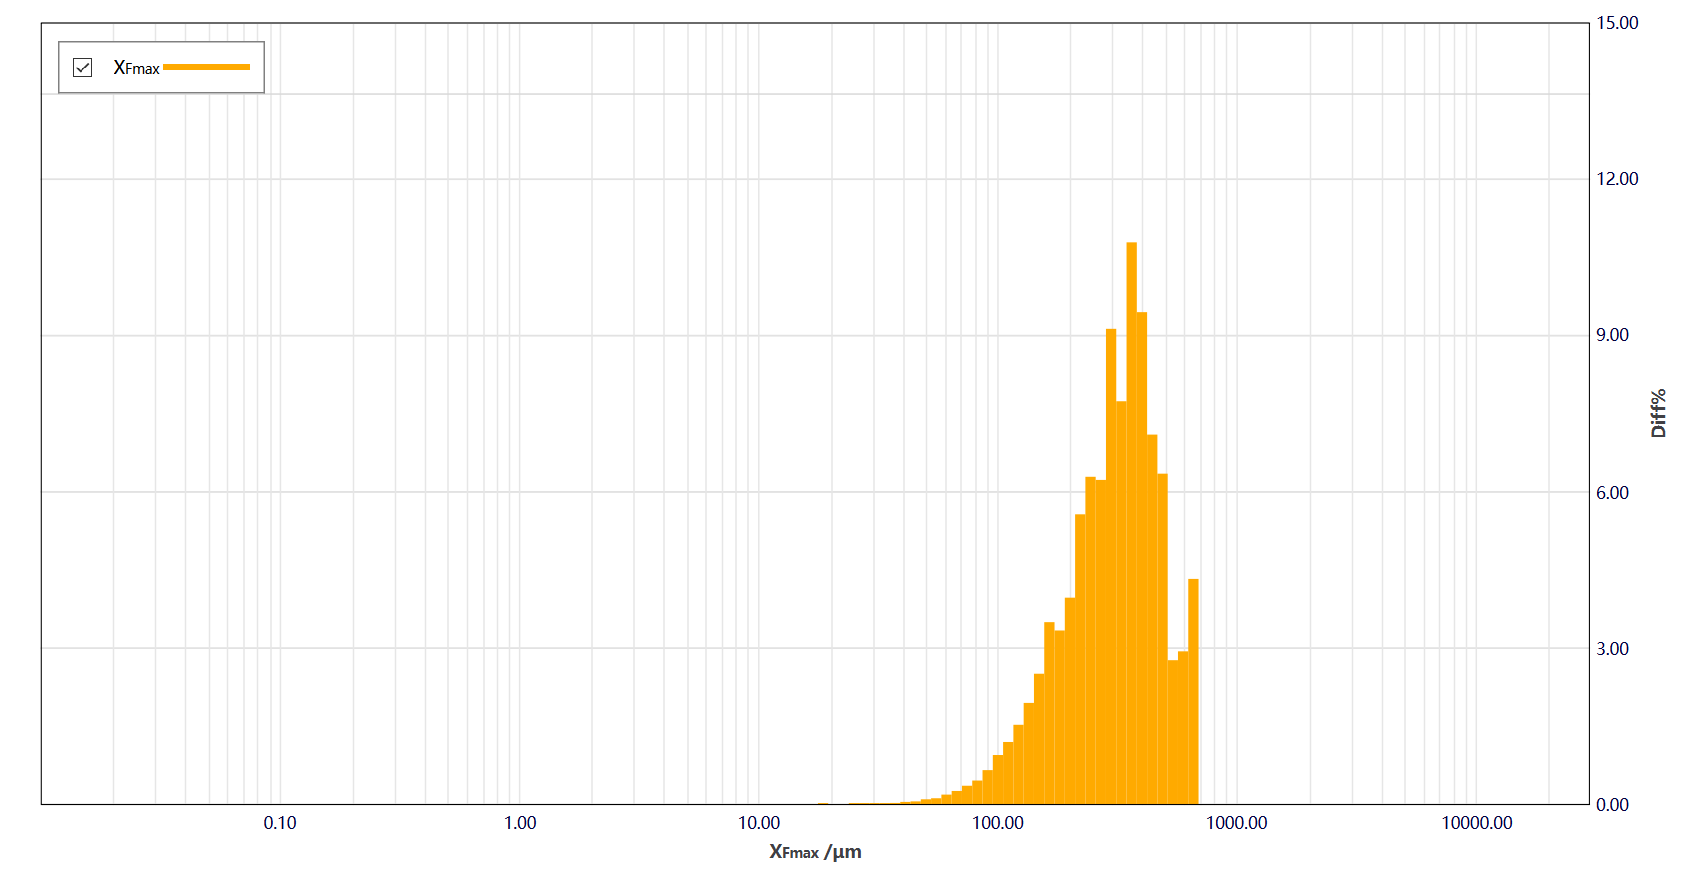
Figure 3. Length distributions of acicular crystal samples (top: sample 1; bottom: sample 2)
L/W Ratio Analysis
The length-to-width (L/W) ratio is the key parameter for evaluating the degree of crystal acicularity. Higher L/W ratio values indicate more elongated, needle-like crystal shape, whereas lower values correspond to short and more equiaxed particles.
As shown in Table 3, particle shape evolves systematically as the L/W ratio decreases. Particles with very high L/W ratios exhibit ultra-long, needle-like shapes. As the L/W ratio decreases, the shape transitions from long needles to short rods, followed by ellipsoidal particles, and finally to near-spherical fine particles.
Highly elongated crystals with L/W ratios greater than 10 may introduce processing challenges, including reduced powder flowability, lower bulk density, and an increased tendency for particle entanglement. These characteristics can contribute to difficulties during filtration, centrifugation, drying, and powder handling operations. Variations in crystal shape may lead to inconsistencies in downstream manufacturing processes and fluctuations in final product performance.
Therefore, both crystal length and L/W ratio serve as critical parameters for monitoring and controlling the quality of active pharmaceutical ingredients (APIs) throughout pharmaceutical development and manufacturing.
Table 3. Representative particle length and L/W ratio values for acicular crystal samples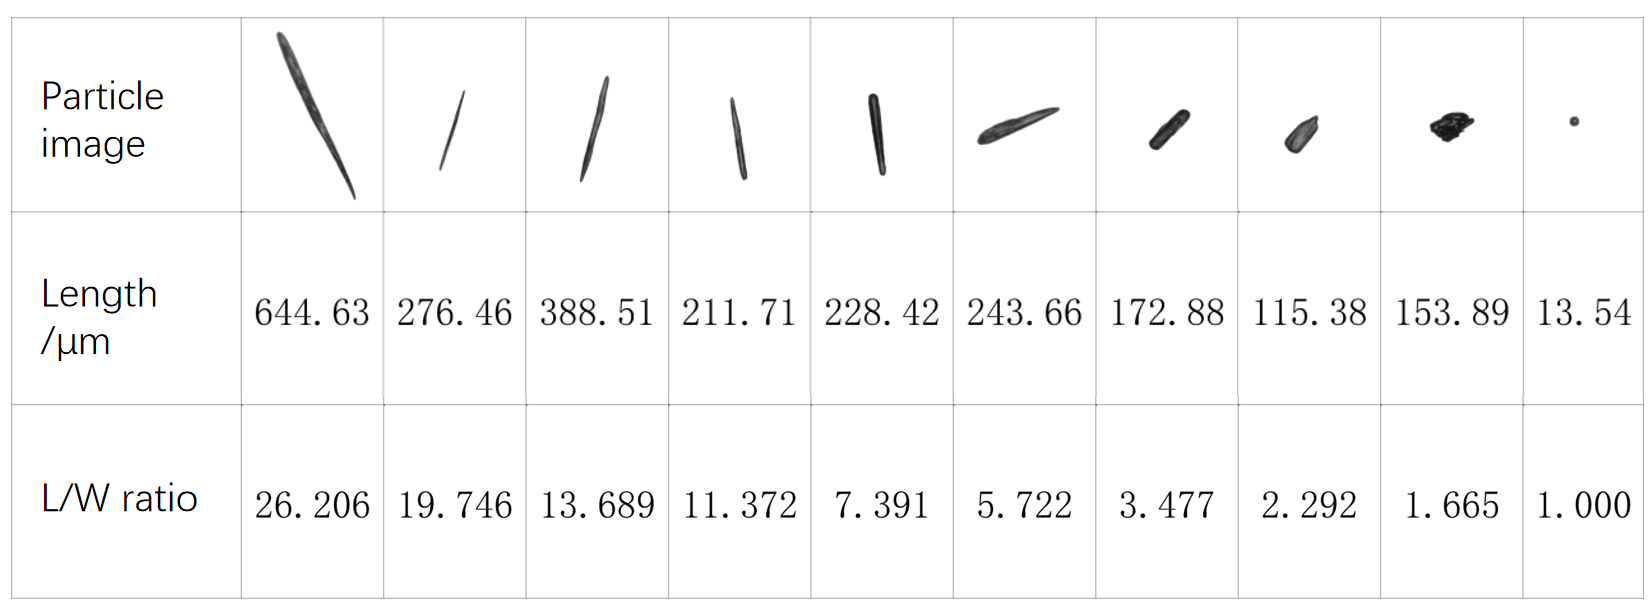
The length-versus-L/W-ratio scatter plots reveal a consistent trend for both samples: the L/W ratio increases with particle length. Ultra-long needle-shaped crystals are predominantly distributed within an L/W ratio range of 12–26, whereas fine near-equiaxed particles exhibit L/W ratios approaching 1. This relationship demonstrates that crystal elongation becomes progressively more pronounced as particle length increases.
As shown in Table 4, Sample 1 exhibits a median L/W ratio of 10.623 and an L/W ratio D90 of 19.061, while Sample 2 exhibits a median L/W ratio of 10.357 and an L/W ratio D90 of 19.852. Although the median L/W ratios of the two samples are comparable, the higher L/W ratio 90 value and larger span for Sample 2 indicate a greater proportion and broader distribution of highly elongated needle-like crystals.
The BeVision D3 Pro can automatically calculate the volume- or number-based fraction of particles within any customized L/W ratio range to precisely quantify out-of-specification acicular particles. Compared with conventional microscopy, where only hundreds of particles are typically evaluated manually, the analyzer can characterize hundreds of thousands to millions of particles in a single measurement. This high particle count significantly improves statistical confidence, enhances data representativeness, and minimizes sampling bias associated with limited particle populations.
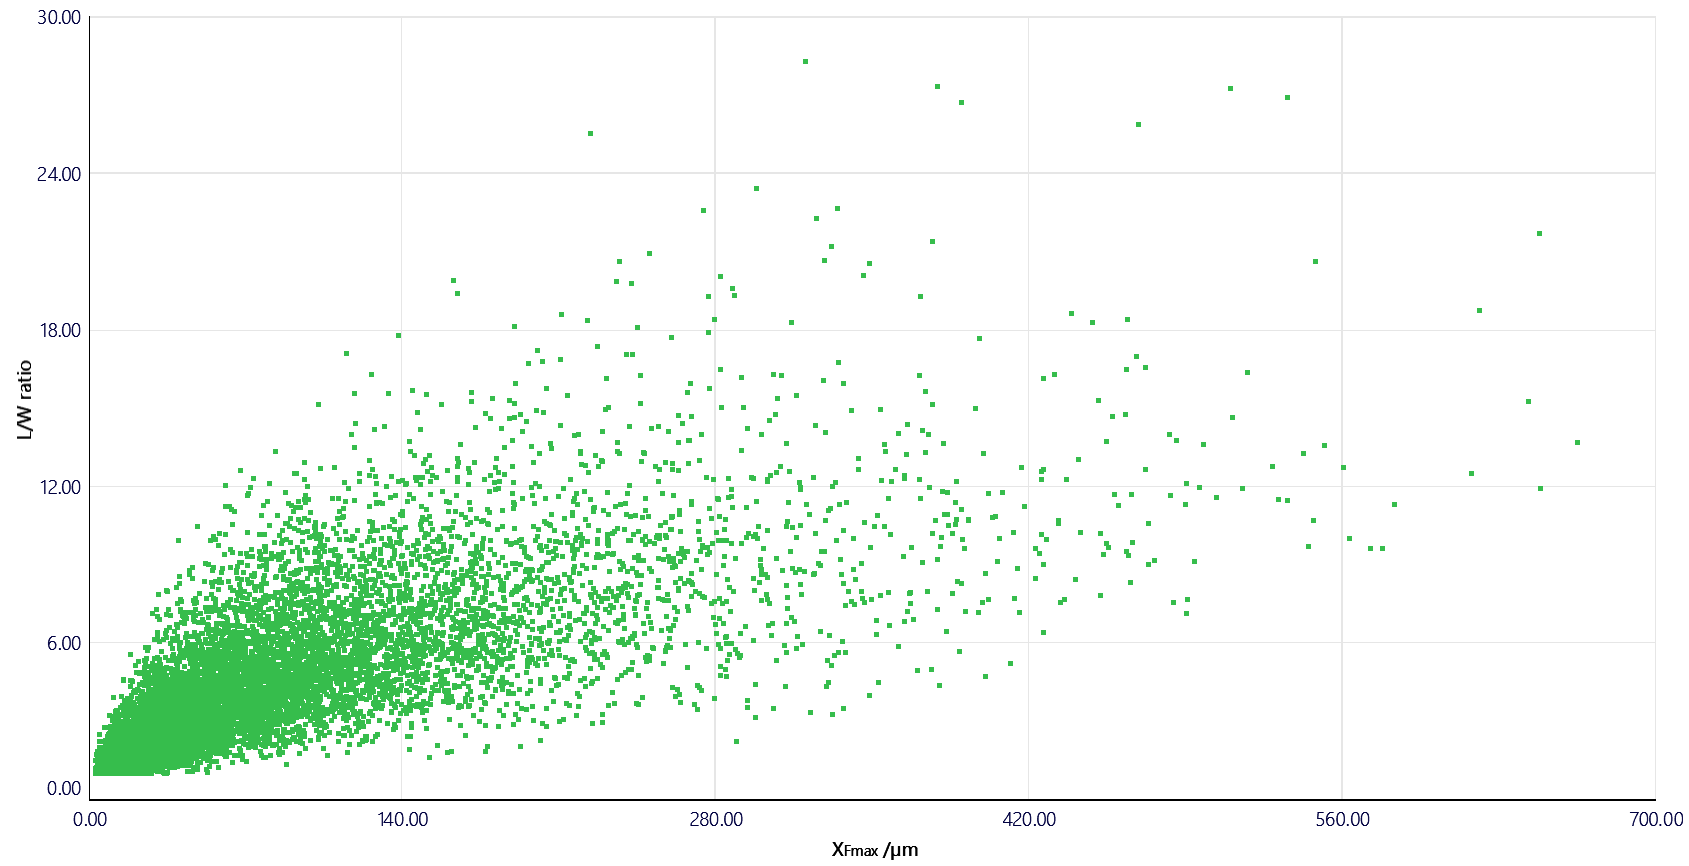
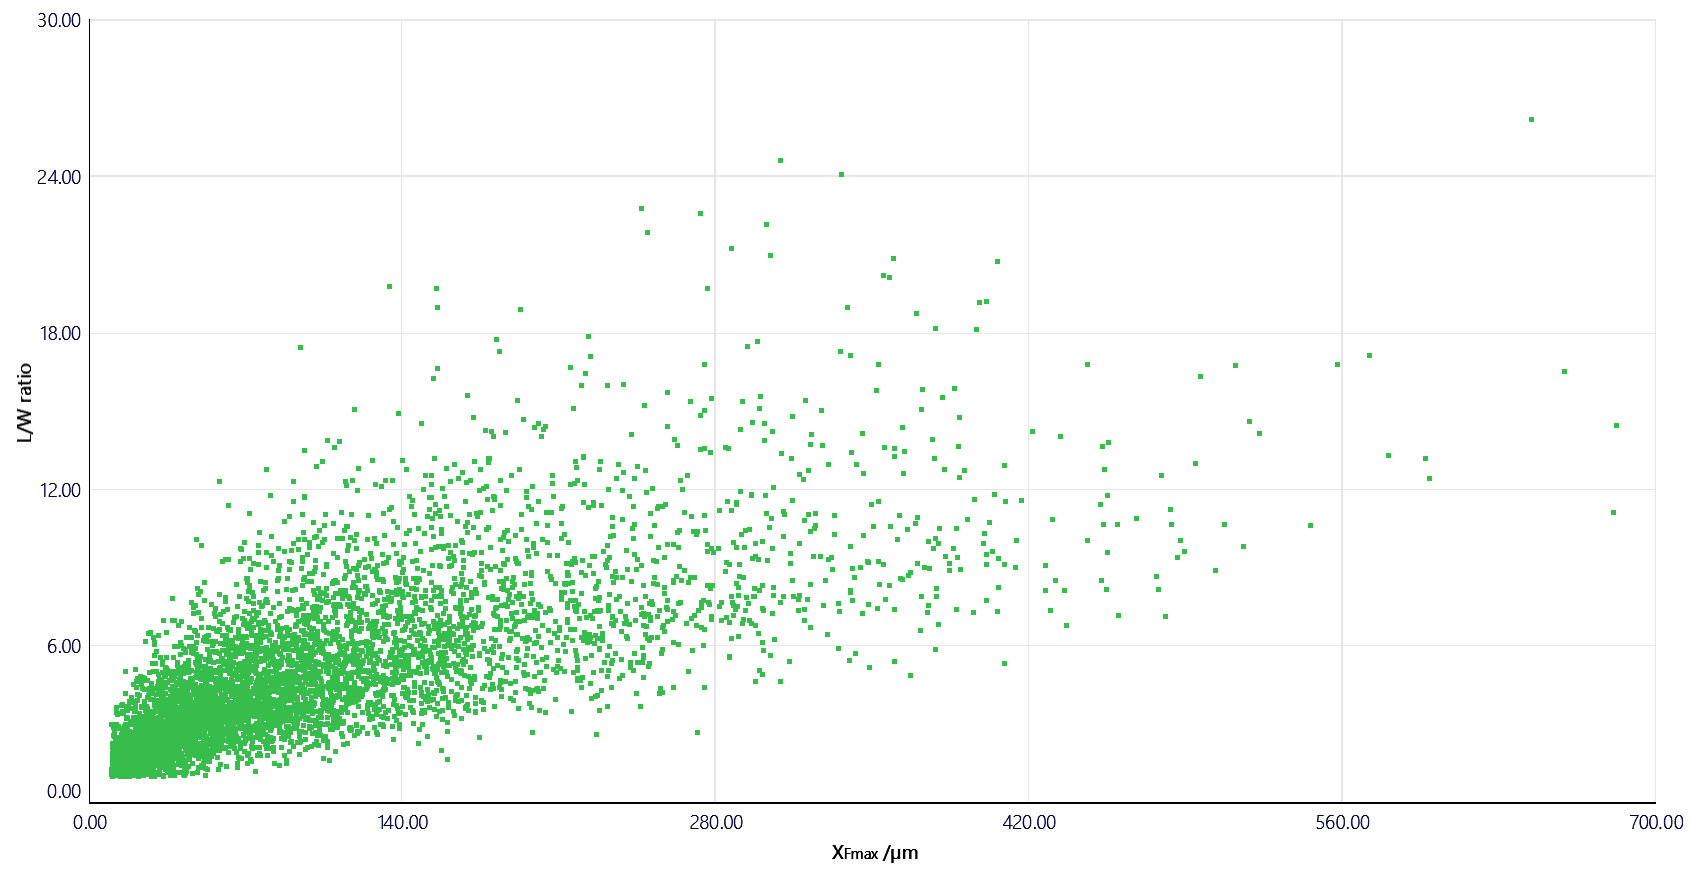
Figure 4. Length vs. L/W ratio scatter plots (top: sample 1; bottom: sample 2)
Table 4. Comparison of L/W ratio distributions for two acicular crystal samples
| L/W ratio 10 | L/W ratio 50 | L/W ratio 90 | Span | |
|---|---|---|---|---|
| Sample 1 | 5.535 | 10.623 | 19.061 | 1.27 |
| Sample 2 | 5.422 | 10.357 | 19.852 | 1.39 |
Conclusion
The length and aspect ratio of pharmaceutical acicular crystals have a direct impact on downstream API processing and final product quality. Conventional particle sizing techniques often provide limited information regarding particle shape and are unable to effectively quantify crystal acicularity. In contrast, the BeVision D3 Pro dynamic image particle size and shape analyzer combines high-speed imaging, large-scale particle analysis, and gentle wet dispersion to deliver comprehensive and accurate characterization of crystal size and shape.
BeVision D3 Pro supports pharmaceutical applications across both research and manufacturing environments:
In research & development, it enables rapid screening and optimization of crystallization and recrystallization conditions by evaluating the effects of parameters such as cooling rate, solvent composition, and mixing conditions on crystal shape. This capability helps users develop robust processes for controlling crystal size and aspect ratio. In manufacturing and quality control, the analyzer provides reliable verification of raw material and API batch consistency while monitoring critical shape attributes that influence powder handling and downstream processability. By supporting improved control of filtration, drying, blending, and tableting operations, the system helps enhance batch-to-batch consistency, maintain stable dissolution performance, and ensure overall product quality.
 |
Echo Cao Senior Application Engineer @ Bettersize Instruments |
 |
BeVision D3 Series
Advanced Image Analyzer Wide particle size and shape analysis from 0.5 μm to 26 mm using dynamic image analysis.
Dual CMOS cameras capture high-resolution images without hardware adjustment.
Powerful, intuitive software with 37+ highly relevant size and morphology parameters.
|
LOGIN TO ACCESS EXCLUSIVE CONTENT
More Resources Including
- Application Notes & Collections
- Webinars & Workshops
- Presentations & Videos
- Monthly Newsletters
- Exclusive Events...

Recommended articles
Rate this article