Particle Size Analysis of Poly-Disperse PMMA Mixtures Using the Sedimentation Technique
2025-05-19Application Note
In this application note, poly-disperse PMMA mixtures were analyzed using the sedimentation method to showcase the high-resolution capabilities of the BeNano 180 Zeta Max.
| Product | BeNano 180 Zeta Max |
| Industry | Chemicals |
| Sample | Poly-disperse PMMA mixtures |
| Measurement Type | Particle Size |
| Measurement Technology | Sedimentation Size Analysis |
Jump to a section:
Introduction
The BeNano 180 Zeta Max, a nanoparticle size and zeta potential analyzer developed by Bettersize, features a photodiode detector positioned at 0° angle. This detector monitors changes in transmitted light intensity over time, enabling precise determination of particle size and distribution. By utilizing the sedimentation method, the instrument measures the Stokes diameter of particles, making it well-suited for analyzing sizes ranging from a few microns to several tens of microns. This approach effectively addresses the limitations of dynamic light scattering (DLS), which struggles with micron-sized particle detection.
In this application note, poly-disperse PMMA mixtures were analyzed using the sedimentation method to showcase the high-resolution capabilities of the BeNano 180 Zeta Max
Experimental
The BeNano 180 Zeta Max determines particle size by measuring transmitted light intensity and applying Stokes' law.

Conducting sedimentation particle size analysis requires knowledge of key parameters, including the refractive index, density, and viscosity of the dispersant at the corresponding temperature, as well as the refractive index, density, and volume of the sample.
This experiment analyzed multiple PMMA spheres with known particle sizes, determined via laser diffraction. The measured sizes were 5.4 μm, 9.5 μm, 14.9 μm, and 18.5 μm, with samples mixed in different combinations for testing.
| Sample No. | Population | Size Ratio |
| #1 |
5.4 μm + 18.5 μm
|
1 : 3.4
|
| #2 |
5.4 μm + 9.5 μm
|
1 : 1.75
|
| #3 |
9.5 μm + 14.9 μm
|
1 : 1.56
|
| #4 |
9.5 μm + 14.9 μm + 18.5 μm
|
1 : 1.56 : 1.95
|
|
Parameter
|
Value
|
| Sample Volume (mL) | 2 |
| Material | PMMA |
|
Material Refractive Index
|
1.49
|
|
Material Absorption
|
0 |
|
Material Density (g/cm³)
|
1.23 |
|
Dispersant
|
Water |
|
Dispersant Refractive Index
|
1.33 |
|
Dispersant Density (g/cm³)
|
1 |
|
Dispersant Viscosity (cp)
|
0.8936 |
For sedimentation-based particle size analysis using the BeNano 180 Zeta Max, the samples were combined at specific ratios and placed in a 10 mm glass cuvette. Prior to measurement, they were equilibrated at 25°C for 120 seconds. A pipette was used to ensure thorough mixing.
Results and Discussion
![]()


Figures 1 to 4 illustrate the transmission signals and corresponding particle size distribution curves, highlighting key patterns:
- In bimodal mixtures, the transmission signal exhibits three distinct plateaus, including the initial plateau.
- In trimodal mixtures, the transmission signal presents four distinct plateaus, including the initial plateau.
The particle size distribution curves effectively differentiate the various size peaks within the mixed samples, with peak sizes summarized in Table 3.
|
Nominal Size (μm)
|
5.4 | 9.5 | 14.9 | 18.5 |
|
Sample #1
|
5.01 | - | - | 18.21 |
| Sample #2 | 5.01 | 8.71 | - | - |
| Sample #3 | - | 8.71 | 13.81 | - |
| Sample #4 | - | 8.71 | 13.81 | 18.22 |

Conclusion
The sedimentation method accurately determines peak sizes, showing strong alignment with nominal size values. Based on the particle size ratios in the mixtures, the sedimentation method of the BeNano 180 Zeta Max effectively differentiates distinct populations when their sizes vary by a factor of 1.5 or greater.
About the Authors
 |
Zhibin Guo Application Manager @ Bettersize Instruments |
 |
Dr. Ning Chief Product Officer @ Bettersize Instruments |
|
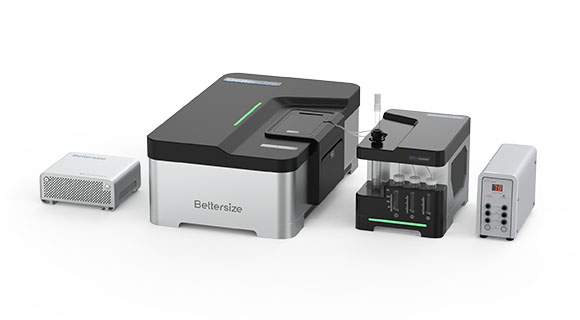
BeNano 180 Zeta Max Advanced Nanoparticle Size & Zeta Potential Analyzer
|
|
LOGIN TO ACCESS EXCLUSIVE CONTENT
More Resources Including
- Application Notes & Collections
- Webinars & Workshops
- Presentations & Videos
- Monthly Newsletters
- Exclusive Events...

Recommended articles
Rate this article