Particle Size Analysis of Inks Using the Bettersizer 2600 Plus
2026-02-17Application Note
Abstract: Ink performance is highly dependent on pigment particle size and particle size distribution (PSD), which directly affect color strength, opacity, viscosity, and printing stability. This application note demonstrates particle size analysis of ink samples using laser diffraction, showing how precise PSD control supports grinding process optimization during R&D and ensures batch-to-batch consistency in ink production.
Keywords: Ink, Pigment particles, Particle size distribution (PSD), Laser diffraction, Grinding process optimization, Quality control
| Product | Bettersizer 2600 Plus |
| Industry | |
| Sample | Ink despersions |
| Measurement Type | Particle Size |
| Measurement Technology |
Introduction
Ink is a liquid dispersion system typically composed of pigments, a liquid carrier, and functional additives. The pigments, dispersed as solid particles within the liquid phase, play a critical role in determining ink performance parameters such as color strength, opacity, and viscosity. As a result, pigment particle size and size distribution (PSD) are key quality attributes that must be carefully controlled.
Particle size directly influences ink properties in several ways:
- Color strength: Smaller pigment particles provide a higher specific surface area, enhancing light absorption and resulting in increasing color strength.
- Opacity: Maximum opacity is commonly achieved when pigment particles have a mean size in the range of 0.15 - 0.40 μm, where light scattering efficiency is greatest.
- Viscosity: As particle size decreases, particle-particle interactions increase, which can lead to higher suspension viscosity.
In addition to average particle size, the width and shape of the PSD are equally important. A broad or multimodal PSD can reduce color strength and often suggested inadequate dispersion or particle agglomeration.
Failure to monitor and control pigment particle size and PSD during ink development and production can result in practical challenges, including nozzle clogging in inkjet printing, inconsistent print quality, and reduced long-term stability of the ink system. Therefore, effective control of pigment particle size is vital for ensuring consistent ink performance and process reliability.
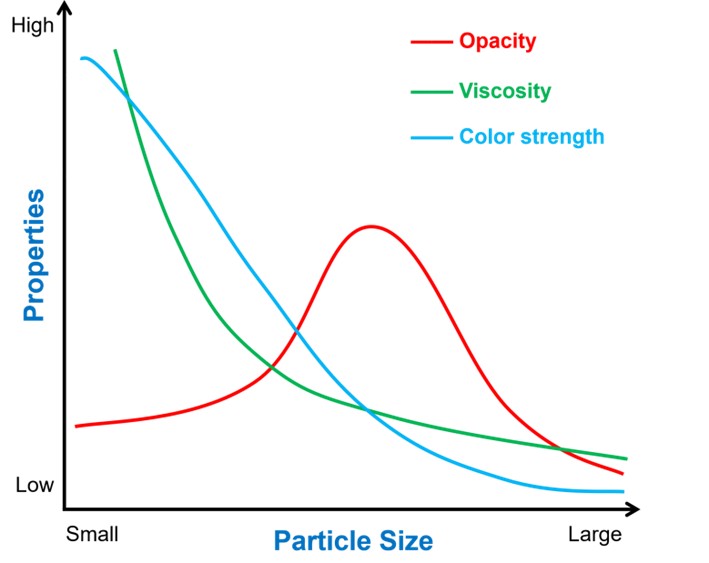
Figure 1. Influence of particle size on ink physical properties.
This application note presents two ink case studies measured using the Bettersizer 2600 Plus. Measurements were performed in solvent-based dispersion media using a corrosion-resistant BT-80N Pro automatic wet dispersion unit, ensuring accurate and reproducible particle size data. These case studies demonstrate how precise particle size analysis supports formulation optimization during research and development, as well as quality control and assurance during production.
Experiment
Two groups of ink samples were evaluated in this study. Group A consisted of six samples obtained from an R&D project aimed at assessing and optimizing different grinding processes. Group B included six samples collected from separate production batches on the same production line, representing routine manufacturing variability.
Particle size measurements were carried out using the Bettersizer 2600 Plus equipped with the BT-80N Pro automatic wet dispersion unit. To assess measurement repeatability, each sample was measured six consecutive times under identical conditions.
The sample preparation, dispersion, and measurement parameters for Group A and Group B are summarized in Table 1.
Table 1. Measuring procedure parameters for Group A and Group B samples
| Procedure |
Parameter |
Group A | Group B |
| Sample Preparation |
Sample amount |
0.3 mL | 0.1 mL |
| Pre-treatment | 5 min. water-bath ultrasonication @40 kHz |
None | |
| Dispersion | Dispersion medium | Methyl ethyl ketone (MEK) | N,N-Dimethyla etamide (DMAC) |
| Circulation speed | 1200 rpm | 1200 rpm | |
| Internal sonication | 35W, 60s | 35W, 120s | |
| Measurement | Optical model | Mie | Mie |
| Particle refractive index (RI) | 2.741 | 1.38 | |
| Particle absorption rate (AR) | 0.1 | 0.1 | |
|
Medium RI |
1.379 | 1.438 | |
| Obscuration range | 8 - 15 % | 10 - 12 % | |
| Measurement repetitions | 6 | 6 |
Experiment
Using two sets of real customer samples, the following application examples demonstrate how particle size analysis supports both process development in R&D and quality control in production.
Application Example 1: R&D – Grinding Process Optimization
To evaluate the influence of grinding time on pigment particle size distribution during process development, particle size measurements were performed on the Group A samples.
The particle size results for six samples prepared with progressively longer grinding times are summarized in Figure 2 and Table 2. As grinding time increases, the characteristic particle size parameters D10, D50, and D90 show a clear downward trend, indicating the effective reduction of coarse particles and improved dispersion.
From samples A4 to A6, the particle size distribution becomes largely stable. Only a slight decrease in D90 is observed while D10 and D50 remain essentially unchanged. This behavior suggests that further grinding beyond this point yields diminished returns in terms of particle size reduction.
When both processing efficiency and production cost are considered, the grinding condition represented by sample A4 provides an optimal balance. It achieves a stable and well-controlled particle size distribution without unnecessary increases in grinding time or energy consumption.
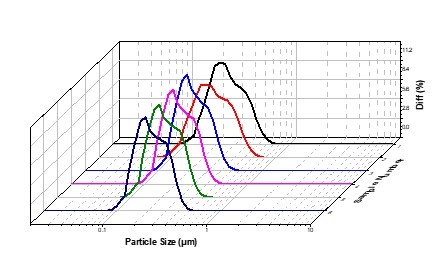
Figure 2. Particle size distributions of Group A samples prepared at different grinding times
Table 2. Characteristic particle size values of samples prepared at different grinding times.
| Sample | D10 (µm) | D50 (µm) | D90 (µm) | D97 (µm) |
| A1 - 10 min | 0.146 | 0.227 | 0.396 | 0.476 |
| A2 - 30 min | 0.137 | 0.224 | 0.395 | 0.475 |
| A3 - 50 min | 0.135 | 0.197 | 0.320 | 0.376 |
| A4 - 70 min | 0.133 | 0.196 | 0.318 | 0.372 |
| A5 - 90 min | 0.133 | 0.196 | 0.316 | 0.369 |
| A6 - 110 min | 0.133 | 0.196 | 0.313 | 0.364 |
These results clearly demonstrate that particle siz analysis provides clear insight during R&D, enabling the identification of efficient grinding windows, improving process selection, and preventing unnecessary overgrinding.
Application Example 2: Quality Control – Batch Consistency Monitoring
While particle size analysis is essential during process development, it is equally critical for routine quality control. In this example, the customer established target particle size values (D10: 0.153 μm, D50: 0.277 μm, D90: 0.52 μm) along with corresponding tolerance limits to monitor batch-to-batch consistency. Six consecutive batches produced on the same manufacturing line were analyzed.
The measurement results were evaluated using the instrument software’s data evaluation function. As shown in Figure 3, all six batches exhibited D10, D50, and D90 values close to the defined targets. Excellent measurement repeatability was achieved, ranging from 0.00%–0.41%. The D10 and D50 values remained essentially constant across batches, while only minor variation was observed in D90
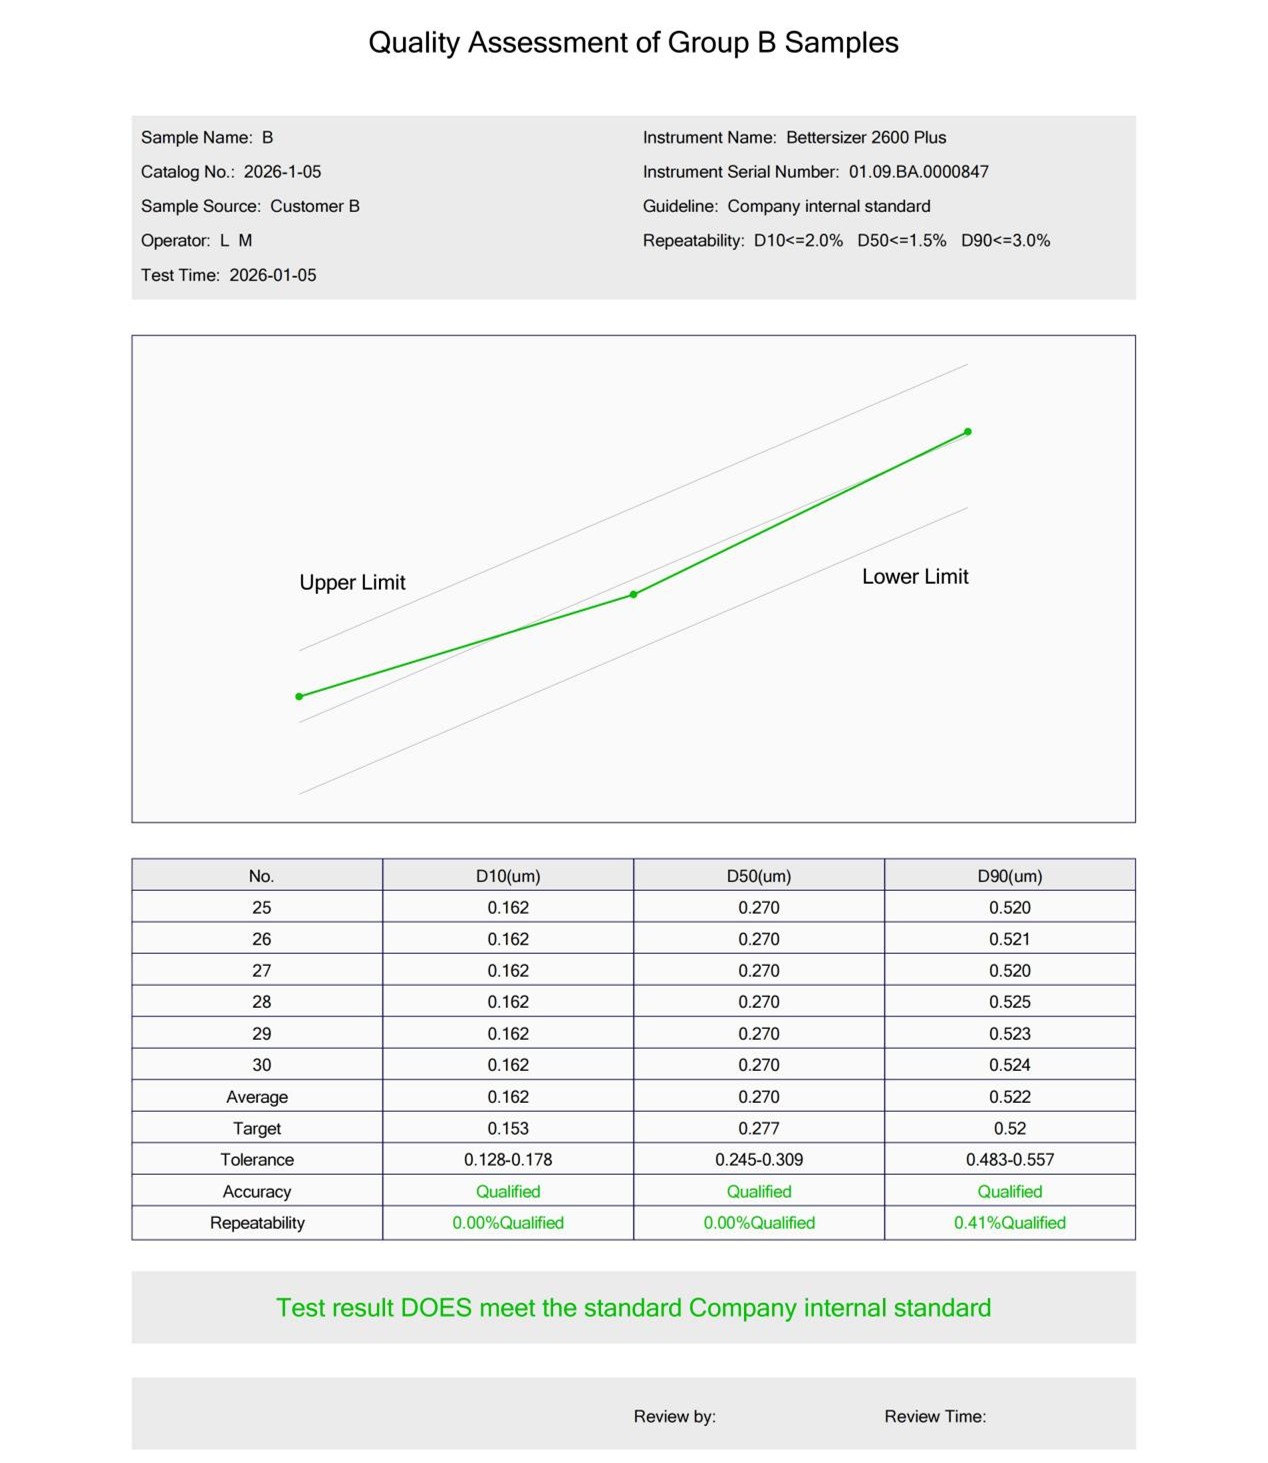
Figure 3. Data evaluation report for six consecutive production batches
The overall trend shows small fluctuations around the target curves, indicating that the selected tolerance ranges were well defined—sensitive enough to distinguish batch-to-batch differences while remaining practical for routine manufacturing control. With continued process optimization and increased process stability, these tolerances could potentially be further tightened to enhance product uniformity and strengthen brand consistency.
By directly comparing measured particle size distributions with the target curves, the software provides an intuitive and objective assessment of batch compliance. It automatically reports average values, repeatability metrics, and pass/fail status, significantly reducing the need for manual calculations and subjective assessments. When any particle size parameter exceeds the predefined tolerance, the system flags the deviation, enabling engineers to quickly investigate potential causes such as raw material variability, insufficient grinding, or changes in dispersion conditions.
This case highlights the value of the software’s “data evaluation” function in routine quality control operations. Continuous monitoring of particle size enables ink manufacturers to respond rapidly to process deviations, and maintain consistent product performance and stable production processes.
Conclusion
Using practical ink samples from two customers, this application note illustrates how the Bettersizer 2600 Plus serves as a reliable and versatile particle size analysis platform for both ink formulation development and routine quality control.
During R&D, the Bettersizer 2600 Plus delivers precise and highly repeatable particle size measurements, enabling effective evaluation of grinding processes, formulation optimization and performance-driven decision making.
In quality control, it supports consistent batch-to-batch particle size control, enhances process stability, and enables rapid detection of deviations through automated data evaluation and repeatability monitoring.
Overall, the Bettersizer 2600 Plus provides ink manufacturers with a robust analytical solution that helps maintain high product quality while improving development efficiency and ensuring reliable, stable production processes.
About the Authors
 |
Zhichao Han |
|
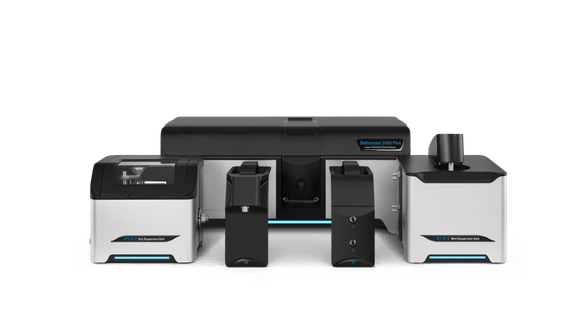
Bettersizer 2600 Plus Particle Size and Shape Analyzer
|
|
LOGIN TO ACCESS EXCLUSIVE CONTENT
More Resources Including
- Application Notes & Collections
- Webinars & Workshops
- Presentations & Videos
- Monthly Newsletters
- Exclusive Events...

Recommended articles
Rate this article