Beyond Density: Characterizing Open and Closed Cell Content in Rigid Foams
2025-10-21Application Note
Abstract: Ethylene–vinyl acetate (EVA) and expanded polyethylene (EPE) foams are widely utilized in packaging, thermal insulation, and acoustic applications due to their favorable mechanical and physical properties. In addition to visual and structural characteristics, the ratio of open and closed cells within the foam significantly influences key performance metrics such as moisture resistance, thermal conductivity, cushioning behavior, and sound attenuation. This application note outlines a gas pycnometer-based methodology for quantifying open and closed cell content in EVA and EPE foams. Accurate measurement of these parameters enables more reliable prediction of material performance and supports informed material selection for specific application requirements.
Keywords: Rigid foam, Open cell content, Closed cell content, Gas pycnometer, ASTM D6226, ISO 4590
| Product | BetterPyc 380 |
| Industry | |
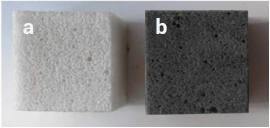
| Sample | EVA foam, EPE foam |
| Measurement Type | Density |
| Measurement Technology |
Jump to a section:
Introduction
Rigid foams are extensively used in industries such as construction, automotive, aerospace, and packaging due to their lightweight structure and versatile performance characteristics. While density has traditionally been the primary metric for evaluating foam quality, analysis of the cell structure provides more comprehensive insights into the material's functional properties.
In rigid foam materials, open cell content refers to interconnected pores that permit the passage of gas and fluids, whereas closed cell content refers to isolated pores that are sealed off from the surface, resulting in reduced permeability. Open cell foams generally offer higher breathability and water absorption, while closed cell foams provide enhanced waterproofing and insulation.
Precise quantification of open and closed cell content is essential for evaluating key performance attributes such as mechanical integrity, thermal efficiency, and long-term durability. These measurements play a crucial role in quality assurance, material design refinement, and process optimization, ensuring that the foam structure aligns with the functional requirements of its intended application.
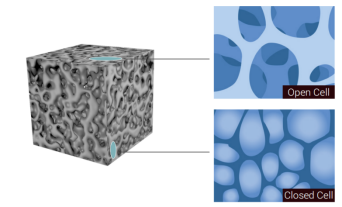
Figure 1. Structure of rigid foam material
Instrument and Sample Description
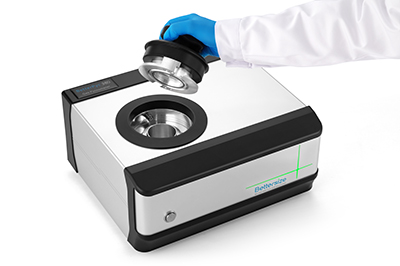
Measurements were performed using the BetterPyc 380 gas pycnometer, a precision instrument designed for accurate determination of true density and related volumetric properties. The analysis focused on quantifying the open and closed cell contents of EVA and EPE foam samples. This was achieved by integrating geometric volume, mass, and specific gravity data to calculate the proportion of interconnected “open” versus sealed “closed” cells within the foam structure.
Determination of Open Cell Content
Complying with the ASTM D6226 and ISO 4590, the gas pycnometer provides a consistent method for achieving efficient measurements of open cell content in rigid foam. The testing procedure is as follows:
The open cell content Ov is calculated using the corrected volumes measured before and after specimen trisection:
where:
V = geometric volume of the original foam cube specimen
VSPEC = specimen displacement volume of the two intact foam cubes
VSPEC2 = specimen displacement volume after trisection into 16 smaller specimens
Segmenting the foam specimens into smaller pieces helps eliminate surface air interference and improve gas penetration during measurement. This approach enhances the accuracy of corrected volume readings, resulting in more precise calculations of open cell content.
Determination of Closed Cell Content
When the specific gravity (sg) of the solid material is known, the percentage of volume occupied by the cell walls (Wv) and the closed cells (Cv) can be calculated as follows:
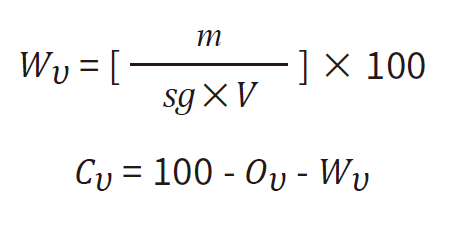
Where:
m = mass of the foam specimen (g)
sg = specific gravity of the solid material (g/cm³)
V = geometric volume of the foam specimen (cm³)
These calculations provide insight into the internal structure of the foam, enabling evaluation of its density distribution and closed cell integrity. Accurate determination of Wv and Cv facilitates performance prediction for applications requiring moisture resistance, thermal insulation, and mechanical durability.
Experimental Data Analysis and Comparison
Table 1 summarizes the measurement conditions used during testing, while Table 2 presents the basic physical parameters of the EVA and EPE foam samples — including geometric volume, mass, and specific gravity — which serve as input data for subsequent analysis with the BetterPyc 380.
Table 1. Measurement conditions
| Parameter | Value | Parameter | Value |
| Temperature | 25℃ | Sample cup | 100 mL |
| Gas type | Nitrogen | Equilibrium | 0.01 psig/min |
| Purge cycle | 10 | Purge pressure | 3 psig |
| Analysis cycle | 3 | Analysis pressure | 3 psig |
Table 2. Foam sample information
| Sample | Geometric Volume (cm3) | Mass(g) | Specific Gravity |
| EVA foam | 30.9850 | 0.3820 | 0.92 |
| EPE foam | 52.4031 | 0.5115 | 0.95 |
As shown in Table 3, the open and closed cell contents of EVA and EPE foams were determined using the gas displacement method, an efficient and reliable technique for characterizing foam cell structures. The EPE foam exhibited a significantly higher open cell content (96.33%) and a lower closed cell content (2.64%) compared to EVA foam (88.42% and 10.24%, respectively), indicating that EPE possesses a more porous and permeable internal structure.
Quantifying the open and closed cell contents of EVA and EPE foams provides valuable insight into their functional characteristics. Materials with higher open cell content, such as EPE, generally allow greater airflow, flexibility, and acoustic absorption. In contrast, materials with higher closed cell content, such as EVA, provide superior airtightness, mechanical strength, and thermal insulation. These structural differences directly influence the performance and suitability of foam materials for specific applications.
Additionally, the low standard deviations (≤ 0.08%) observed across all measurements highlight the excellent repeatability and precision of the BetterPyc 380, confirming its reliability for accurate foam characterization.
Table 3. The cell content results of foam specimens
| Sample | NO. |
Open Cell Content |
Std.Dev. (%) |
Closed Cell Content (%) |
Std.Dev. (%) |
| EVA foam | 1 | 88.35 | 0.06 | 10.32 | 0.06 |
| 2 | 88.42 | 10.24 | |||
| 3 | 88.50 | 10.16 | |||
| Average | 88.42 | 10.24 | |||
| EPE foam | 1 | 96.44 | 0.08 | 2.53 | 0.08 |
| 2 | 96.32 | 2.65 | |||
| 3 | 96.23 | 2.74 | |||
| Average | 96.33 | 2.64 | |||
Conclusion
This study demonstrates that the BetterPyc 380 gas pycnometer provides a reliable and standardized method for characterizing the open and closed cell contents of rigid foams in accordance with ASTM D6226 and ISO 4590. Quantitative analysis of EVA and EPE foams revealed distinct structural differences: EPE possesses a predominantly open-cell structure, while EVA retains a higher closed cell content — each contributing to unique performance advantages.
These measurements provide insights beyond conventional density metrics, offering a deeper understanding of foam morphology and its influence on functional properties such as permeability, insulation, and mechanical strength. Incorporating open and closed cell analysis into routine quality control and R&D workflows enables manufacturers to optimize formulations, enhance product performance, and ensure consistency across production batches.
About the Authors
 |
Feiqing Shen |
|
BetterPyc 380
Accurascy meets versatility
|
|
LOGIN TO ACCESS EXCLUSIVE CONTENT
More Resources Including
- Application Notes & Collections
- Webinars & Workshops
- Presentations & Videos
- Monthly Newsletters
- Exclusive Events...

Recommended articles
Rate this article