Assessing PET Grade Through Molecular Weight Analysis Using the BeSEC
2026-01-23Application Note
Abstract: Polyethylene terephthalate (PET) grades are primarily defined by molecular weight, which directly influences mechanical performance and processing behavior. In this study, size-exclusion chromatography coupled with static light scattering and refractive index detection was applied to determine the absolute molecular weight and molecular weight distribution of PET samples, enabling accurate grade assessment beyond intrinsic viscosity measurements.
Keywords: Polyethylene terephthalate (PET), Absolute molecular weight, Molecular weight distribution, Polymer grade assessment, Size-exclusion chromatography (SEC)
| Product | BeSEC |
| Industry | |
| Sample | Polyethylene terephthalate (PET) |
| Measurement Type | Absolute molecular weight and molecular weight distribution |
| Measurement Technology |
Size-Exclusion Chromatography (SEC), Static Light Scattering
|
Introduction
Polyethylene terephthalate (PET) is a versatile polyester widely used in fibers, films, bottles, and engineering materials. PET grades differ primarily by molecular weight.
Textile grade PET has a lower molecular weight, with intrinsic viscosity (IV) in the range of 0.64 to 0.68 dL/g, corresponding to approximately 20-30 kDa.
Bottle or chip grade PET has a higher molecular weight, with intrinsic viscosity (IV) between 0.7 and 1.0 dL/g and weight average molecular weight (Mw) typically 30 to 60 kDa or higher.
Molecular weight directly impacts both mechanical strength and processing behavior. While intrinsic viscosity provides an average value, it does not reveal the full molecular weight distribution. Combining Size Exclusion Chromatography (SEC) with light scattering detection enables direct measurement of absolute molecular weight and detailed distribution analysis, critical for process control and product optimization.
Experimental Section
-
Detectors: Light Scattering (LS) + Refractive Index (RI)
-
Column: Shodex GPC KF-806M
-
Mobile phase: Hexafluoroisopropanol (HFIP)
-
Flow rate: 0.7 mL/min
-
Injection volume: 100 μL
-
Column temperature: 40 ℃
-
dn/dc: 0.296 mL/g
Results and Discussion
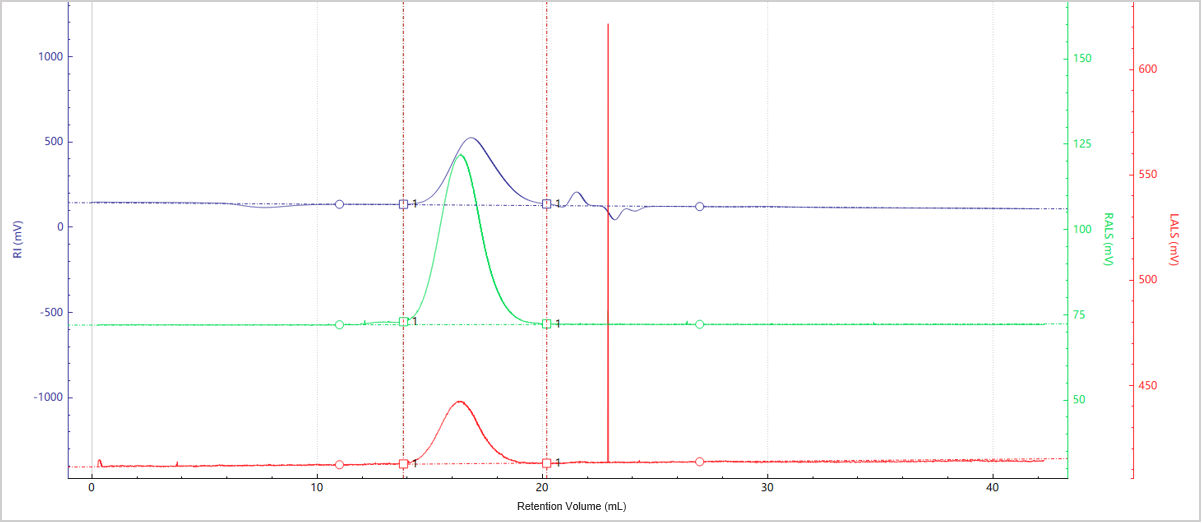
Figure 1. Elution profiles of the multi-detector signals for Sample A
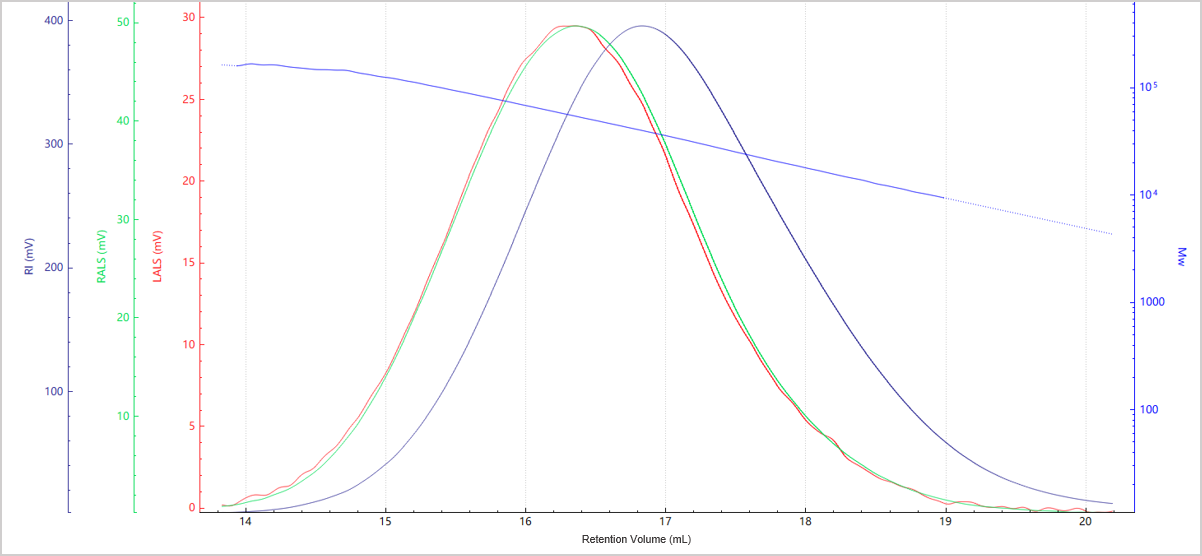
Figure 2. Elution profile of the molecular weight for Sample A
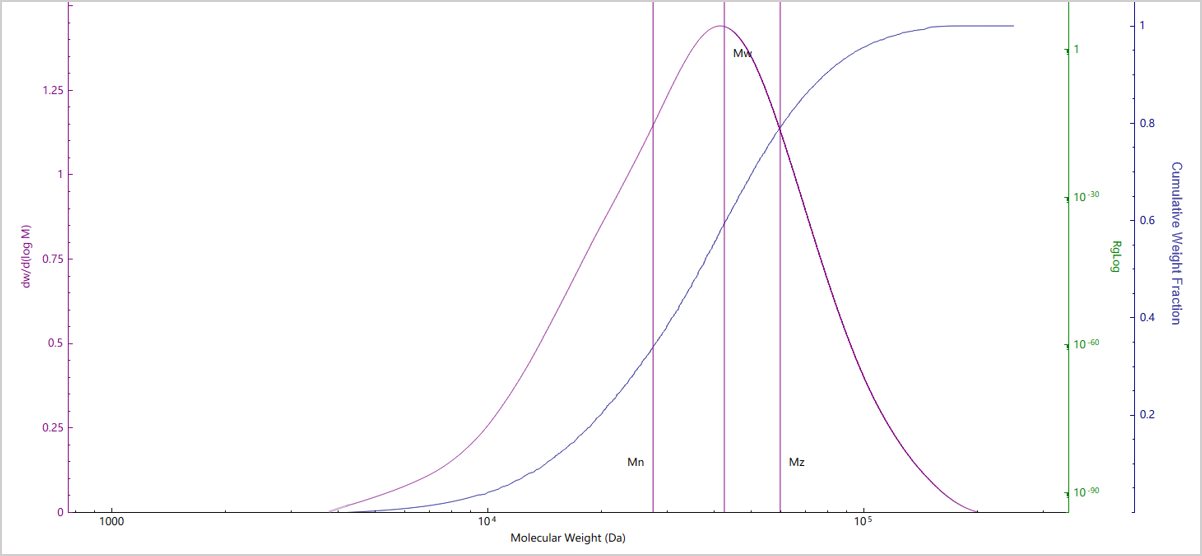
Figure 3. Molecular weight distribution of Sample A
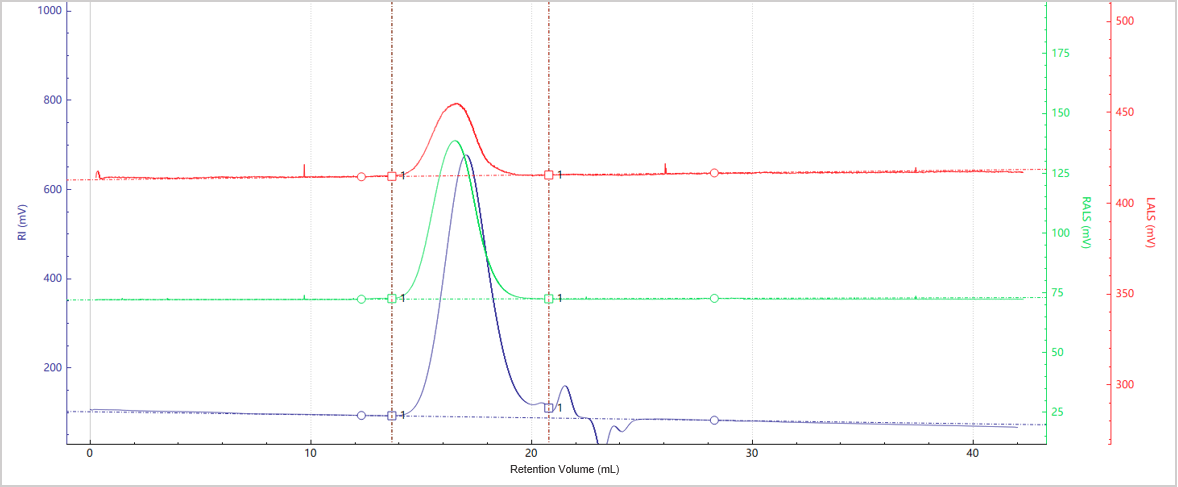
Figure 4. Elution profiles of the multi-detector signals for Sample B
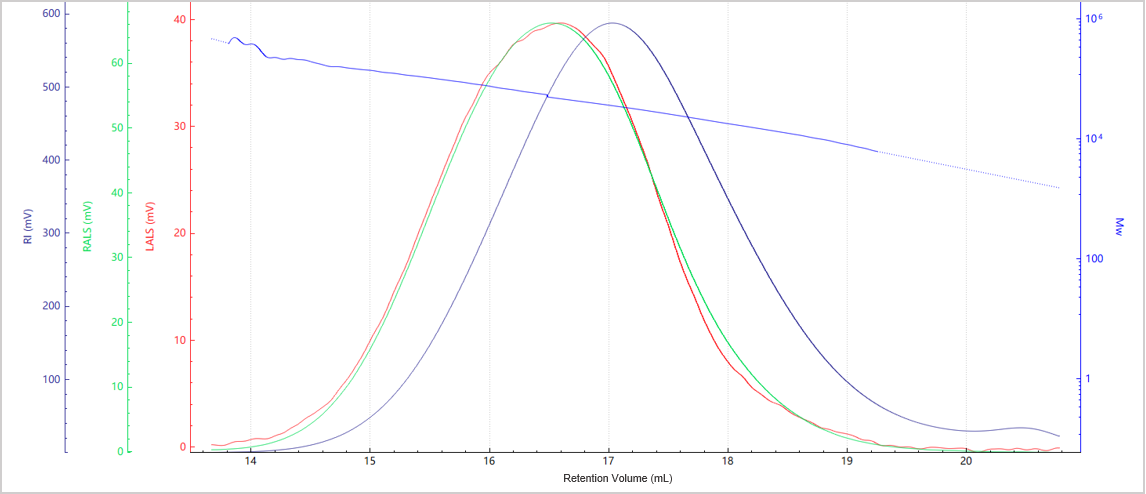
Figure 5. Elution profile of the molecular weight for Sample B
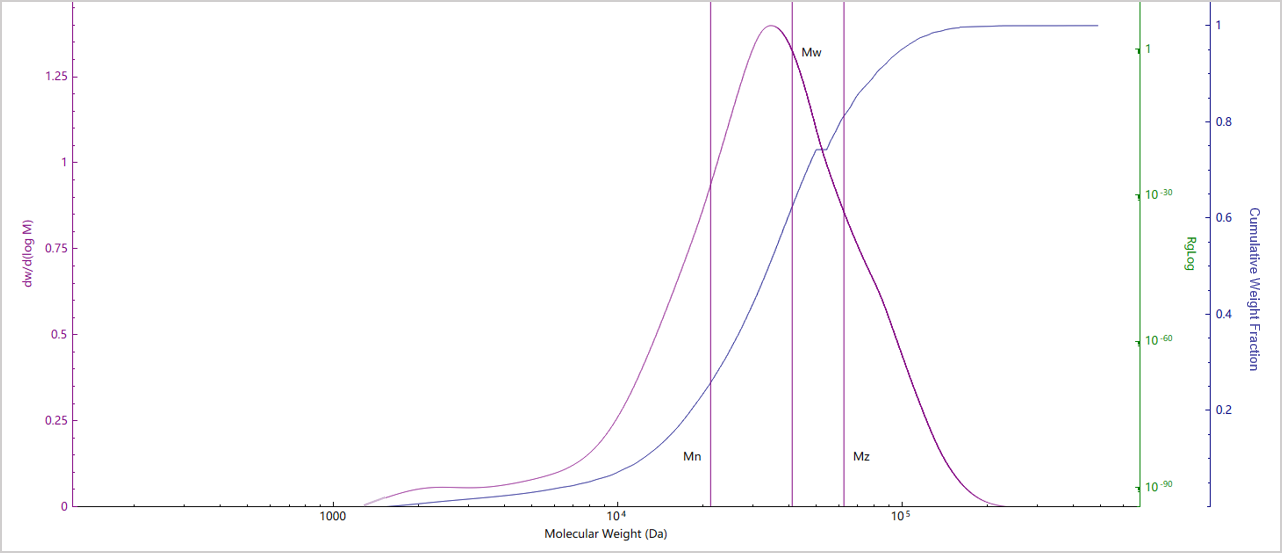
Figure 6. Molecular weight distribution of Sample B
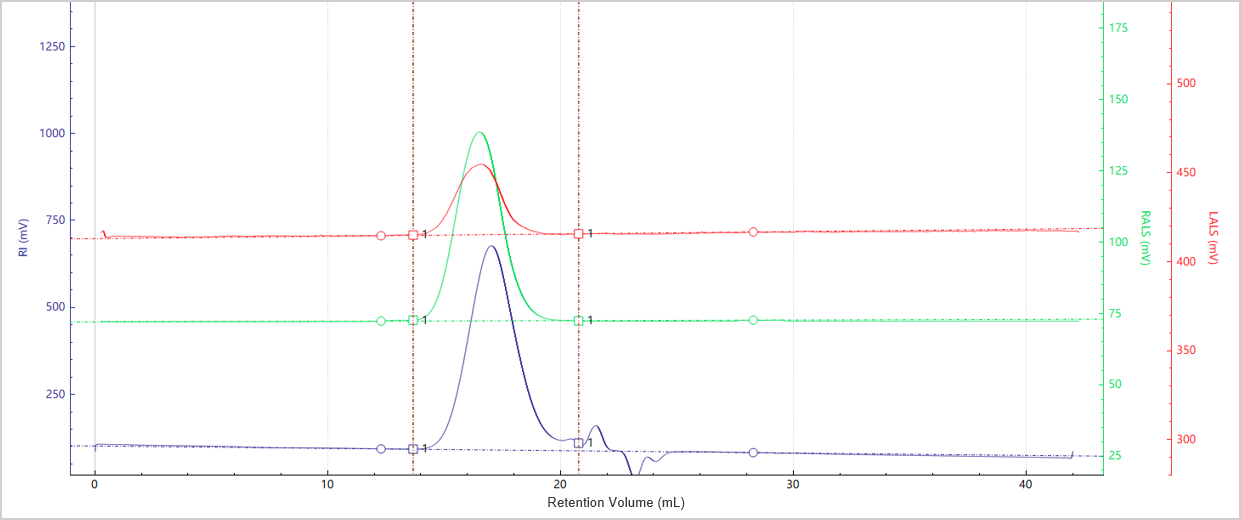
Figure 7. Elution profiles of the multi-detector signals for Sample C
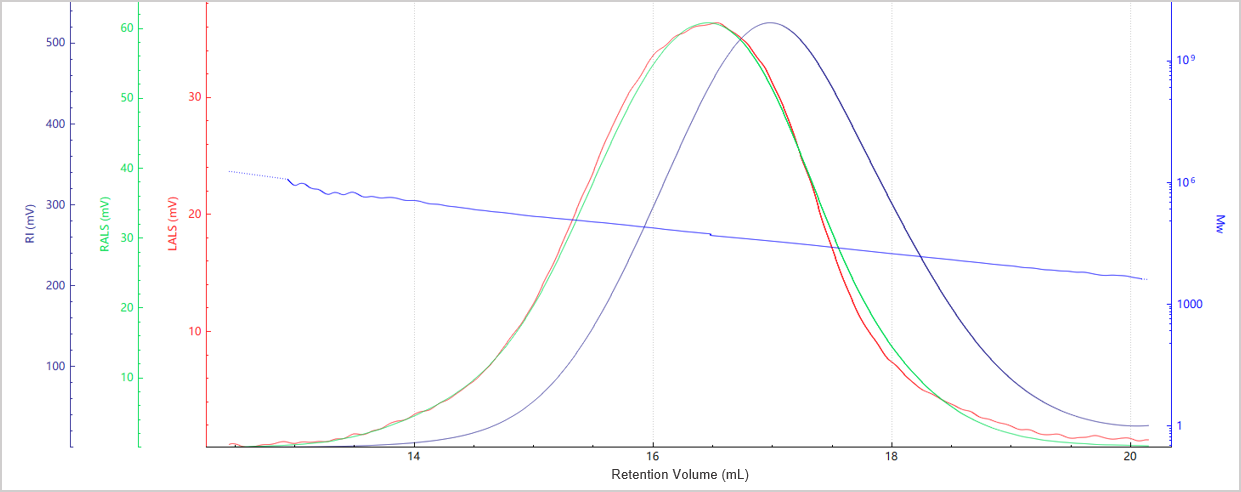
Figure 8. Elution profile of the molecular weight for Sample C
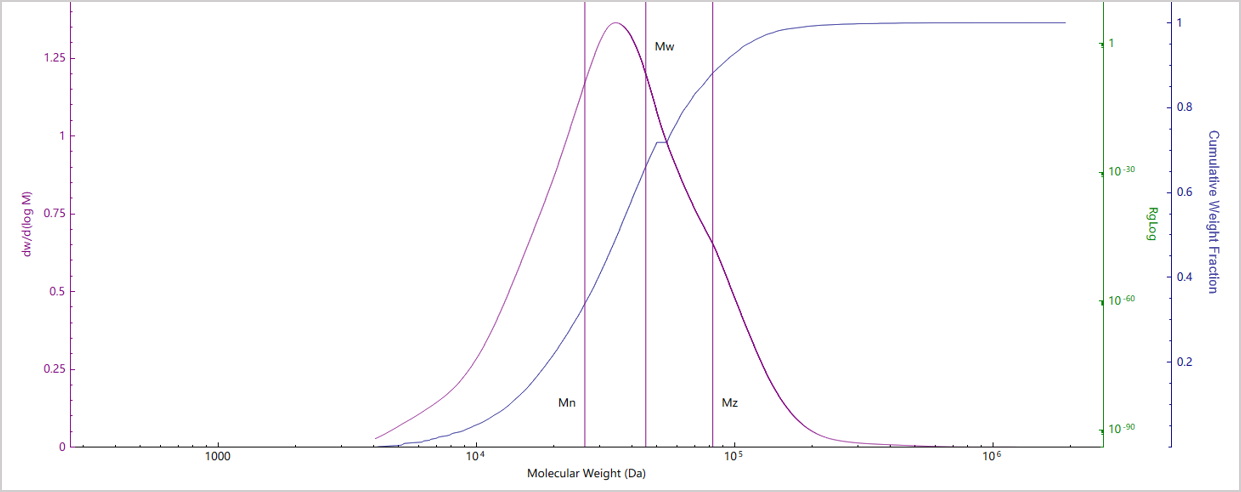
Figure 9. Molecular weight distribution of Sample C
| No. | Mn (Da) | Mw (Da) | Mz (Da) | Mw/Mn |
| Sample A | 27,594 | 42,463 | 59,631 | 1.53 |
| Sample B | 21,274 | 41,191 | 62,620 | 1.93 |
| Sample C | 26,112 | 42,411 | 68,615 | 1.62 |
Conclusion
About the Authors
 |
Zhibin Guo |
BeSECAdvanced Light Scattering Detector
|
 |
LOGIN TO ACCESS EXCLUSIVE CONTENT
More Resources Including
- Application Notes & Collections
- Webinars & Workshops
- Presentations & Videos
- Monthly Newsletters
- Exclusive Events...

Recommended articles
Rate this article