A Practical Workflow for Sediment Grain-Size Analysis with Laser Diffraction and Sieving
2026-03-12Application Note
Abstract: Wide-range sediment particle size distributions (PSDs) require combined analytical techniques to adequately cover gravel to clay fractions. Sieving provides mass-based characterization of coarse particles, while laser diffraction offers high-resolution measurement of fines. However, differences in reporting bases complicate dataset integration. This study presents a practical workflow for combined sieve and laser diffraction analysis with software-embedded data integration to simplify full-range PSD analysis while maintaining mass consistency and reproducibility.
Keywords: Sediment particle size distribution, sieve, laser diffraction, textural composition, sorting, skewness, kurtosis
1. Introduction
Sediment particle size distributions (PSDs) often span a wide size range, making it difficult for a single technique to provide adequate coverage, resolution, and efficiency. While relatively uniform materials such as clean gravel or clay can be analyzed using one method alone, heterogeneous sediments containing gravel, sand, silt, and clay require a combined analytical approach to obtain the entire size distribution. International standards such as ISO 17892-4:2016 permit PSD determination by sieving, sedimentation, or a combination of methods[1]. However, traditional sedimentation procedures are time-consuming and operator-dependent, and merging datasets from different techniques can be labor-intensive and error-prone [2].
Laser diffraction has therefore become widely adopted for fine particles due to its speed and high resolution, while sieving remains robust and physically transparent for the coarse fraction. A key challenge lies in the different measurement bases: sieving reports mass-based size fractions defined by minimum dimension, whereas laser diffraction provides volume-based equivalent spherical diameters. Obtaining a consistent full-range PSD thus requires careful data transformation and mass-controlled integration.
This article presents a practical and reproducible workflow for combining sieving and laser diffraction to generate full-range PSDs of broadly distributed sediments using the Bettersizer 2600 Plus with a sizing range of 0.02-3500 μm. Coarse particles (> 1 mm) are characterized by sieving, and fine fractions (< 1 mm) by laser diffraction. The integrated data-merging function within the software streamlines volume-to-mass conversion, cutoff management, and dataset alignment,enabling efficient and consistent full PSD analysis.

Measurement and Analysis Workflow
The workflow adopted in this study reflects widely used laboratory practice for combined sieving and laser diffraction analysis of wide-range sediments, as shown in Figure 1. 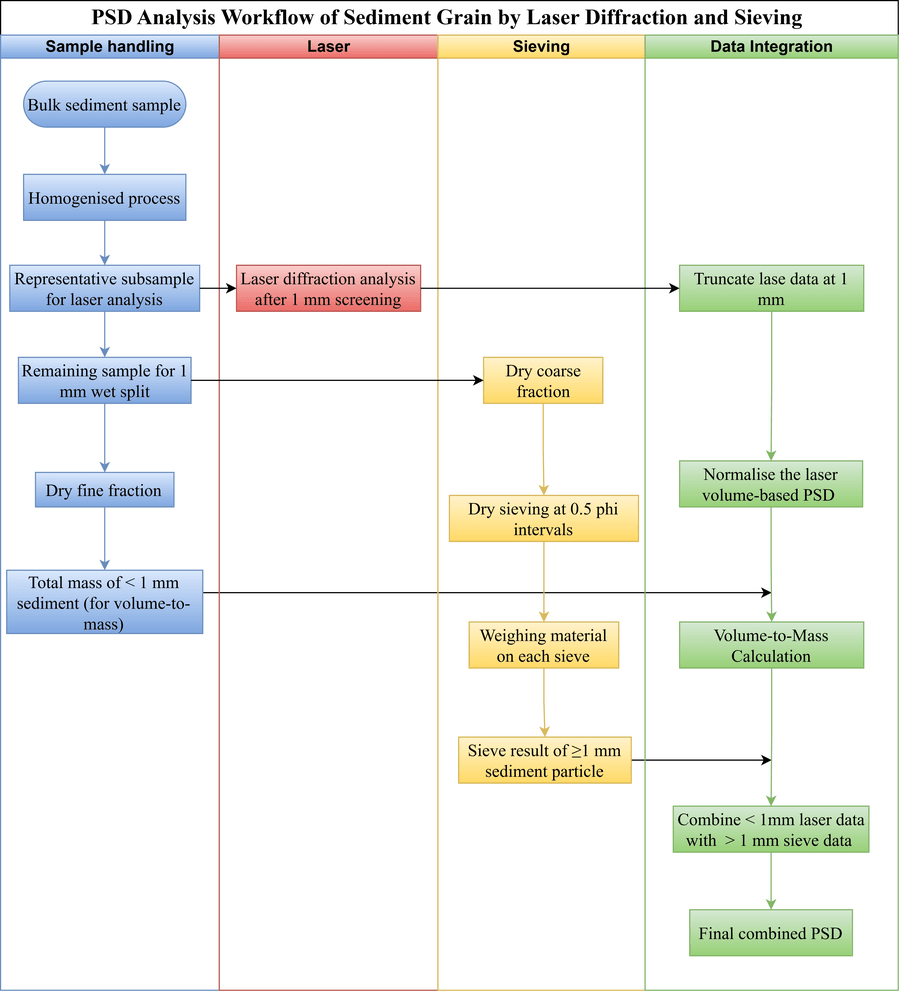
Figure 1. Integrated workflow for combined sieve and laser diffraction grain-size analysis
1.1 Sample handling
After thorough homogenization, the bulk sediment is separated using a cutoff of 1 mm. A representative subsample (typically a few grams) is removed for laser
diffraction analysis. The remaining sample is wet-split at 1 mm by gentle washing: the <1 mm fraction is collected, oven-dried, and weighed to determine the total fine-fraction mass, while the >1 mm fraction is retained for dry sieving. The total mass passing the 1 mm sieve provides the mass constraint used for subsequent data integration.
Note: During dry sieving of the >1 mm fraction in sieve path, a small amount of fine material may pass into the pan. To maintain mass balance, this pan fraction should be included in the total <1 mm mass.
1.2 Laser Diffraction Path
The fine fraction (<1 mm) is characterized by laser diffraction. In this application note, a Bettersizer 2600 Plus is used to measure the fine sediment, providing a high-resolution particle size distribution in terms of equivalent spherical diameter, typically exported as volume percentages.
1.3 Sieve Path
The coarse fraction (>1 mm) is characterized by standard dry sieve stacking in accordance with ISO 17892-4, using geometrically spaced sieve apertures at 0.5 φ intervals. In this study, sieve sizes included 1, 1.4, 2, 2.8, 4, 5.6, 8, 11.2, and 16 mm. The mass retained on each sieve was recorded to obtain the mass-based size distribution of the coarse fraction.
1.4 Data Integration
Rather than treating data merging as an external post-processing step, the industry-accepted workflow is embedded directly into the software logic. As shown in
Figure 2, the cutoff size (1 mm) is defined as the merging point between sieve and laser datasets. The user inputs the mass retained in each coarse sieve interval (≥1 mm), while the software determines the total <1 mm mass on the mass balance.
The software then performs internal normalization, volume-to-mass conversion of the laser data, and mass-constrained merging to generate the final full-range PSD. The integrated output includes the combined PSD table and derived statistical parameters such as mean size, sorting, skewness, and kurtosis.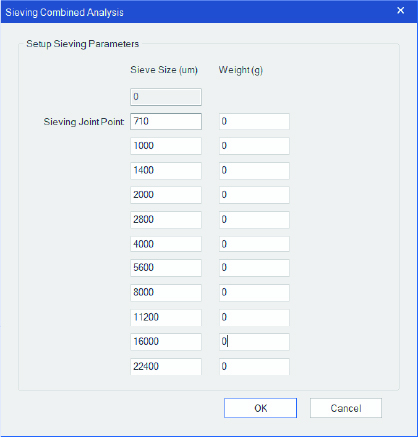
Figure 2. Software interface for sieve-laser data integration.
Result and Discussion
The two samples were analyzed using dry sieving to produce a mass-based distribution and laser diffraction to provide a high-resolution volume-based PSD. The sieving result and total mass of <1 mm fraction is displayed in Table 1. The Figure 3 shows the laser diffraction curve and table presents with good repeatability and consistent distribution profiles across 6 replicates.
Table 1. Sieve results for two sediment samples.
| Diameter (mm) | Sample State | |
| Sample 1 | Sample 2 | |
| 16 | 4.38 | 0.43 |
| 11.2 | 13.23 | 9.46 |
| 8 | 17.09 | 23.19 |
| 5.6 | 22.93 | 19.72 |
| 4 | 21.37 | 11.58 |
| 2.8 | 25.46 | 7.74 |
| 2 | 27.11 | 7.38 |
| 1.4 | 30.37 | 9.69 |
| 1 | 31.08 | 1.93 |
| Dried sieve <1 mm | 24.92 | 5.47 |
| Dry < 1 mm | 132.10 | 37.50 |
| Total < 1 mm | 157.02 | 43.07 |
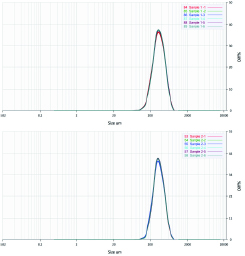
Figure 3. The PSD curve of laser diffraction results of two samples.
Using the embedded integration module, the sieve and laser datasets were merged under mass conservation constraints (Figure 4). The integrated analysis generated a full-range grain-size distribution spanning from 0.02 μm to 16 mm, with a smooth transition across the 1 mm cutoff and no artificial discontinuities.
In the exported report, key sediment descriptors can be obtained directly from the reports:
1.Full-range PSD curves
The software outputs both differential and cumulative PSDs together with the merged data table for detailed review.
2.Textural composition (Gravel–Sand–Mud)
Based on standard sediment classification boundaries (Gravel > 2 mm; Sand = 63 μm–2 mm; Mud < 63 μm), the gravel, sand, and mud fractions are calculated
automatically for use in ternary plots. In this study, Sample 1 is classified as gravelly sand with 0% mud, 70.16% sand, and 29.84% gravel, whereas Sample 2 is sandy gravel with 0% mud, 46.23% sand, and 53.77% gravel.
3.Phi-scale descriptive parameters
The software converts the merged PSD to the phi (φ) scale and reports standard grain-size statistics, including mean size, sorting, skewness, and kurtosis. In this study, the sorting value of Sample 1 is 1.752, while Sample 2 shows a slightly higher value of 1.89, indicating that Sample 2 is more poorly sorted and exhibits a broader grain-size distribution. Both samples fall within the poorly sorted category, which is typical for sediments containing mixed gravel-sand fractions.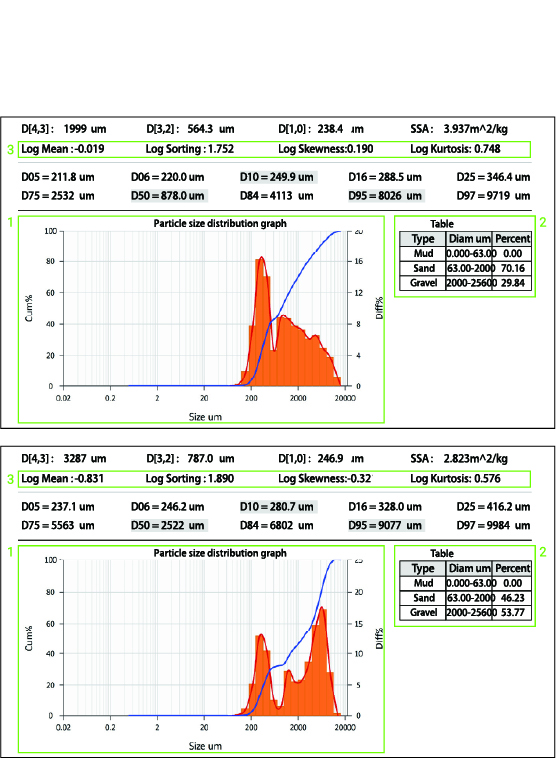
Figure 4. Full-range PSD results after software-assisted merging of sieve (>1 mm) and laser diffraction (<1 mm)
datasets for two sediment samples. Sample 1 is shown on the top and Sample 2 on the bottom.
Conclusion
This application note presents a practical workflow for full-range sediment particle size analysis by combining sieving (>1 mm) and laser diffraction (<1 mm), enabling complete coverage from coarse to fine fractions. By embedding an established data integration workflow into the software logic, coarse and fine datasets can be automatically merged without relying on external spreadsheet calculations. The software’s built-in cutoff management, volume-to-mass conversion, and integrated reporting functions allow efficient generation of continuous full-range PSD results together with statistical parameters and gravel-sand-mud fractions. In addition, the report editing function supports customization according to industry-specific requirements and flexible output formats, meeting the needs of different application scenarios, including standardized reporting within regulatory or monitoring frameworks.
Reference
[1] ISO 17892-4:2016. Geotechnical investigation and testing - Laboratory testing of soil - Part 4:Determination of particle size distribution.
[2] Liu, P., Sediment Grain-Size Analysis Methods.
Recommended articles
Rate this article