Exploring Size and Shape on Soils and Sediments of the Moon, the Earth and the Ocean
2022-04-13Application Note
Soil and sediment analysis is essential for human beings, which provides fingerprints to their origin. The main categories of soil and sediment analysis include hydrology and geology studies. Particle size and shape are challenging in soil and sediment analysis. Why? Soil samples are polymorphic and always cover a wide size distribution range. The Bettersizer S3 Plus analyzes the particle size over a wide range from 0.01 μm to 3.5 mm, fully meeting the needs of soil and sediment size measurements. This application note will focus on three different applications covering lunar regolith, desert, and marine sediments and explore the differences of particle size and shapes in three samples.
| Product | Bettersizer S3 Plus |
| Industry | Environmental Analysis |
| Sample | Lunar regolith, Marine Sediments, Desert and standard sand |
| Measurement Type | Particle Size Particle Shape |
| Measurement Technology | Laser Diffraction Dynamic Image Analysis |
Jump to a section:
- Introduction
- Measurements
- Marine sediments
- Lunar regolith
- Desert and standard sand
- Conclusion
- Reference
Introduction
Soil from different terrains has various characteristics, providing fingerprints to their origin. According to the International Union of Soil Science (IUSS) standard, the soil category can be classified as clay, silt, fine sand, coarse grain, and gravel. Another standard system by the United States Department of Agriculture (USDA) classified the sand into eight classes, as shown in Figure 1 [1].
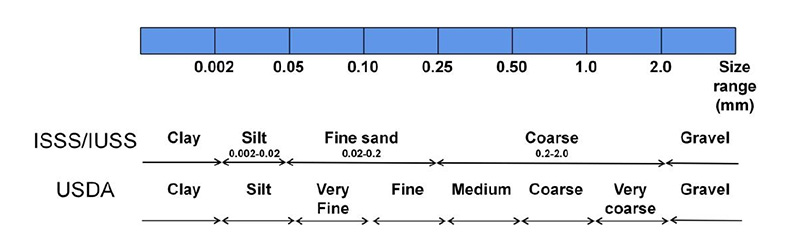
Figure 1. Classification of soil in different systems
The main categories of soil and sediment analysis include hydrology and geology studies. In hydrology studies, the analysis of sediments provides important information for plate tectonics and environmental watershed sustainability. In geology studies, soil samples are studied to detect pollution and climate change.
Hydrology
River mark changes due to variations in particle size. Sampling at the same site in different years is necessary to monitor particle size fluctuations and assess the risk of flooding.
Analysis of marine sediments is challenging because the largest particles are likely to be more than a centimeter, while the smallest particles are only a few micrometers in size. Sieving has limited sensitivity to fine particles, and laser diffraction has the same problem on coarse particles.
A solution to this problem is to combine the sieving method and the laser diffraction method, where sieving removes the millimeter particles, and laser diffraction measures the minus-mesh particles.
Geology
The analysis of soils is significant as the soil can influence the lives of human beings. Soil status is closely related to agriculture, construction, and the environment. In addition, soils and sediments are closely related to ecology. To explore the role of soil in ecology,scientists analyze all physical, chemical, and biological aspects of the soil. A comprehensive analysis of the soil would include particle size, shape, density, organic compounds, fossil, elemental analysis, etc.
When analyzing the physical properties of soils and sediments, particle size and shape are the prime parameters to measure. Soil samples are polymorphic and always cover a wide size distribution range. The Bettersizer S3 Series analyzes the particle size over a wide range from 0.01 μm to 3.5 mm, fully covering all classes from clay to gravel. Additionally, the Bettersizer S3 Series combines two techniques in one instrument, performing both laser diffraction and dynamic image analyses. As a result, the particle size and shape of the soil sample can be analyzed in one measurement. The Bettersizer S3 Series is used in many universities and laboratories to measure soils and sediments. The paper lists three different applications covering lunar regolith, desert, and marine sediments.
Measurements
1. Lunar regolith [2]
The first sample is a lunar regolith (LR) returned from the moon by the Chang’E-5 (CE-5) mission. The sample was obtained by Qian Xuesen Laboratory of Space Technology, China Academy of Space Technology (CAST). In history, the first lunar sample was gathered in 1976, and only the Soviet Union and the United States had collected lunar samples in the 20th century. In 2020, CE-5 took 1,731 g of Lunar samples back to earth. Figure 2 shows the sampling site of CE-5. The Qian Xuesen Laboratory was the first group of laboratories authorized to analyze the lunar regolith.
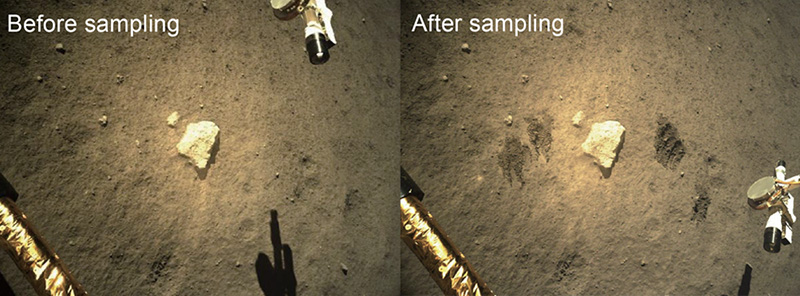
Figure 2. Chang’E-5 on-site image for before and after sampling
The Bettersizer S3 Plus was used to provide both particle shape analysis and particle size measurement. According to the map of single-particle images in Figure 3, the soil consists of very tiny particles as well as coarse particles. In total, the 120,597 particles analyzed have a particle size distribution between 15.0 and 438.2 µm. The average circularity of particles is 0.875, and only 10% of particles have circularity smaller than 0.805. In this case, the lunar regolith at the CE-5 sampling site is regular in shape. Just as the many different terrains on earth fall into different categories, the same is true for different lunar terrains. The Bettersizer S3 Plus helps scientists to gain a deeper insight on soil samples, and shed light on the history and the evolution of the moon and the earth itself.
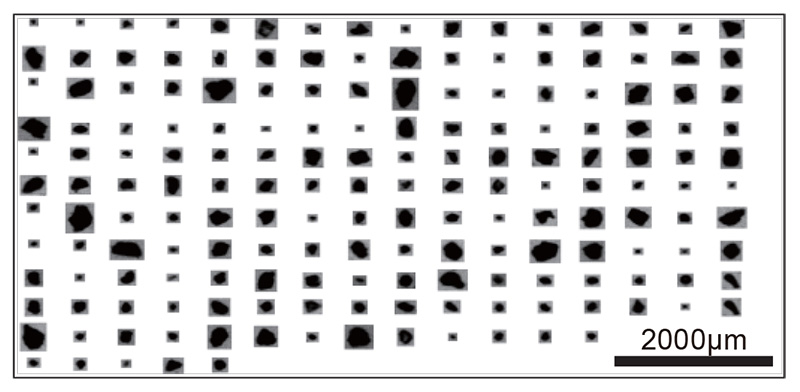
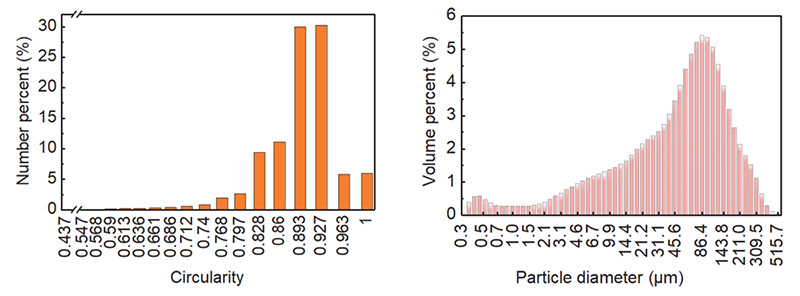
Figure 3. Single-particle images, circularity, and particle size distribution
2. Marine sediments
The marine sediment samples are from the National Marine Environmental Monitoring Center with three different size distributions. The Bettersizer S3 performed the measurements at the Bettersize laboratory. As shown in Figure 4, the particles sizes of three samples increase from top to bottom.
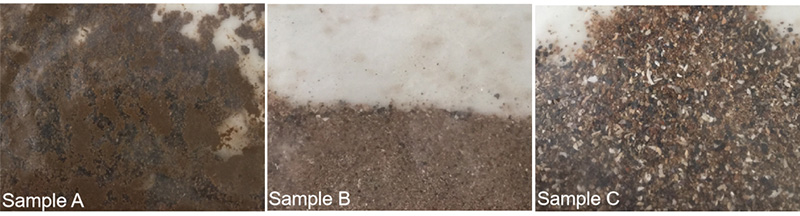
Figure 4. Marine sediment samples
Table 1. Bettersizer S3 size results on three samples
|
Sample Name |
D10 (μm) |
D50 (μm) |
D90 (μm) |
D97 (μm) |
|
Sample A |
60 |
185 |
500 |
700 |
|
Sample B |
160 |
292 |
997 |
1412 |
|
Sample C |
224 |
762 |
1531 |
1785 |
The particle size values are listed in Table 1, which indicates that all three samples cover a wide distribution range. Sample A has the smallest particle size distribution of the three samples, where there is a span of more than 400 μm between D10 and D90 values. Compared to sample C, sample A and sample B have closer particle size values. Sample B contains extremely coarse particles, which heavily influence the volume-based particle size distribution. By image analysis in Figure 5, single-particle images are displayed, and it is evident that the particle size of sample A is relatively uniform, while sample B has oversized particles in it.
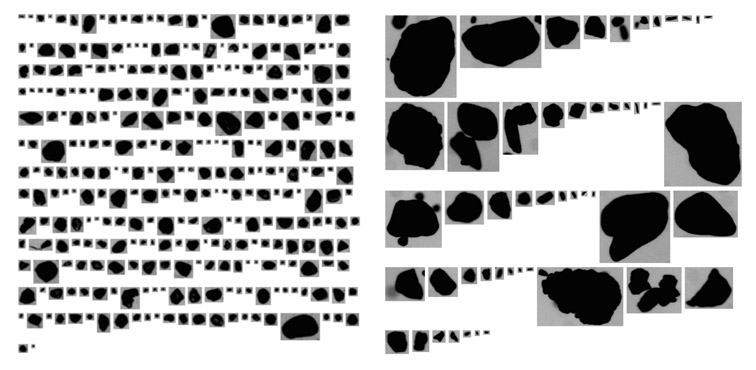
Figure 5. Image analysis of sample A (top) and sample B (bottom)
According to the graph of sample B in Figure 6, at least two peaks appeared, indicating different particle size groups. The Bettersizer S3 Series has a high resolution in distinguishing different particle size groups. The measurement used the combined test because the image measurement has high accuracy for the coarse range and the laser diffraction excels at the fine and middle ranges.
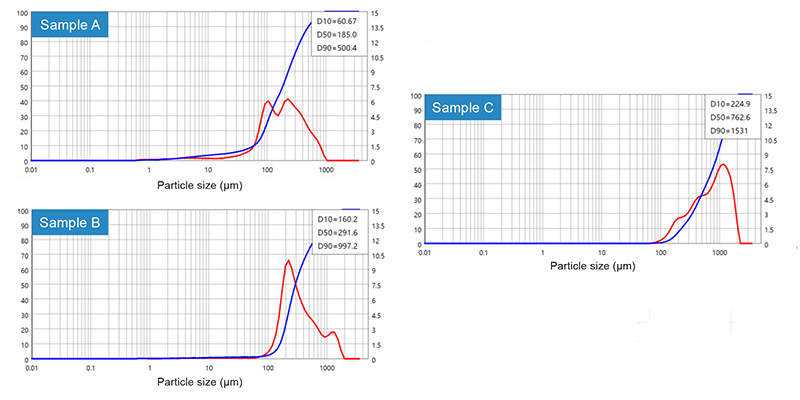
Figure 6. Particle size distributions of the three samples
3. Desert and standard sand [3]
The Federal Institute for Geosciences in Hannover designed an experiment to compare desert sand and standard sand, to analyze if desert sand can replace standard sand used in the construction industry. All three measurement modes are used: laser diffraction, dynamic image analysis, and a combination method of laser diffraction and dynamic image analysis. From Figure 7, it can be seen that dynamic image analysis and combined analysis show a similar particle size distribution graph for the standard sand sample.
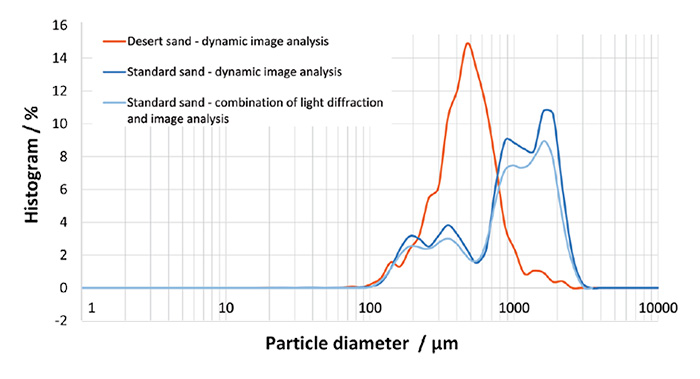
Figure 7. Particle size distributions of desert and standard sand
The standard sand sample contains many coarse particles, which the desert sand sample lacks. As shown in Table 2, the desert sand has a similar D10 value to standard sand, about 220 μm. However, the D90 values of standard sand and desert sand are about 1800 μm and 740 μm respectively.
Table 2. Typical percentage values for the particle size distribution
|
Sample |
D3 |
D6 |
D10 |
D16 |
D25 |
D50 |
D75 |
D84 |
D90 |
D99 |
|
Desert sand-dynamic image analysis |
145.9 |
185.5 |
223.1 |
263.1 |
316.8 |
433.6 |
575.9 |
656.9 |
740.8 |
1544 |
|
Standard sand-dynamic image analysis |
150.9 |
177.7 |
216.8 |
298.6 |
461.4 |
958.9 |
1476 |
1678 |
1828 |
2422 |
|
Standard sand -a combination of light diffraction and image analysis |
150.3 |
177.8 |
217.4 |
295 |
457.5 |
943.9 |
1434 |
1631 |
1781 |
2341 |
Table 3. Typical individual particles shape parameters
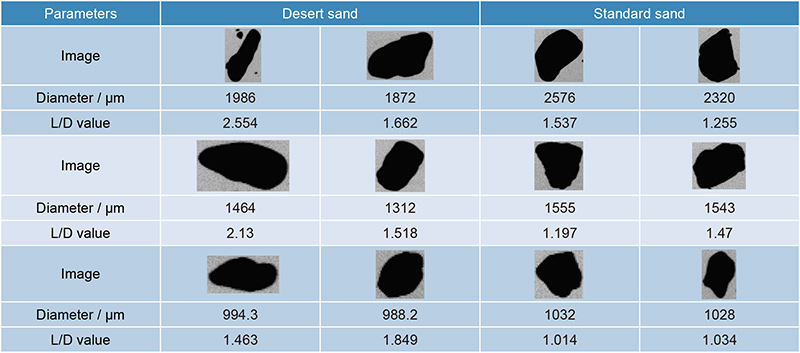
Except for the differences in size that laser differentiation displayed, there are significant differences in shape. According to the dynamic image analysis in Table 3, the equivalent diameter of desert sand is smaller than standard sand. The big difference between them is the L/D value. According to Figure 8, the standard sand has an average L/D value close to 1, but the L/D value of the desert sand fluctuates at higher values than that.
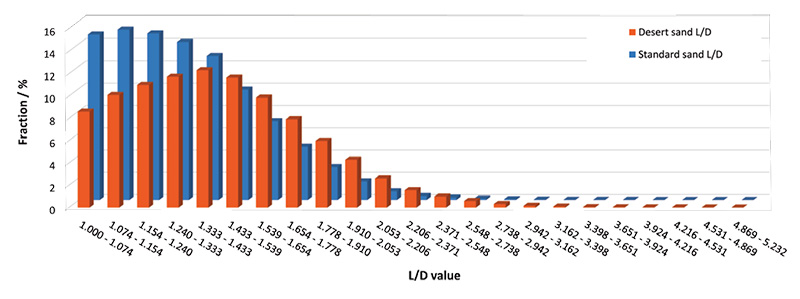
Figure 8. L/D value distribution of desert sand and standard sand
The desert sand cannot be applied as a construction material because of the lack of middle and large particles. But if medium and coarse sands can be added to the desert sand in the correct proportion, desert sand could be used as a replacement for building material.
Conclusion
The most significant challenge of soil and sediment measurements is accurately measuring the wide distributed samples. The Bettersizer S3 Series has a dynamic image analysis system and a laser diffraction system, ideally suited for measuring wide size distribution samples like soils. The Bettersizer S3 Series provides reliable particle size and shape results to fit customer requirements.
References
[1] Madhan Mohan.M and Prabhu Prasadini. 2019. Manual on Practical soil physics. Regional Agricultural Research Station, Pp 72.
[2] H. Zhang, X. Zhang, G. Zhang, K. Dong, X. Deng, X. Gao, Y. Yang, Y. Xiao, X. Bai, K. Liang, Y. Liu, W. Ma, S. Zhao, C. Zhang, X. Zhang, J. Song, W. Yao, H. Chen, W. Wang, Z. Zou, and M. Yang (2022), Size, shape, and composition of lunar samples returned by Chang’E-5 mission, Sci. China- Phys. Mech. Astron. 65, 000000.
[3] Suitability of desert or recycling sands as raw material for concrete production. 3P Instrument. https://www.bgr.bund.de/DE/Gemeinsames/Nachrichten/Aktuelles/2019/2019-08-06_wuestensand.html
About the Author
 |
Xiurong Qiu Application Engineer @ Bettersize Instruments |
LOGIN TO ACCESS EXCLUSIVE CONTENT
More Resources Including
- Application Notes & Collections
- Webinars & Workshops
- Presentations & Videos
- Monthly Newsletters
- Exclusive Events...

Recommended articles
Rate this article