
Exploring the Resolution Ability of the Nanoptic 90 Plus
2020-10-10Application Briefs
Introduction
Dynamic light scattering, also known as photon correlation spectroscopy, measures the fluctuations of the scattering intensity of the sample in a suitable liquid medium, and obtain the diffusion coefficient D of the particles moving at different velocities (dependent on their size) under the effect of Brownian motion. The diffusion coefficient can be converted into the particle size, i.e. the hydrodynamic diameter DH, by the Stokes-Einstein equation.

Where kB is the Boltzmann constant, T is the temperature, and η is the dispersant viscosity.
The particle size distribution of dynamic light scattering is achieved by different algorithms, including CONTIN and Non-Negative Least Squares (NNLS). The decay rate ΓI matrix obtained by the particle sizes DH(i) is fitted to the correlation function to provide the relative intensity of each particle size fraction. In terms of the algorithm resolution for particle size distribution, the NNLS is preferable to the CONTIN or Cumulants methods.
It should be noted that dynamic light scattering is not as high a high-resolution technique for particle size distribution analysis, compared to some other measurement techniques. Using the highest resolution, this technology can identify two individual peaks for two narrowly distributed components with a size difference of three or more times greater. In addition, the resolution of a dynamic light scattering instrument is also affected by numerous factors, including the accuracy of light path adjustment, the light source power, the positions of correlator channels, the number of channels, the sensitivity of the detectors and the signal-noise ratio.
As we know, the resolution of particle size distribution contradicts the result stability. In other words, higher resolution leads to lower stability to some extent. In this article, we will verify the excellent resolution ability of the Nanoptic 90 Plus, by measuring a mixture of two latex samples.
Sample Preparation
The Nanoptic 90 Plus of Bettersize Instruments Ltd. is equipped with a 671 nm solid-state laser with a power of 51mW. An optical fiber connected with an Avalanche Photodiode Detector (APD) is aligned at 90°to record the scattering intensity. And the obtained correlation function is fitted with NNLS algorithm.
A 60 nm and a 200 nm monodisperse polystyrene latex were used. The sample solid content was 1% wt.
The samples were prepared in the following steps.
1) For the 60 nm sample, 100 μL of the latex was diluted into 1.5 mL of 20 mM NaCl solution.
2) For the 200 nm sample, 7 μL of the latex was diluted into 1.5 mL of 20 mM NaCl solution.
3) For the 60 nm and 200 nm mixture: 100 μL of 60 nm and 7 μL of 200 nm polystyrene latex were mixed and diluted into 1.5 mL of 20 mM NaCl solution.
Instead of water, 20 mM NaCl was added as the diluent to suppress the double layers of particles caused by the surface charges, and thereby reducing the interaction between particles.
The measurement was carried out at 25℃ with the temperature equilibrium duration lasting 120 s. Each sample was measured at least three times to show the standard deviations.
Results and Discussions


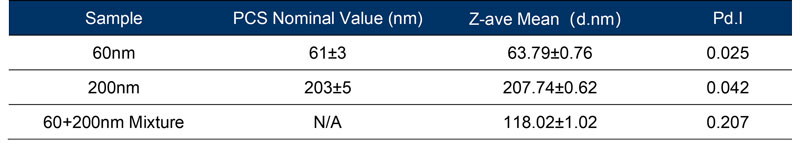
As shown intable 1, it can be concluded that Nanoptic 90 Plus has excellent repeatability for all samples. The Pd.I of 60nm and 200nm samples are less than 0.05 indicating that they are monodisperse samples, and the obtained results are all within the nominal values of polystyrene latices. The Z-average mean of the 60 nm and 200 nm latex mixture is 118.02 nm, and its Pd.I is 0.2 demonstrating that it becomes a wide-distributed sample after mixing.
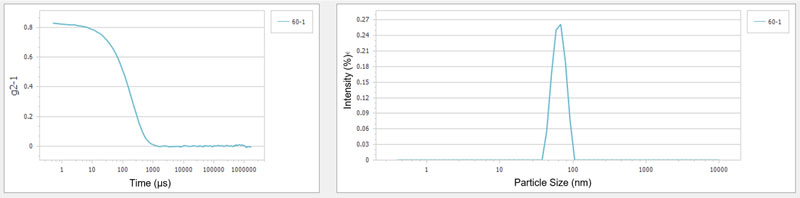
As can be seen from the size distribution of 60 nm and 200 nm mixture, NNLS is capable of distinguishing the two size peaks and providing good peak values, thereby illustrating the rationality of NNLS algorithm as well as the excellent resolution of the Nanoptic 90 Plus.
Rate this article
Share On


