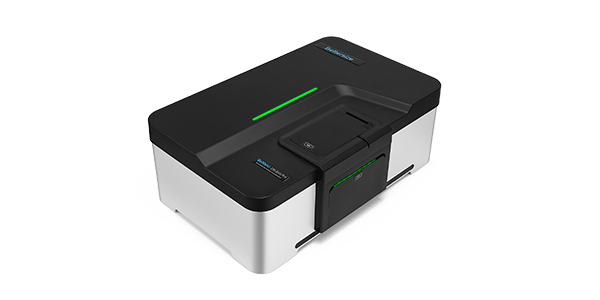
BeNano 시리즈는 Bettersize Instruments에서 개발한 나노입자 크기 및 제타 전위 분석기의 최신 모델입니다. 이 시스템은 동적 광산란 (DLS), 전기영동 광산란 (ELS), 정적 광산란 (SLS) 기술을 통합하여 입자 크기, 제타 전위, 분자량을 정확하게 측정합니다. BeNano 시리즈는 화학 공학, 제약, 식음료, 잉크 및 안료, 생명 과학 등 다양한 분야에서 학술 연구와 제조 공정에 널리 사용됩니다.
특징 및 장점
- ● 측정 범위: 0.3nm - 15μm
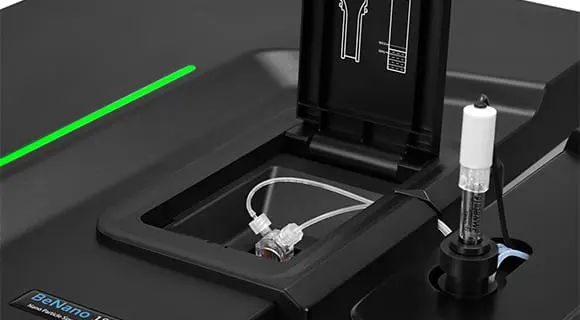
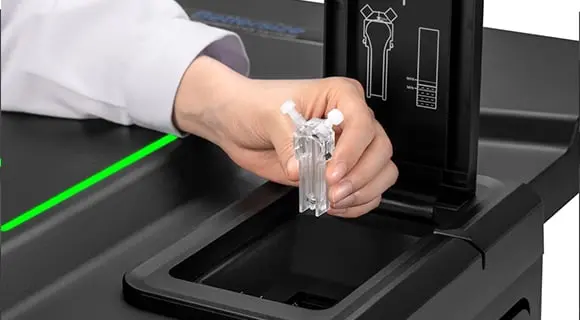
- ● 최소 샘플 3μL 로 측정 가능
- ● APD 검출기로 뛰어난 민감도로 정밀한 측정을 제공
- ● 자동으로 레이저 강도를 조정하여 최적의 측정 조건을 유지
- ● 결과 분석을 자동으로 최적화하여 정확한 평가를 지원
- ● 고정밀 입자 크기 측정을 위한 첨단 DLS 후방산란 (173°) 검출 기술
- ● 농도가 높은 샘플에 맞게 산란 부피를 조정 가능
- ● 제타 전위를 정확하게 측정할 수 있는 PALS (Phase Analysis Light Scattering) 기술
- ● 샘플 온도를 정밀하게 조절하여 측정 정확도를 높임
- ● 21 CFR Part 11, ISO 22412, ISO 13099 국제 규격을 준수하여 신뢰할 수 있는 결과를 제공
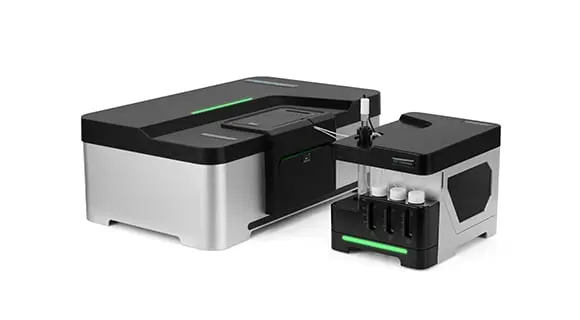

BeNano 180 Zeta Pro
BeNano 시리즈는 Bettersize Instruments에서 개발한 나노입자 크기 및 제타 전위 분석기의 최신 모델입니다. 이 시스템은 동적 광산란 (DLS), 전기영동 광산란 (ELS), 정적 광산란 (SLS) 기술을 통합하여 입자 크기, 제타 전위, 분자량을 정확하게 측정합니다. BeNano 시리즈는 화학 공학, 제약, 식음료, 잉크 및 안료, 생명 과학 등 다양한 분야에서 학술 연구와 제조 공정에 널리 사용됩니다.