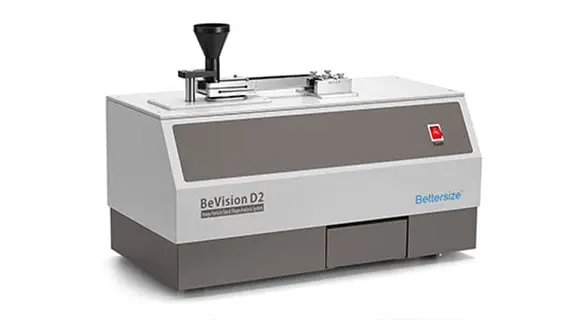
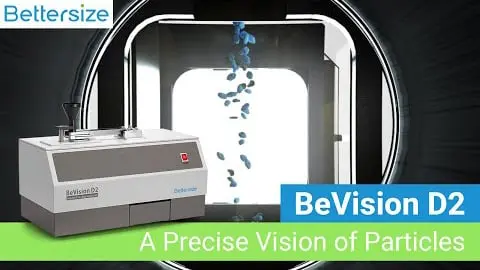
BeVision D2
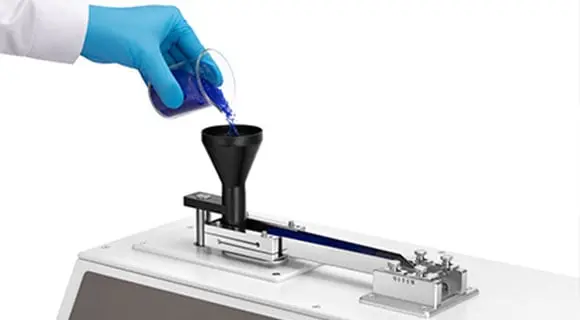
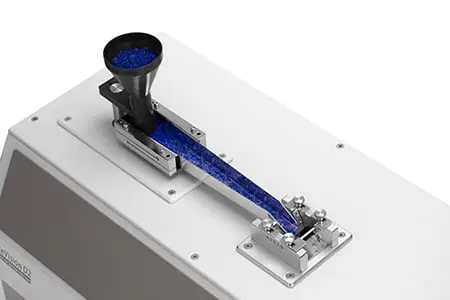
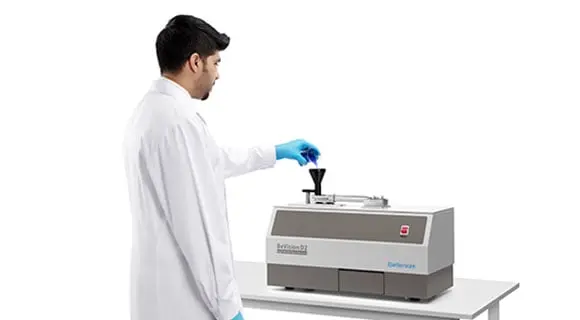
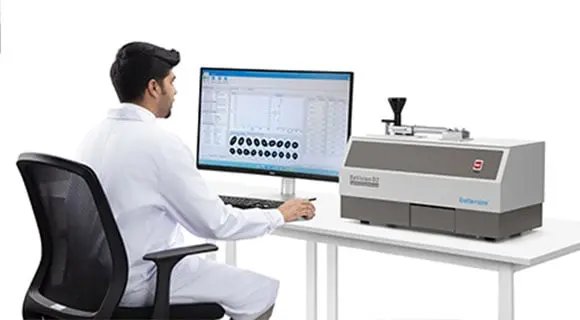
BeVision D2 - это эффективное решение для анализа размера и формы сухих порошков и гранул с высокой текучестью. Десятки тысяч частиц могут быть измерены BeVision D2 в течение трех минут. Сочетая высокоскоростную камеру с точным телецентрическим объективом, BeVision D2 способен эффективно анализировать размер и форму частиц в диапазоне 30 - 10 000 мкм.
Особенности и преимущества
- ● Диапазон измерений: 30 - 10 000 мкм
- ● 24 различных параметра размера и формы частиц
- ● Высокая пропускная способность: Измерение 10 000 частиц в течение 3 минут
- ● Выдающаяся воспроизводимость
- ● Результаты соответствуют стандарту ISO 9276-6
- ● Полностью автоматизированная работа
- ● Мощное программное обеспечение обеспечивает всестороннюю оценку
- ● Сопоставимо с результатами просеивания
Видео
How to Install and Operate BeVision D2 
BeVision D2 | A Precise Vision of Particles 
What is Image Analysis? Fundamentals of BeVision Series 
Overview of BeVision Series | Precision in Particle Vision 
Обзор
Citations
- BeVision D2
Study on the spatial and temporal distribution of the bed density in an air dense medium fluidized bed (ADMFB) based on the electrical capacitance tomography (ECT) measurement system
DOI: 10.1016/j.powtec.2021.08.026 Read ArticleChina University of Mining and Technology | 2021In this study, the ECT system was used to study the temporal and spatial distribution characteristics of bed density in an ADMFB under the influence of superficial gas velocity and static bed height. The results show that, In the axial distribution, the closer to the top of the bed at low gas velocity(<11.5 cm/s), the higher the density, and the closer to the top at high gas velocity (> 13 cm/s), the lower the density. In the radial distribution, the closer to the central axis, the lower the density. With the decrease of static bed height, the radial uniformity becomes worse. The optimal gas velocity is 12.5 cm/s, under which the bed spatial distribution is the most uniform, and the ecart probable moyen of spherical particles is 0.06. The separation density is smaller than the bed density and is close to the central axis density. - BeVision D2
Applications of machine vision in pharmaceutical technology: A review
DOI: 10.1016/j.ejps.2021.105717 Read ArticleSemmelweis University | 2021The goal of this paper is to give an introduction to analysis of images acquired by a digital camera with visible illumination and to review its applications as a Process Analytical Technology (PAT) which has great potential in pharmaceutical manufacturing. By utilizing in-line analytical techniques, it is possible to monitor the quality of all the material leaving a processing unit and to create models capable to predict product quality attributes, which are otherwise measured by cumbersome off-line techniques. The rapidly developing machine vision has proven its versatility in numerous applications and it has great potential as an in-line analytical tool. The ongoing conversion of the pharmaceutical industry from batch to continuous manufacturing accelerated the development of digital image analysis methods in the last decade. Among numerous other benefits, continuous technologies, equipped with digital image analysis, enable detecting disturbances in the material flow, and analyzing the products comprehensively. The purpose of this work is to give an insight into the currently available image analysis methods in the characterization of powders, crystallization, granulation, milling, mixing, tableting, film coating, in vitro dissolution testing, and residence time distribution measurements by highlighting some of the most relevant examples of application. - BeVision D2
Impacts of multiple anthropogenic stressors on stream macroinvertebrate community composition and functional diversity
DOI: 10.1002/ece3.6979 Read ArticleUniversity of Liverpool, Liverpool | 2020Ensuring the provision of essential ecosystem services in systems affected by multiple stressors is a key challenge for theoretical and applied ecology. Trait-based approaches have increasingly been used in multiple-stressor research in freshwaters because they potentially provide a powerful method to explore the mechanisms underlying changes in populations and communities. Individual benthic macroinvertebrate traits associated with mobility, life history, morphology, and feeding habits are often used to determine how environmental drivers structure stream communities. However, to date multiple-stressor research on stream invertebrates has focused more on taxonomic than on functional metrics. We conducted a fully crossed, 4-factor experiment in 64 stream mesocosms fed by a pristine montane stream (21 days of colonization, 21 days of manipulations) and investigated the effects of nutrient enrichment, flow velocity reduction and sedimentation on invertebrate community, taxon, functional diversity and trait variables after 2 and 3 weeks of stressor exposure. 89% of the community structure metrics, 59% of the common taxa, 50% of functional diversity metrics, and 79% of functional traits responded to at least one stressor each. Deposited fine sediment and flow velocity reduction had the strongest impacts, affecting invertebrate abundances and diversity, and their effects translated into a reduction of functional redundancy. Stressor effects often varied between sampling occasions, further complicating the prediction of multiple-stressor effects on communities. Overall, our study suggests that future research combining community, trait, and functional diversity assessments can improve our understanding of multiple-stressor effects and their interactions in running waters. - BeVision D2
Fine sediment and flow velocity impact bacterial community and functional profile more than nutrient enrichment
DOI: 10.1002/eap.2212 Read ArticleUniversity of Liverpool | 2020Freshwater ecosystems face many simultaneous pressures due to human activities. Consequently, there has been a rapid loss of freshwater biodiversity and an increase in biomonitoring programs. Our study assessed the potential of benthic stream bacterial communities as indicators of multiple-stressor impacts associated with urbanization and agricultural intensification. We conducted a fully crossed four-factor experiment in 64 flow-through mesocosms fed by a pristine montane stream (21 d of colonization, 21 d of manipulations) and investigated the effects of nutrient enrichment, flow-velocity reduction and added fine sediment after 2 and 3 weeks of stressor exposure. We used high-throughput sequencing and metabarcoding techniques (16S rRNA genes), as well as curated biological databases (METAGENassit, MetaCyc), to identify changes in bacterial relative abundances and predicted metabolic functional profile. Sediment addition and flow-velocity reduction were the most pervasive stressors. They both increased α-diversity and had strong taxon-specific effects on community composition and predicted functions. Sediment and flow velocity also interacted frequently, with 88% of all bacterial response variables showing two-way interactions and 33% showing three-way interactions including nutrient enrichment. Changes in relative abundances of common taxa were associated with shifts in dominant predicted functions, which can be extrapolated to underlaying stream-wide mechanisms such as carbon use and bacterial energy production pathways. Observed changes were largely stable over time and occurred after just 2 weeks of exposure, demonstrating that bacterial communities can be well-suited for early detection of multiple stressors. Overall, added sediment and reduced flow velocity impacted both bacterial community structure and predicted function more than nutrient enrichment. In future research and stream management, a holistic approach to studying multiple-stressor impacts should include multiple trophic levels with their functional responses, to enhance our mechanistic understanding of complex stressor effects and promote establishment of more efficient biomonitoring programs.
- 1
- 2
- 3
Курируемые ресурсы
Связанный анализатор изображений
-
BeVision S1
Classical and Versatile Static Image Analyzer
Dispersion type: Dry & Wet
Measurement range: 0.3 - 4,500 µm
Technology: Static Image Analysis
-
BeVision M1
Automated Static Image Analyzer
Dispersion type: Dry
Measurement range: 0.3 - 10,000 μm
Technology: Static Image Analysis
-
Bettersizer S3 Plus
Laser Diffraction Particle Size Analyzer
Measurement range: 0.01 - 3,500μm (Laser System)
Measurement range: 2 - 3,500μm (Image System)


