Home > Learn > Knowledge Center > Measuring the particle size distribution of Cyclosporin A with the Nanoptic 90 Plus

Measuring the particle size distribution of Cyclosporin A with the Nanoptic 90 Plus

2020-11-02Application Briefs

stick model and structural formula of Cyclosporin A
 

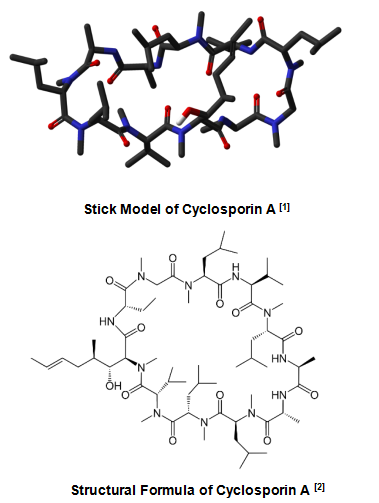
Cyclosporin A is a cyclic polypeptide composed of 11 amino acids derived from an active metabolite of fungi. It is a powerful immunosuppressive drug, now routinely used in the prevention of graft rejection, the treatment of several autoimmune diseases as well as in the treatment of some parasitic diseases. [3] Cyclosporin A is mostly oral administration, in which polypeptides mostly exist in an aggregated state. The size and distribution of the aggregates are closely related to the stability, delivery and absorption of the drug.


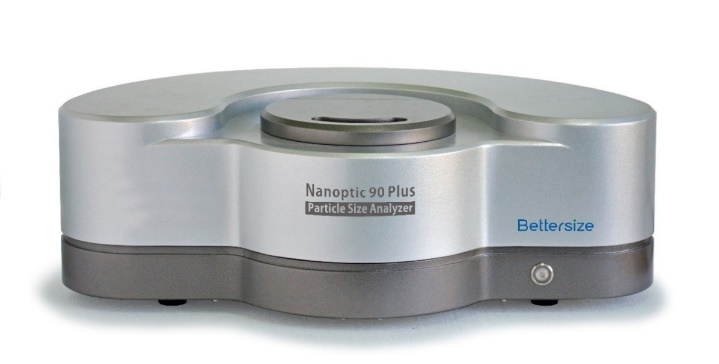
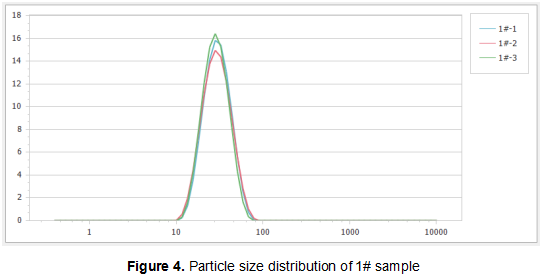
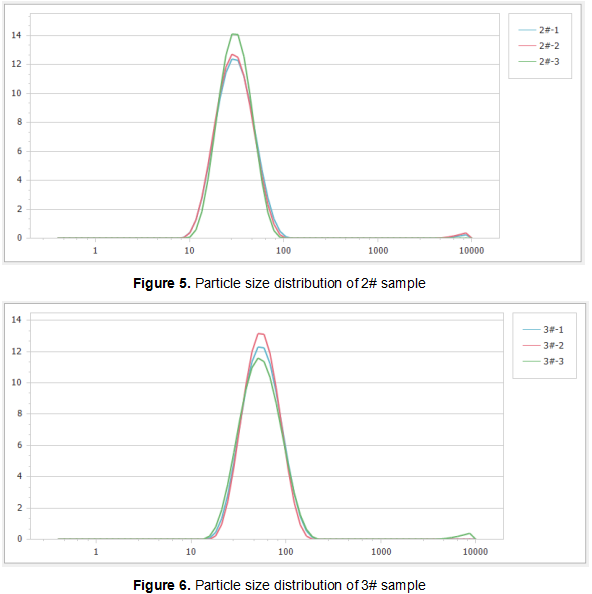
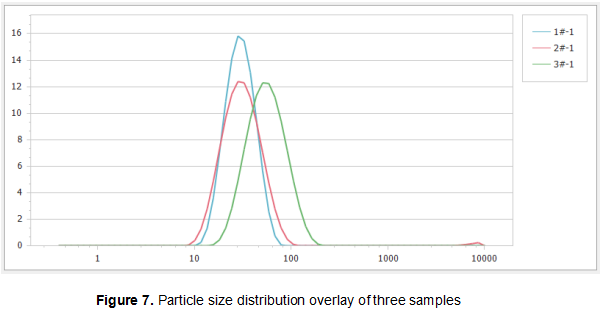
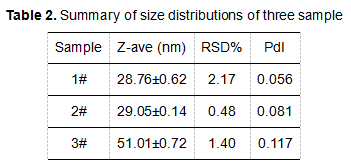
In this report, we measured the particle size distribution of three cyclosporin A samples to differentiate the size differences of them using the Nanoptic 90 Plus.

Nanoparticle Size Analyzer-Nanoptic 90 Plus
Nanoparticle Size Analyzer: Nanoptic 90 Plus
 

Sample Preparation

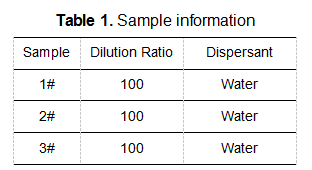
For three cyclosporin A solutions, the sample information is as follows:


info table of three cyclosporin A solutions
 
In the built-in temperature control system of the Nanoptic 90 Plus, the default test temperature is controlled to be 25℃. For these three samples, we set the temperature at 37℃ to simulate the temperature environment of human bodies.
 
Each sample was measured at least three times after it was placed in the sample cell, in order to check the repeatability.
 

Results and Discussion


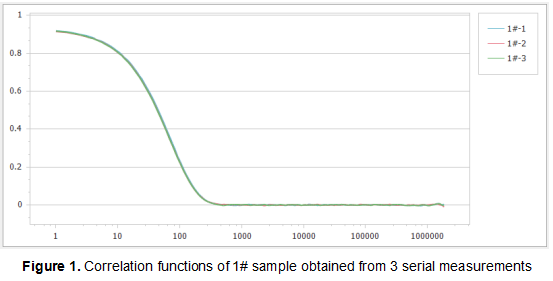
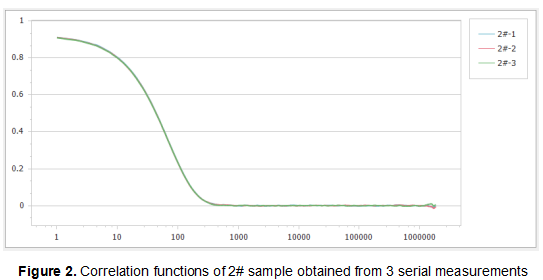
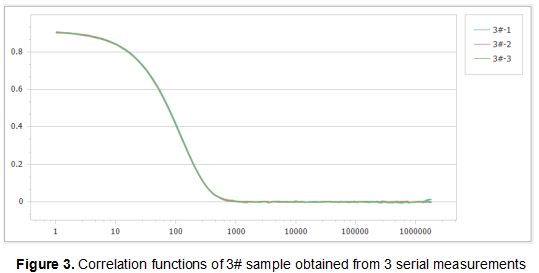
By analyzing the scattered signals of the samples, we obtained the correlation functions of these samples:


correlation functions of 1sample by Nanoparticle Size Analyzer
correlation functions of 2 sample by Nanoparticle Size Analyzer
correlation functions of 3 sample by Nanoparticle Size Analyzer
 
Figure 1, Figure 2 and Figure 3 show the correlation functions of the three samples. It can be seen that the repeatability of the results is excellent, which illustrates the high sensitivity and stability of the Nanoptic 90 Plus optical system.
 
particle size distribution of 1 sample
particle size distribution of 2-3 sample
particle size distribution overlay of 3 samples
 
Figure 4, Figure 5 and Figure 6 show the particle size distributions of the three samples in multiple measurements. It can be seen that the particle size distribution of each sample under such measurement conditions has reached good repeatability. Among them, a very small amount of coarse cyclosporin A aggregates were found in the distribution curves of sample 2# and sample 3#. The small content of these components may not affect the oral bioavailability of the drug, but the presence of a small amount of aggregates probably indicates the instability of the system. Therefore, it is worthwhile to continue characterizing the samples in future research, by observing whether the size and size distribution of these agglomerates change over time.
 
In Figure 7, the particle size distributions of the three samples are overlapped, and it can be seen that the particle size distribution of the 3# sample is significantly higher than the 1# sample and the 2# sample.
 
The results of multiple tests of samples are shown in the table below:
 
summary table of particle size distribution of 3 samples
 
From the particle size results, we can see the difference in the Z-average size of the three samples. The particle size of the 1# sample and the 2# sample are similar, whereas the particle size of the 3# sample is significantly larger than the first two samples. The relative standard deviation of repeated measurements is less than 3%, which shows that all samples are stable during the measurement. Through the distribution coefficient (PdI), we can see that for 3# sample, not only the size result is biggest, but also the PdI value significantly exceeds other samples, which may be related to the particular manufacturing process of the formulation.
 

Reference
[1] By Ben Mills - Own work, Public Domain, https://commons.wikimedia.org/w/index.php?curid=3644616
[2] By Yikrazuul - Own work, Public Domain, https://commons.wikimedia.org/w/index.php?curid=4318711
[3] Klyashchitsky, B.A., Owen, A.J., 1998. Drug delivery systems for cyclosporine: achievements and complications. J. Drug Target 5, 443–458.


Rate this article

Share On

share
facebook twitter linkedin